Elisabeth Andreolide Oliveira Institutode FsicadeUniversidadedeS~aoPaulo,
CaixaPostal66318, CEP05389-970, S~aoPaulo,S~aoPaulo,Brasil Received 08 September, 1998
Liquid crystals are very sensitive to surface eects. In fact, these eects are very useful in designing eletro-optical devices. We present a review of the theoretical models that describe the surface interactions in liquid crystals, focusing on lyotropic systems. Experimental results will be presented and compared to theoretical predictions.
PACS number(s):61.30.-v, 61.30.Gd, 64.70.Md,
I Introduction
Liquid crystals mesophases are present in materials composed of interacting molecules or aggregates of molecules with shape anisotropy. These materials can be divided in two categories according to the relevant parameter in the phase transitions; the thermotropic and lyotropic liquid crystals. In thermotropics, the building blocks are molecules, and the phase transi-tions are driven by variatransi-tions of temperature. Lyotropic systems are obtained by the dispersion of amphiphilic molecules in water, that assembly in anisotropic aggre-gates called micelles. The micelles can be seen as biaxial objects, with typical dimensions of (100x70x30)A. The phase transitions in lyotropics occur by temperature or concentration variations.
The mesophases are classied according to the sym-metry they exhibit. The simplest mesophase is the ne-matic phase, consisting of elongated molecules (or ag-gregates) that tend to align parallel to each other, with a long range orientational order but no long range po-sitional order. The average molecular orientation de-nes a vector n, called the director. More complex
mesophases can present some degree of positional or-der such as in the smectic phase where the molecules are organized in layers with one dimensional long range positional order[1].
The orientation of the director can be xed by an external eld or by the surfaces eects. The existence of a limiting surface introduces a perturbation in the
order of the molecules imposing some preferential orien-tation, that propagates to the bulk by means of elastic interactions. There are experimental evidences of for-mation of smectic layers in the nematic phase close to the nematic-solid and nematic-air interface, exhibiting both orientational and positional order[2, 3].This can be related to the break of the translational invariance of the molecules in the nematic phase in the limiting sur-face. Molecular dynamics simulation show that a rough surface induces a smetic layering within a few molecular lengths in a uniaxial nematic liquid crystal. Moving to-wards the bulk the positional order desapears, remain-ing only the orientational order along the direction xed by the surface [4].
small distortions in the orientation of the molecules, and when the eld is removed the orientation imposed by the substrate is dominant and propagates to the sample. Under the action of a magnetic eld H, the switching time is v ==(aH
2);where is the
rota-tional viscosity anda is the anisotropy of the
diamag-netic susceptibility[1]. For applied electric elds (E),a
is replaced by the anisotropy of electric susceptibility, and H is replaced by E.
II Surface eects
The interactions of the liquid crystal with the bound-ary surfaces are very complex and are far from being completly understood[6]. It has been proposed that the surface interactions can be described, in a phenomeno-logical approach, by an anisotropic energy FS that is
usually characterized by an anchoring strenghwand an easy-axisn
0, which corresponds to the preferential
ori-entation of the nematic phase, imposed by the bound-ary surface, in the absence of bulk distortions. The sim-plest expression ofFS was proposed long ago by Rapini
and Papoular [7]. According to these authors FS is
given byFS =
,(w=2)(n:n 0)
2, with typical values ofw
in the range of 10,3 to 10,1erg/cm2, for thermotropic
liquid crystals.
The validity of this Rapini-Papoular expression has been contested by some authors; it is argued that the correct expression ofFS should contain terms of higher
order in the expansion, only of even-order due to sym-metry n and ,n[8, 9, 10, 11]. However, other
au-thors suggest that the contribution of polar interac-tions at the interface should also be taken into account [12, 13, 14], which would include odd terms in the ex-pansion. There is also some discussion about the inter-pretation of experimental results [15]; it was shown that if the exo-electric eect arising from distortion in the bulk is taken into account, a good accordance with the Rapini-Papoular expression is obtained. Other eects can be present, like adsoprtion of ions at the bound-ary surfaces, resulting in an electric eld, that interacts with the nematic in the surroundings. The diculties concerning the interpretation of experimental results are due to the fact that many eects must be taken into account, some of them related to bulk eects that cannot be experimentally separated.
It has been recently shown that lyotropic liquid crys-tals exhibit anchoring properties very dierent with re-spect to thermotropic liquid crystals. Two orientation processes have been observed under the action of a mag-netic eld; a fast one related to the orientation of the director in the bulk, parallel to H, and a slow one, with a characteristic time () about 102larger than the bulk
one. This slow process has been related to the orienta-tion of the director in the surface layer [16, 17] and it was found that is proportional toH,2. If the surface
orientation process is completed, the nal orientation is uniform, with the director parallel to the eld. In this situation H can be removed, without any signi-cant change of orientation of the sample, and the nal state is stable.
A qualitative description of the structure of the sur-face layer can be obtained in analogy to thermotropic liquid crystals. In the surface layer, due to break of translational symmetry, the amphiphilic molecules would assembly in a bilayer structure, like in a lamel-lar phase. There are experimental evidences that the bilayer, in the lamellar phase, is not continous, but con-sists rather of amphiphilic islands surrounded by water [18]. Within this picture, one can imagine that reori-entation of the surface layer, consists of the reorienta-tion of the islands parallel to the magnetic eld. Since they are bigger than the micelles, the eective viscosity should be larger than in the bulk, what would explain the large response time. This reorientation process has been known as the gliding of the surface layer.
In a recent experiment, a Freederickz transition was used to estimate the anchoring energy of a lyotropic system in a planar conguration, assuming that the surface energy is described by the Rapini-Papoular ex-pression. The anchoring strenghtw, obtained from the experiment is about 10,3erg=cm2[19], which is
consis-tent with a weak anchoring. This description is not completly satisfactory, because according to this, there should be a relaxation process by removing the mag-netic eld, due to the surface energy. However, it gives some idea of the magnitude of the surface interaction.
phases.
III Experimental techniques
The lyotropic sample consists of a mixture of potas-sium larurate(LK), decanol (DeOH) and water, that presents a rich phase diagram, with uniaxial and bi-axial nematic phases. In this paper we refer to ex-perimental results obtained with dierent compositions and sequence of phases. The characteristic of the phases (uniaxial calamitic or discotic, or biaxial) is determined by measuring the birefringence as a function of the temperature[20].
The samples are encapsulated in at microslides (Vitrocom), 200m thick and 4mm wide. The inner surfaces of these microslides were examined in a inter-ferential microscope and it was observed that surfaces are plane, smooth, and without irregularities greater than 0,2m. No surface treatment was applied.
The reorientation process is observed by measuring the transmittance of the sample between crossed polar-izers, as a function of the time, when the magnetic eld is applied. The orientation of the polarizers is chosen to have the maximum of transmittance at t= 0;when the director is parallel to the x axis. The direction of the magnetic eld makes an angle= 45oCwith thex
axis. The experimental setup is described in detail in ref[17].
The experimental curves of transmittance are com-pared to calculated curves for some prole of the di-rector. The sample is assumed as a non-homogeneous optically anisotropic medium, that can be divided into many thin layers, with a uniform orientation in each layer. The propagation of the ligth through this medium can be calculated using Jones matrix, where in each layer there is a phase shift between the ordinary and extraordinary rays, and a rotation of the direction of the polarization of the light[17].
IV Dynamic behavior of the
sur-face layer
Lyotropic liquid crystals are composed of biaxal mi-celles, that can undergo simultaneously shape and ori-entational variations due to variations of temperature or concentration. In the biaxial phase one can dene
three directors, which coincide wiht the symmetry axes of the micelles. The two uniaxial nematic phases can be explained by orientational uctuations. One of the particular features of lyotropic liquid crystals is the pos-sibility of the gliding of the director in the surface layer. Let us rst analyse the factors that can inuence the surface reorientation process in both thermotropic and lyotropic liquid crystals.
The order parameter in thermotropic liquid crys-tal increases continuously from the bulk to the surface, which is usually called excess surface order. In addi-tion, the surface viscosity is higher than the viscosity in the bulk. In this case, the surface is strictly two-dimensional, and although the magnetic and the elas-tic torques have the same order of magnitude, only the elastic torque acts on the surface[1]. Then the action fo the magnetic eld on the surface is indirect, (by means of the twist distortion in the bulk), thus would be proportional to 1/H. But in a lyotropic liquid crys-tal this result is in contradiction with the experimencrys-tal results[17]. Strong anchoring of the micelles at the sur-face leads to the formation of a sursur-face layer with an order dierent with respect to the order in the bulk. Due to the anchoring, the symmetry plane of the sur-face xes the orientation of one of the directors, mak-ing the order of the surface layer biaxial. One director is always perpendicular to the susbstrate and the two others can rotate in the plane. Therefore, there is a surface layer, of nite thickness and two-dimensional orientational order. Because of its nite thickness, the surface layer can interact directly with the magnetic eld, in addition to the elastic interaction, that takes place mainly in the boundary which separates the biax-ial interface from the bulk. It creates an elastic torque between the two parts of the liquid crystal with dier-ent order, so it is much smaller than the elastic torque in thermotropic liquid crystals. This leads to a twist of the director in the bulk, which is much less pronounced than it would be for a thermotropic.
In the bulk the order parameter is the three-dimensional second rank tensorQij: Let us call r, the
modulus of the nematic order parameter in the bulk, which depends only on the temperature. Thus the components ofQij are 2 = re
i`', and
,2 = re ,i`'
where ,2 ` 2 and ' is the angle between the
the surface layer is described by the tensor qij, with spherical components s = q xx ,iq xy = e
i2, and s = q xx+ iq xy = e
,i2, where
is the modulus of
the nematic order parameter in the surface layer, and is the angle between the orientation of the director in the surface layer and thexaxis. This tensor has two
or-thogonal eigenvectors;e +and
e
,, which represent the
two directors of the biaxial surface layer, in the plane parallel to the boundary surface.
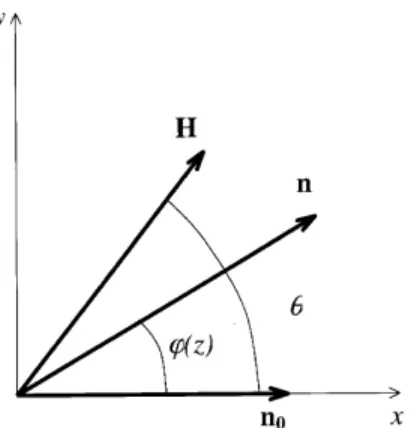
Figure 1: A planar nematic liquid crystal sample, homoge-neously oriented along thex axis att = 0. The magnetic eld is applied at anglewith respect to the x-axis. In the twisted state'(z) is the angle between the director nand thex-axis. At the surface layer the orientation of the direc-tor is given by the angle which does not depend on z, but only on the timet.
Let us consider a semi innite sample, with a bound-ary surface located at z = 0. At t = 0 the director is
oriented along thexaxis and a magnetic eldHis
ap-plied parallel to the boundary surface, making an angle
with respect toxaxis (Fig. 1). The initial orientation
corresponds tonparallel to the eigenvectore
+, which
corresponds to the direction of the biggest dimension of the amphiphilic aggregates. Since the reorientation of the director in the bulk is much faster than in the surface layer, we will consider that att= 0 the director
in the bulk is parallel toH:With the time the surface
layer will glide to a new equilibrium orientation, given by (t):It is important to note that depends only on
the time, and does not depend onz. Near the boundary
with the surface layer the twist appears with the limit angle'(z!0) ='
0
6
= 0:
The free energy of the system, consists of the free energy of the surface layer (F
S) and the free energy of
the bulk due to the distortion introduced by the mag-netic eld (F
V). We introduce also a contribution due
to the coupling between the order of the bulk and sur-face layer, (F
SV). Then we can write the free energy
per unit area as:
c
F = F
V0+ Z 1 0 " K 2 d' dz 2 + 12 a H 2 Z 1 0
cos2( ,')
#
dz+ (1)
F S0 , 1 2DH 2 cos 2
,Crcos 2( ,' 0) d where F S0 and F
V0 are the free energies of the non
perturbated state andK is the elastic constant of the
liquid crystal. The last term in eq. 1 represents the coupling of bulk and the surface layer, involving bothr
and: The coupling constantC can be either positive
or negative. The surface free energy is due to the direct interaction of the surface layer with the magnetic eld, by means of a coupling constantD, positive.
The orientational dynamics of the system is de-scribed by Landau-Khalatnikov equations, in other terms by the balance of magnetic, elastic and viscous
torques acting on the bulk and on the interface;
K d 2 ' dz 2 = a H 2sin(
,')cos(,'); (2)
Crsin2(' 0
,) =,K d' dz z!0 ; (3) , d
dt = 12 DH
2sin2 +
Crsin 2(,' 0)
; (4)
where is the rotational viscosity of the surface layer.
bulk and eq. 3 to the balance of the torque in the boundary of the bulk and surface layer. The last equa-tion represents the reorientaequa-tion of the director in the surface layer, where the elastic torque and magnetic torque are equilibrated by the viscous torque. From eq. 2, one obtains;
d' dz
= 1
cos2( ,' 1) ,cos 2( ,') 1=2 ; (5) where 2 = (
K = a)
=H
2, is the magnetic coherence
length and' 1=
'(z!1). Since far from the
bound-ary surface, the director is parallel to the magnetic eld,
' 1 =
. The prole of the director in the bulk, is
ob-tained by integration eq. 5, with the proper boundary conditions in the interface;'(z!0) = :This gives;
'
2 =
2,arctan exp , z tan , 2 (6) In eq. 5, taking the limit forz!0;and substituting
in eq. 3, it results that;
Crsin 2(' 0
,) =, K
sin(,' 0)
: (7)
Assuming small deformations in the surface layer and in the boundary to the bulk, the above equation can be linearized and solved to nd '
0= ' 0( H); ' 0= , 1, ; (8)
where =H=H
0 and H0= p
K a
=(2Cr):
The dynamical behavior of the surface layer can then be obtained linearizing eq. 4 and with the calcu-lated value of'
0. This leads to the following diferential
equation: , d dt = DH 2
,2Cr
1,
+ 2Cr
1, ; (9)
which can be easily integrated to obtain the orienta-tion of the director in the surface. Imposing the proper boundary conditions, one can write the solution;
(t) =(1,e ,t=)
; (10)
where is the characteristic time of the reorientation of
the surface layer. The expression for can be simplied
to show the dependence on H: 1 = 1 0 H 2 H 2 t , H H,H
0
; (11)
with 1= 0= 2
Cr=andH 2 t = 2
Cr=D:For large elds,
1/ is proportional to H
2 and the contribution of the
second term in eq. 11 can be neglected. The meaning of the H0and Htare illustrated in Fig. 2. For C
>0 and
D>0, 1=
0is positive and H
tis real.
Figure 2: Dynamics of the gliding director in the biaxial sur-face layer. The model predicts that 1/ is proportional to H2, for high elds. The values of
H 2 0 and
H 2
t are related to the phenomelogical constants of the free energy expansion, forC>0 andD>0.
An interesting behavior is obtained if we consider the case when the elastic interaction with the bulk and the magnetic torque try to orient the interface director in dierent directions. This happens when C<0 and
D>0. The magnetic torque tries to oriente
+ parallel
to H, while the elastic interaction with the bulk tries to oriente
, parallel to the magnetic eld. This situation
may occur in the bulk biaxial phase, where all the three bulk directorsn
i are ordered.
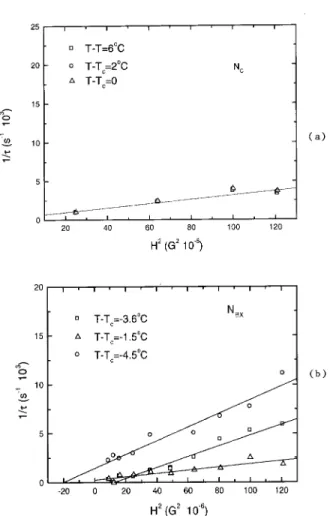
The characteristic time of the surface reorientation process was experimentally determined by transmit-tance measurements in uniaxial calamitic and biaxial nematic phases. In the analysis of the experimental curves of transmittance it was assumed that the sample was uniformly oriented parallel to the magnetic eld, except in the thin boundary layers of thickness. In
this simple three layers model, the orientation of the di-rector in the surface layers was considered to follow the eq. 10[17]. The experimental values are shown in Fig. 3, in the nematic calamitic (a) and biaxial phases (b), where Tc is the temperature of the calamitic to
biax-ial phase transition in the bulk. The calculated values of 1/
0 and H 2
t for dierent temperatures in the
the dynamical behavior, as is shown in Fig. 4. When the temperature is decreased towards the biaxial phase, both parameters change sign.
Figure 3: Experimental values of the characteristic time for the surface reorientation process. a) Lyotropic sample in the calamitic and b) in the biaxial nematic phases. Tc is the temperature of the calamitic to biaxial nematic phase.
A detailed investigation of the reorientation of the surface layer in the calamitic phase in the region of very low elds revelead a striking behavior. The simple three layers model for the prole of the director is suitable for high elds, but below a certain value it cannot be used to t the experimental curves of transmittance. Then, the tting was perfomed taking the prole described by eq. 6. and allowing the gliding of the surface layer; = (t). In the tting it was considered the
possi-bility that the nal orientation of the surface could be dierent from the one imposed by the magnetic eld.
Figure 4: Dependence of the parameters (a) 1/
0 and (b) H2
t on the temperature.
(t) = f(1
,e
,t=) (12)
where 0< f
< and f = (
t>>) gives the nal
orientation of the director in the surface.
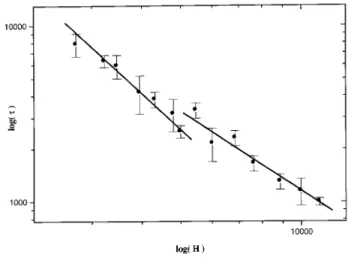
The experimental values of as a function of H are
presented in Fig. 5. In a log-log plot, we notice that are two lines, with dierent inclinations, changing the be-havior forH 5000G:For elds below this value, the
curves of transmittance were tted with a continous prole of the director, given by eq. 6 (arctan prole)
resulting in proportional to H
,2. For elds higher
than 5kG, the tting was possible only with the
dis-continous prole of the director (three layers model).
In this case, it is observed that is proportional to H
,3=2
:We supose that for high elds, there is a
Figure 5: Experimental values of (surface reorientation time) as a function of H, for a nematic sample in the calamitic nematic phase. It is noticeable the change in the dynamical behavior for H5000G:The inclination is dif-ferent in each branch of the line.
V Equilibrium states
We will consider that in the equilibrium states there is no discontinuity in the orientation in the boundary that separates the surface layer and the bulk, this means that the twist is continous and '
0
! . However, if
the nal state is distorted, it means that the elastic torque is being equilibrate by a surface torque.
Let us consider the situation where the director in the surface layer is oriented along the directionn
0and
there is a torque ,e, that tends to align the director
parallel to the magnetic eld. ,e is the elastic torque;
,e=
K(d'=dz), with the value ofd'=dzgiven by eq. 5.
The reorientation of the director at the surface strongly depends on the kind of coupling originating the sur-face orientation. If the anchoring is strong, the aver-age orientation of the director at the surface will re-main parallel ton
0for any applied torque. However, if
the anchoring is weak, and H is larger than a critical
value, the torque applied by the eld is able to reorient the director to break the physical "bonds" between the molecules of the liquid crystal and the substrate.
This phenomenon is similar to the dry-friction of a body on a solid substrate, if a force is applied to the body it starts to move when the applied force becomes larger that a critical value[22]. This critical value de-pends on the nature of the two bodies in contact, and due to its statistical nature, it does not depend on the position of the body. If the body is moving and the
applied force is removed, it will stop, without returning to its original position. According to this picture the reorientation of the director in the surface layer of the lyotropic liquid crystal is similar to the dry friction phe-nomenon. In this case, instead of a critical force, we are dealing with a critical torque that must be applied to break the molecular interactions between the substrate and the liquid crystal medium. If the elastic torque is smaller than the critical torque the orientation of the director at the surface is = 0, if it is larger, then the orientation of the director in the equilibrium will be ob-tained from the balance of the elastic and "dry friction " torque (,d), expressed as;
K
cos2( ,'
0) ,cos
2( ,)
= ,d
: (13)
The critical condition is obtained when ,e( H) = ,
d,
and this occurs for a certain eld,H
C, that is called the
surface critical eld. ForH =H
C, = 0
;and we will
assume that in the bulk the director is parallel toH; '
1=
:With these assumptions in eq.13, one obtains
the threshold condition;
K
sin = ,
d= ,c
; (14)
which denes the value ofH C; H
C(
) = , dsin
p
K a
: (15)
If the value of H
C is experimentally determined, one
calculates the "dry torque " from the above equation. Taking ,d given in eq. 14, the orientation of director
in the surface is then calculated, as a function ofH;
=,arcsin
H C(
)sin H
(16) The measurement of the transmittance, as described in the previous sections, allows the determination of
and as a function ofH:The experimental results are
shown in Fig. 5 (for ) and in Fig. 6(a), for as a
function ofH. Each point corresponds to an average
of several measurements, with an uncertainty of 2o Cin
the value of :The value of starts to be dierent from
zero forH 1000G; increasing fast and tending to a
saturation regime, but with a jump for H 5000G:
For the same value ofH there is a discontinuity in the
Figure 6. (a) Final orientation of the director in the surface layer for a lyotropic nematic sample in the calamitic ne-matic phase. (b) The solid curve corresponds to the tting obtained from eq. 19, assumingH
C= 1000
G:
Three dierent states are clearly indentied; I- for elds lower than than 1000G;where there is no
reori-entation of the surface layer. The reorireori-entation takes place only in the bulk and it is a reversible process. The state II, corresponds to a critical state, where the nal orientation is uniform, with the orientation of the director in some intermediate direction between the ini-tial one and the one imposed by H. The reorientation
is a non reversible process. Finally the state III, corre-sponds to a uniform orientation with the director par-allel toH, everywhere in the sample. The reorientation
induced by the magnetic eld is also a non reversible process.
According to the dry-friction model, only one criti-cal state was expected, the state II. However we observe that there are two critical states. The discontinuity be-tween the states II and III, seems to indicate that there is no more an elastic coupling between the surface layer
and the bulk.
We will reanalyse this problem, considering that, in addition to the dry-friction like interaction at the sur-face, there is also an elastic interaction, given by the Rapini-Papoular expression. Therefore, the torque in the surface due to the surface interactions can be writ-ten as:
,S = dF
S d =
w
2 sin(2) + ,d
; (17)
wherewis the anchoring strength of the anchoring
en-ergy. The equilibrium at the surface is obtained by the balance of the surface and elastic torques:
,d+ w
2 sin(2) =K
sin(,' 0)
: (18)
When the applied torque , is equal to the critical torque ,C, the director in the surface is still parallel to
n 0
;and
= 0: It results that the critical torque is still given
by eq. 14. However the dependence of onH, is:
1
= (w=2K)sin2 + (1= )sin
sin(,)
: (19)
This equation shows that for H!1( !0);leads to
! : If H is removed, the nal state is stable and
homogeneous, along (given by the above equation) if the elastic torque in the surface is smaller than the critical one;
w
2 sin2<, C
: (20)
If the above condition is not fullled, the nal state is not homogeneous and the nal orientation will be along 0 given by:
w
2 sin20= , C
: (21)
According to this model, ifH >H
C; the nal state
is a critical state, and the orientation of the director in the surface does not return to the initial orientation if the eld is removed. For H < H
C
; there is no
re-orientation of the director in the surface layer, only in the bulk. In this case if the eld is removed, there is a relaxation in the bulk, and the initial orientation is recovered; the system behaves as if there was a strong anchoring.
From the experimental curve, one can obtain the surface critical eld, H
C = (1000
the threshold condition. eq.14, one calculates the crit-ical torque; ,C = 7x10
,5erg=cm2. The experimental
curve of (H) can be tted, using eq. 19, taking w
as the tting parameter. The tted curve is presented in Fig. 6b, for a value of w= 8x10,5erg=cm2, which
corresponds to a weak anchoring strength. However, the saturation regime, = , occurs with a jump in (H), and not continously, as could be expected from the model developed above. Moreover, the saturation would occur for very high magnetic elds.
VI Conclusions
In conclusion, the specic properties of the lyotropic liq-uid crystals with biaxial deformable micelles can lead to the formation of the biaxial surface layer. The model discussed above shows that the dynamic behavior can be explained, if we assume a direct interaction of the surface layer with the magnetic eld. It is also shown that the magnetic eld induces the reorientation of the surface layer, leading to a critical state. This reorien-tation process can be non reversible for magnetic elds higher than the surface critical eld H
C: The value of
H
C can be experimentally determined. To explain the
existence of the surface critical eld we introduced in the surface energy a "dry friction-like" energy, related to the complex molecular interactions between the liq-uid crystal and the substrates. Despite the aproxima-tions introduced in the calculaaproxima-tions, there is a good accordance with the experimental observations. The second critical state, withnparallel toH, seems to be
related to the breaking of the elastic coupling between the surface layer and the bulk. This problem is being in-vestigated; the third state would exist when the torque at the interface between the bulk and the surface layer overcomes a critical value [24]..
Finally, for further detailed description of the re-orientational behavior of the biaxial surface layer one needs to determine the phenomenological constants in-troduced in the expansion of the free energy (eq. 1). The structure of the tail of the transmittance curve (t >> ) can bring a part of this information[25].
References
[1] P. G. de Gennes and J. Prost, The physics of liquid crystals, Clarendon Press, Oxford (1991).
[2] C. Rosenblatt and N. M. Amer, Appl. Phys. Lett.36, 432 (1980).
[3] J. P. Nicholson, J. Phys. (Paris)48, 131 (1987). [4] J. Seltzer, P. Galatola and G. Barbero, Phys. Rev. E
55, 477 (1997).
[5] J. Funfshilling, Cond. Matt. News1, 12 (1991). [6] B. Jer^ome, Rep. Prog. Phys.54, 391 (1991).
[7] A. Rapini and M. Papoular, J. Phys. (Paris) Colloq. 30, C4-54 (1964).
[8] K. H. Yang and C. Rosenblatt, Appl. Phys. Lett.43, 62 (1983).
[9] T. J. Sluckin and A. Poniewierski, Phys. Rev. Lett.55, 2907 (1983).
[10] H. Yokohama and H. van Sprang, J. Appl. Phys.57, 4520 (1985).
[11] J. Stelzer, L. Longa and H-R. Trebin, Phys. Rev. E55, 7085 (1997).
[12] J. D. Parson, Phys. Rev. Lett.41, 877 (1978). [13] S. Naemura, Mol. Cryst. Liq. Cryst.68, 183 (1981). [14] M. A. Osipov, T. J. Sluckin and S. J. Cox, Phys. Rev.
E55, 464 (1997).
[15] G. Barbero and G. Durand, J. Phys.(Paris), Colloq47, 2129 (1986).
[16] E. A. Oliveira, A. M. Figueiredo Neto and G. Durand, Phys. Rev. A44, R825 (1991).
[17] R. F. Turchiello and E. A. Oliveira, Phys. Rev. E54, 1618 (1996).
[18] M. C. Holmes and J. Charvolin, J. Phys. Chem.88, 810 (1984).
[19] A. M. Ribas, L. R. Evangelista, A. J. Palangana, E. A. Oliveira, Phys. Rev. E51, R5204 (1995).
[20] Y. Galerne and J. P. Marcerou, Phys. Rev. Lett.51, 2109 (1983).
[21] V. L. Lorman, E. A. Oliveira and B. Metout, Phys. Lett. A231, 283 (1997).
[22] E. A. Oliveira, G. Barbero, A. M. Figueiredo Neto and A. K. Zvezdin, Phys. Lett. A222, 113 (1996). [23] L. M. Vega, J. J. Bonvent, G. Barbero and E. A.
Oliveira, Phys. Rev. E57,R3715 (1998).
[24] A. L. Alexe-Ionescu, L. M. Vega, J. J. Bonvent and E. A. Oliveira, to be published.