Short Report
S
Printed in Brazil - ©2012 Sociedade Brasileira de Química 0103 - 5053 $6.00+0.00*e-mail: [email protected]
Determination of Phenol and
o
-Cresol in Soil Extracts by
Flow Injection Analysis with Spectrophotometric Detection
Rafael G. Dolatto,a Iara Messerschmidt,a Betânia F. Pereira,b
Carlos A. P. Silveirac and Gilberto Abate*,a
aDepartamento de Química, Centro Politécnico, Universidade Federal do Paraná,
CP 19081, 81531-990 Curitiba-PR, Brazil
bCentro de Pesquisa Agropecuária de Clima Temperado, FAPEG/EMBRAPA,
BR 392, km 78, CP 403, 96001-970 Pelotas-RS, Brazil
cCentro de Pesquisa Agropecuária de Clima Temperado, EMBRAPA,
BR 392, km 78, CP 403, 96001-970 Pelotas-RS, Brazil
Neste trabalho, propõe-se a determinação de fenol e o-cresol por análise por injeção em fluxo (FIA) com detecção espectrofotométrica, utilizando a reação com 4-aminoantipirina, a fim de quantificar essas espécies em extratos de solo. Após otimização das condições por planejamento fatorial, constatou-se uma maior frequência de amostragem em comparação com o método convencional, bem como valores de recuperação, limites de detecção e de quantificação comparáveis para ambos os métodos. Tais aspectos sugerem que esse método pode ser uma alternativa viável para a determinação de compostos fenólicos em extratos de solos.
Phenol and o-cresol determination by flow injection analysis (FIA) with spectrophotometric detection, employing the 4-aminoantipyrine reaction, is proposed in this work in order to quantify these species in soil extracts. The method was improved by a factorial planning, being verified a higher sampling rate in comparison with the conventional method, and recovery values, limits of detection and quantification similar for both methods. These aspects suggest this method as a feasible alternative for phenolic compound determinations in soil extracts.
Keywords: phenolic compounds, soil extracts, FIA
Introduction
The phenolic compounds are present in soil mainly due to the humic substances, lignin and tannin decomposition. They are produced in aquatic medium by algae, plants, invertebrates and in urine of animals.1 Nevertheless,
the anthropogenic activities can be considered as the main source of phenols in the environment. This class of compounds is generated by domestic sewage, in the disinfectant composition, wood preservatives and pesticides, as well as byproducts from several industrial processes as cellulose production, oil refineries and synthetic resins.2,3
Because of the widespread use of phenolic compounds around the world and their toxicity, that can cause several
chronic effects, these compounds are listed as priority pollutants by U. S. Environmental Protection Agency (EPA)4 and European Union.3 Besides, these contaminants
have unpleasant organoleptic properties, affecting the taste and odor of water and fish at levels of µg L-1. As a
result, the maximum concentration of individual phenols in drinking water is 0.1 µg L-1, while for total concentration
is stated 0.5 µg L-1, according to decision No. 2455/2001/
EC of the European Parliament and of the Council.5 The
inappropriate disposal of contaminated industrial residues by phenolic species in soils may be a source of pollution of surface and groundwater owing to the leaching process.6,7
charge of the soil particles and the phenolic compounds.8
Hence, the above mentioned leaching process is highly favorable.
In consequence of the large use of phenolic compounds, allied to their high toxicity and the mobility in soil, the analytical methods for phenolic compound determination in water and soil are of prime importance. The technique of high-performance liquid chromatography (HPLC) and capillary electrophoresis (CE) have been largely employed for quantification of phenolic compounds,5,9,10 using
ultraviolet (UV), electrochemical or mass spectrometry (MS) detection. Gas chromatography (GC) coupled to flame ionization (FID), electron-capture (ECD) or MS detectors may be used. However, the high polarity and the low volatility of this class of compounds are a drawback since a derivatization process is required, and thus, the GC use has been avoided.11 These techniques show the
advantage of good selectivity and sensibility, especially for environmental determinations. On the other hand, high volumes of toxic solvents are employed and low sampling rate are attained (mainly due to the sample preparation) in order to obtain the clean up and enrichment steps. Other possibility is the compound determination by UV molecular absorption spectrophotometry,6,8 but with higher limit of
quantification, as well as several spectral interferences. The official spectrophotometric method of 4-aminoantipyrine (4-AAP) presents better selectivity and LOQ for total phenolic determination in aqueous samples.12 This method
is based on the 4-aminoantipyrine reaction with phenolic species in the presence of potassium ferricyanide (at pH 7.90), providing an intense red color development of the pyrazolones group, with maximum absorption in the wavelength of 510 nm.12 As the 4-AAP reaction
is an official and well-established method for phenolic compound determinations in water samples, it has been used for comparison purposes in the development of new methods.13-15 Many times, the method is tedious and
time-consuming since a distillation step is necessary to separate the phenolic species from the aqueous matrices due to spectral interferences, specially by organic matter.12
A valuable approach to analytical method automation is the system based on flow analysis, especially flow injection analysis (FIA) and sequential injection analysis (SIA), coupled to various detection systems.16 The flow systems minimize
the analyst intervention, increase the sampling rate and improve the precision of the measurements. Moreover, they show great potential to the development of cleaner analytical methods owing to the lower waste generation.17,18
The methods employing flow analysis have been successfully applied to the phenolic compound determination in water samples, coupled to electrochemical detectors19,20 and mainly
to spectrophotometric detectors.2,13-15,21-29 These works are
related to water analysis, and until this moment, only the one from Zhi et al.23 deals with the quantification of phenolic
species in soil extracts by spectrophotometry coupled to flow system.
Few works have been devoted for the phenolic species determinations in soil extracts by the conventional spectrophotometric method using 4-AAP. In spite of the usually high organic matter content in soil samples, previous distillation or solvent separation step has not been employed for the phenolic compound quantifications in soil extracts using the 4-AAP method.8,23,30 The present
study was accomplished to evaluate the presence of phenol and o-cresol in soil extracts since water derived from a shale industry could be used as soil conditioner in order to supply micronutrients in soil. Notwithstanding this, the water is rich in toxic phenolic compounds, and for this reason, the concentration ranges of phenol and
o-cresol under investigation in this work are relatively high. Thus, the goal of the present work was to investigate the possible influence of soil extract matrices on the phenol and
o-cresol quantification, employing the 4-AAP conventional spectrophotometric method. Additionally, a comparative study between this method and the same mechanized method by FIA was performed by a factorial planning, being both methods compared based on the recovery results. The main aspect to be studied in the FIA method was the sampling rate improvement owing to the great number of analytical steps in the official method of analysis.
Experimental
Apparatus and reagents
For the conventional absorbance measurements, a Shimadzu UV 2401 PC spectrophotometer with a quartz cell (1.0 cm) was employed, being the maximum absorption wavelength (the intense red color) for the reaction product formed between 4-AAP and phenol or
o-cresol at 510 nm. For the FIA experiments, a Femto 700 Plus spectrophotometer with a Hellma U-flow quartz cell with 1.0 cm of light pathlength was used, with a Femto FemWin670 1.2 program for the data acquisition. An Ismatec 78016-30 peristaltic pump was used to drive the solution to the flow cell, fitted out with Tygon® and
polyethylene tubing, both with 0.8 mm i.d. The injections of the sample or of the standard volume were made by a manual injector-commutator previously described in the literature.31 A Gehaka, PG 2000 potentiometer (resolution
calibrated with 4.00 and 7.00 buffer solutions. Water used in all experiments was distilled and deionized using the Simplicity system from Millipore, with an UV lamp. Other auxiliary equipments, such as an analytical balance (± 0.1 mg), orbital shaker, centrifuge and micropipettes, were employed to perform the experiments.
The standards of phenol and o-cresol, as well as the colorimetric 4-AAP and all the reagents, were acquired from Merck, Aldrich, Carlo Erba or from similar analytical quality. Both standards were prepared in concentrations of 1000.0 mg L-1, being standardized by the bromide-bromate
method,12 and stored in stoppered amber glass bottles at 4 oC.
Soil sample
A soil sample without herbicides or other chemical application was employed in all experiments. The sample was collected in the experimental area of Embrapa Clima Temperado in the region of São Mateus do Sul City, Paraná State, Brazil. The soil fraction (< 2 mm) was air-dried for 3 days, kept in an oven at 60 oC for 24 h and stored in a
desiccator to be employed as a representative soil sample in further experiments. Some characteristics of this soil sample are: pH of 4.50 ± 0.01, in 0.010 mol L-1 CaCl
2
solution, the sand, silt and clay contents were 2.6, 31.1 and 62.3%, respectively, the carbon content was 3.7 ± 0.3%, and the cation exchange capacity (CEC) 31.4 ± 0.3 cmolc kg-1.
These results and a complete characterization of the soil sample were described elsewhere.8
Determination of phenol and o-cresol by spectrophotometry
The colorimetric reagent, 4-AAP solution, was prepared in concentration of 1.00 g L-1. Potassium ferricyanide
solution was used in concentration of 8.00 g L-1, with pH
previously adjusted at 7.9 ± 0.2, by using 0.50 mol L-1
phosphate buffer. Analytical curves were obtained in triplicate, with five phenol or o-cresol standards in concentrations between 0.50 and 8.00 mg L-1 in 0.01 mol L-1
CaCl2 solution. This procedure was similar to literature 12
with minor modifications.
Determination of phenol and o-cresol by spectrophotometry
coupled to FIA
A previous evaluation of some parameters was made in order to obtain the better absorbance signal. The flow rate, concentrations of the 4-AAP and K3[Fe(CN)6] solutions, pH
of the K3[Fe(CN)6] solution, volume of the sample loop and
of the reaction coil were investigated. Afterwards, these three last factors were studied by a 23 factorial planning
in two different levels: (i) pH of the K3[Fe(CN)6] solution
(6.2 and 11.0), and (ii) volumes of the sample loop (200 and 400 µL) and of the reaction coil (150 and 300 µL). A simple FIA system was used for this study, as showed in Figure 1. Six standard phenol or o-cresol solutions with concentrations between 0.50 and 16.00 mg L-1 were used for
construction of the analytical curves, being each standard or sample injected three times.
Determination of phenol and o-cresol in soil extracts
A mass of 10 g (± 0.1 mg) of the soil sample was maintained in contact with 300 mL of 0.01 mol L-1 CaCl
2
solution in stoppered amber glass under gentle orbital shaking for 96 h. Then, the soil suspension was centrifuged at 2500 rpm for 10 min, being the supernatant phase reserved for the experiments. An appropriate volume of 25.0 mL was spiked with phenol in order to provide concentrations of 1.00, 10.00 and 50.00 mg L-1, and
the same procedure was carried out for o-cresol. These solutions were kept under shaking for 15 min, and after that, the analytes were quantified by the conventional and FIA methods, with suitable dilution when necessary. A blank experiment was done in parallel. All these procedures were performed in triplicate.
Phenol and o-cresol recovery after contact with soil
A mass of 1 g (± 0.1 mg) of the soil sample was maintained in contact with 30.0 mL of 50.00 mg L-1
phenol or o-cresol solution in 0.01 mol L-1 CaCl
2 medium
for 96 h in amber glass. The solutions were agitated, centrifuged and the supernatant phases separated as in the previous procedure. The phenol and o-cresol concentrations
Figure 1. OptimizedFIA diagram of the system for phenol and o-cresol quantification. C: deionized water as carrier; R1: 2.00 g L-1 K
3[Fe(CN)6]
solution at pH 11.0; R2: 1.00 g L-1 4-AAP solution at pH 10.0 ± 0.2 buffered
by H3BO3, KOH and NaHCO3 solutions; S: Sample; SV: sample volume
(400 µL), injected with the aid of a injector-commutator; RC: reaction coil (60 cm, volume of 300 µL); D: spectrophotometric detection at 510 nm. The i.d. of the Tygon® tubing in peristaltic pump, RC and for the analytical
were quantified by both methods. Two additional aliquots of the supernatant phase were fortified with phenol and
o-cresol and submitted to a new analysis process.
The residual soil was treated with 25.0 mL of 0.10 mol L-1 NaOH solution32 in 0.01 mol L-1 CaCl
2
solution. The solutions were kept under shaking for 1 h, centrifuged, and a volume of 0.40 mL of HCl was added in order to provide pH close to 2.0. The suspension was centrifuged and the phenol and o-cresol concentrations were determined in the supernatant phases by both methods. In parallel, two aliquots of the supernatant were spiked with the phenolic compounds separately to proportionate 1.00 mg L-1, and a new analysis was carried out.
Results and Discussion
Optimization of the FIA system
An initial study was made based on the variation of the potassium ferricyanide and the 4-AAP concentrations, as well as different possibilities of reagent confluences. The flow configuration previously optimized is showed in Figure 1. For 4-AAP, it should be emphasized that the same concentration was employed (1.00 g L-1), whereas a
smaller K3[Fe(CN)6] concentration of 2.00 g L-1 could be
used instead of 8.00 g L-1 for the usual method. During
the development of this study, it was verified that the parameters sample volume, volume of the reaction coil and pH of potassium ferricyanide (used as oxidizing agent) caused the most relevant influence in the analytical signal. Moreover, it was confirmed that the better flow rate values were between 1.20 and 2.20 mL min-1, and for this reason,
a flow rate value of 1.80 mL min-1 was adopted in all
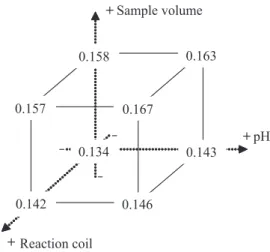
experiments. A subsequent study by 23 factorial planning
was carried out, and the results of the eight experiments are shown according to Figure 2.
All experiments were carried out in random order to eliminate environmental variance, and the significance of the effects was checked by application of variance analysis. The estimated standard deviation was evaluated according to Barros Neto et al.,33 who considered the average of the
sample variance, which was weighted by the respective degrees of freedom.
The calculus of the effects for the levels at which the variables were studied shows that the pH change from 6.2 to 11.0 had small influence on the absorbance of the product from the reaction between phenol and 4-AAP. This can be stated because the effect (0.007) is close to the standard deviation (0.002) of the experiments. On the other hand, when the sampling loop with higher internal volume was used (from 200 to 400 µL), there was a significant effect,
an average absorbance increase of 0.02. Higher sample volumes were tested, but an enlargement of the peaks were observed. There was an absorbance increase of 0.003 when the reaction coils were tested (from 150 to 300 µL), but this effect was not significant, as well as the interaction effects between the factors.
Briefly, the best conditions used under flow conditions were: 1.00 g L-1 4-AAP concentration, 2.00 g L-1 K
3[Fe(CN)6]
concentration, pH 11.0, flow rate of 1.80 mL min-1,
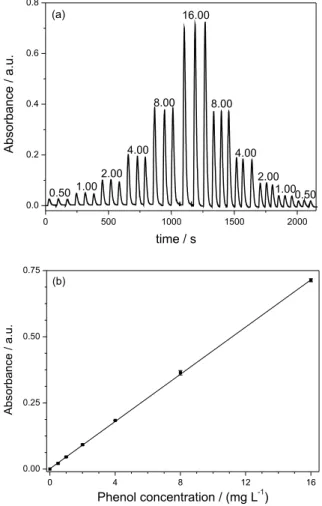
sample volume of 400 µL and reaction coil of 300 µL. Based on these conditions, the absorbance transient signals (Figure 3a) were used to plot the analytical curves (Figure 3b).
According to Figure 3a, the peak heights showed relative standard deviation (RSD) values of 5.4% (0.50 mg L-1),
4.8% (2.00 mg L-1) and 0.7% (8.00 mg L-1) for triplicate
injections, being appropriate to construct the analytical curve (Figure 3b). A linear response was verified between 0.50 and 16.00 mg L-1 (Figure 3b), and no differences
were observed in absorbance signals after two sets of injections, suggesting no occurrence of memory effects. Under the previously optimized experimental conditions, a sampling rate near 50 analyses per h can be expected, one of the purposes of this work. Although not shown, all steps were also carried out for o-cresol, and the results were very similar to those in Figure 3. On the contrary, p-cresol practically showed no signals with 4-AAP, hindering its quantification by this method. This drawback was previously reported in the literature,8,12,28 and consequently,
p-cresol was not studied in the present work. Table 1 presents the figures of merit from the proposed method, in comparison with the conventional spectrophotometric method (namely APHA method) for triplicate experiments.
FIA method a range between 0.50 and 16.00 mg L-1
was employed. These values were based not only on the linearity, but also on the expected concentrations of phenol and o-cresol in soil samples, showing a linearity with correlation coefficient (r) values higher than 0.9990. The limits of detection (LOD) and of quantification (LOQ) were calculated by the expressions 3s/S and 10s/S, respectively, where s denotes the standard deviation of the intercept and S the slope of the curves. A better sensitivity was verified for the APHA method, close to three times the
observed one for the FIA method, according to the slope values showed in Table 1. Despite of this, the LOD and LOQ values for the FIA method were smaller for phenol determination, whereas for o-cresol a smaller LOD and LOQ were observed for APHA method.
Recovery experiments
As previously discussed, the APHA and FIA methods for phenolic compound determination have been dedicated to water and soil extract analyses. Some different species may be desorbed from the soil, as colloidal minerals and humic substances.34 For this reason, a soil rich in organic
matter and clay fraction was selected for the present study. Triplicate experiments were carried out in order to evaluate the recovery of the phenolic species. The contact time of 96 h to produce the soil extract was adopted based on previous report from Dolatto et al.8 Thus, concentrations
of 1.00, 10.00 and 50.00 mg L-1 of phenol or o-cresol were
added in the soil extracts, and the accuracy and precision of both methods were compared (Figure 4).
According to Figure 4, no systematic differences between the average recovery values were verified for both methods. The largest difference observed was for phenol determination in concentration of 1.00 mg L-1, a value of
Figure 3. Absorbance transient signals for phenol determination in triplicate injections (a), values over the peaks denote the concentration (mg L-1) and analytical curve between 0.50 and 16.0 mg L-1 for the phenol
concentrations (b).
Table 1. Figures of merit for phenol and o-cresol determination
Compound Method Intercept Slope / (L mg-1) LOD / (mg L-1) LOQ / (mg L-1) r
Fenol FIA 0.009 ± 0.002 0.041 ± 0.001 0.15 0.49 0.9990
APHA 0.02 ± 0.01 0.138 ± 0.001 0.22 0.72 0.9996
o-Cresol FIA 0.045 ±0.001 0.037 ± 0.002 0.08 0.27 0.9990
APHA -0.023 ± 0.001 0.123 ± 0.001 0.02 0.08 0.9997
LOD: limit of detection; LOQ: limit of quantification; r: correlation coeffient.
Figure 4. Recovery values for conventional (APHA) and FIA methods for concentrations of 1.00, 10.00 and 50.00 mg L-1 of phenol and
106 ± 2% (APHA) against 95 ± 2% (FIA). These results indicate that there are no significant differences (95% of confidence level) between the conventional and FIA methods for phenol and o-cresol determinations in these soil extracts. Because of the same reaction was employed in the FIA and APHA methods, similar results would be expected for the same soil extracts. On the other hand, 15 min are recommended12 to determine the absorbance
signal by conventional method, which could be a drawback in the flow method by reason of kinetic aspects. Even so, according to Fiamegos et al.,35the use of ferricyanide as
oxidant agent requires only 5 min to complete the color development. This information reinforce the results from the present work since a stopped-flow experiment was carried out showing almost 5 min to reach the maximum absorbance signal. Notwithstanding this lower reaction time, the absorbance signal for APHA method (not shown) was almost three times higher in comparison with FIA (Figure 3). In spite of the ideal time to be close to 5 min, it was possible to determine the compounds without attaining the chemical equilibrium condition, which is one of the main advantages in FIA systems.
An additional set of experiments was carried using the extracts with no presence of phenol or o-cresol. A spike of 1.00 mg L-1 of phenol or o-cresol was made in the soil
extracts being this concentration employed because of the largest difference observed in the results, according to previous experiment.8 The purpose of this test was to
investigate if the organic matter influences the recovery results for the phenolic compounds since the interaction with phenol and o-cresol could produce smaller recovery results. The recovery results for phenol were 96 ± 6% (APHA) and 96 ± 4% (FIA), and for o-cresol 101 ± 2% (APHA) and 98 ± 4% (FIA). These results corroborate the statement that there is no significant difference between the methods (F-test, 95% confidence), as well as no trend of small recovery owing to the organic or colloid matter from the soil (at least for the soil sample with the same characteristics of high organic matter and clay contents). Conventional spectrophotometric determination of phenol using 4-AAP was studied for soil extract analysis in concentrations close to 5.0 to 500 mg L-1,30 but without
recovery study. Also, Dolatto et al.8 studied the interaction
of phenol and o-cresol with soil sample (using the 4-AAP method) showing recovery values near 100%. In the work from Zhi et al.,23 a study with water and soil leachates in
concentrations close to 5.0 µg L-1 (employing 4-AAP)
showed recovery values between 91.6 and 108.3%. In this study, the authors improved the sensitivity by coupling a XAD-4 column as a preconcentration step and carried out an interference study of several ions and organic species
frequently present in soils, suggesting (in accordance with the recovery results) no interferences and a good preconcentration factor.23 In the present work, the range
of phenolic concentration was relatively high. Thus, the main goal was not to reach low limit of quantification, but to verify if the organic matter could influence the recovery percent and to establish the mechanized method by FIA with a better sampling rate. According to a previous work,8
phenol or o-cresol was not detected in the supernatant phase after 96 h of contact time between these compounds and the soil sample (even at high initial concentration of 50.0 mg L-1), indicating a complete biodegradation of the
compounds. As the phenolic compounds were not detected in the supernatant solutions, a new set of experiments was performed (also in initial concentration of 1.00 mg L-1),
but a strong alkaline extractor (0.10 mol L-1 NaOH) was
employed instead of 0.01 mol L-1 CaCl
2 solution. This
solution was chosen according to literature33 since this
method is appropriate to extract organic matter from soil samples. Furthermore, according to Crespin et al.,32 the
NaOH solution may provide quantitative recovery for several phenolic compounds since the soil particles and the phenolic species are negatively charged. This characteristic hinders the sorption process, reinforcing the adequate use of this solution. After the appropriate adjustment of the pH value, the compounds were not again detected in the supernatant phases, suggesting once more a biodegradation of the compounds.8 Because of this situation, a spike of
1.00 mg L-1 of phenol or o-cresol was made in the liquid
phases to check the recovery of the methods. Under this condition, the recovery results for phenol were 93 ± 1% (APHA), 91 ± 3% (FIA) and for o-cresol 91 ± 2% (APHA), 91 ± 4% (FIA), showing again that the precision differences between both methods were not significant for 95% of confidence level. On the other hand, the recovery results were lower in comparison with the non-alkaline 0.010 mol L-1 CaCl
2 extraction. After the HCl addition, a
infer that the distillation step is not required, although no comparison using distillation was made in the present work.
Conclusions
The proposed spectrophotometric mechanized method by FIA showed to be appropriate for determining the concentration of phenol and o-cresol in soil extracts especially due to the higher sampling rate, close to 50 determinations per hour. The consumption per analysis of 4-AAP was similar between the methods, 1.0 mg for APHA and 0.95 mg for the FIA method, respectively, while 8.0 mg and 3.0 mg of ferricyanide was employed for the APHA and FIA method, respectively. Moreover, a residue volume of 100 mL was obtained for the APHA method, whereas only 5.0 mL were generated by the FIA method. The recovery results for both methods were similar, as well as the figures of merit, suggesting that the method was able to be employed for phenol and o-cresol determination in soil extracts with a minimum interference of soil sample matrix with high organic matter and clay content.
Acknowledgments
The authors are grateful to the UFPR/DQUI, FAPEG/ EMBRAPA Clima Temperado and Petrobras (Petróleo Brasileiro S.A.) for financial and logistic support.
References
1. van Schie, P. M.; Young, L. Y.; Bioremed. J.2000, 4, 1. 2. Sheikheldin, S. Y.; Cardwell, T. J.; Cattrall, R. W.; de Castro,
L. M. D.; Kolev, S. D.; Anal. Chim. Acta 2000, 419, 09. 3. Kamble, S. P.; Mangrulkar, P. A.; Bansiwal, A. K.; Rayalu, S. S.;
Chem. Eng. J. 2008, 138, 73.
4. United States Environmental Protection Agency (U. S. -EPA); http://www.epa.gov accessed in January 2007.
5. The Commission of the European Communities; Commission Regulation No. 2455/2001/EC; Official Journal of the European Union, 2011, L331/1.
6. Khan, Z.; Anjaneyulu, Y.; J. Hazard. Mater.2005, 118, 161. 7. Mor, S.; Ravindra, K.; Dahiya, R. P.; Chandra, A.; Environ.
Monit. Assess.2006, 118, 435.
8. Dolatto, R. G.; Messerschmidt, I.; Pereira, B. F.; de Oliveira, T.; Pillon, C. N.; Abate, G.; J. Agric. Food Chem. 2010, 58, 2426. 9. Rodríguez, I.; Llompart, M. P.; Cela, R.; J. Chromatogr., A
2000, 88, 291.
10. Andrade, L. S.; Laurindo, E. A.; de Oliveira, R. V.; Rocha-Filho, R. C.; Cass, Q. B.; J. Braz. Chem. Soc.2006, 17, 369. 11. Oliveira, H. M., Segundo, M. A.; Lima, J. L. F. C.; Cerdà, V.;
Talanta2009, 77, 1466.
12. American Public Health Association (APHA), American Water Works Association (AWWA), Water Environment Federation (WEF); Standard Methods for the Examination of Water and Wastewater, 19th ed.; American Public Health Association:
Washington, 1995.
13. Ródenas-Torralba, E.; Morales-Rubio, A.; de la Guardia, M.; Anal. Bioanal. Chem.2005, 383, 138.
14. Pinto, C. A. G.; Saraiva, M. L. M. F. S.; Lima, J. L. F. C.; Talanta 2008, 77, 479.
15. Rodrigues, G. D.; de Lemos, L. R.; da Silva, L. H. M.; da Silva, M. C. H.; Minim, L. A.; Talanta2010, 80, 1139.
16. dos Santos, L. B. O.; Infante, C. M. C.; Masini, J. C.; J. Braz. Chem. Soc.2010, 21, 1557.
17. Melchert, W. R.; Oliveira, D. R.; Rocha, F. R. P.; Microchem. J. 2010, 96, 77.
18. Rodrigues, G. D.; da Silva, L. H.; da Silva, M. C. H.; Quim. Nova2010, 33, 1370.
19. Haghighi, B.; Rahmati-Panah; Shleev, S.; Gorton, L.; Electroanalysis2007, 19, 907.
20. Alarcón, G.; Guix, M.; Ambrosi, A.; Silva, M. T. R.; Pardave, M. E. P.; Merkoçi, A.; Nanotechnology2010, 21, 245. 21. Frenzel, W.; Oleksy-Frenzel, J.; Möller, J.; Anal. Chim. Acta
1992, 261, 253.
22. Frenzel, W.; Krekler, S.; Anal. Chim. Acta1995,310, 437. 23. Zhi, Z.; Rios, A.; Valcarcel, M.; Analyst 1996, 121, 1. 24. Song, W.; Zhi, Z.; Wang, L.; Talanta1997, 44, 1423. 25. Fatibello-Filho, O.; Souza, M. G.; Vieira, I. C.; Eclet. Quím.
2002, 27, 51.
26. Rama, M. J. R.; Medina, A. R.; Díaz, A. M.; Microchim. Acta 2003, 141, 143.
27. Quaresma, M. C. B.; Cassella, R. J.; Carvalho, M. F. B.; Santelli, R. E.; Microchem. J.2004, 78, 35.
28. Lupetti, O. K.; Rocha, F. R. P.; Fatibello-Filho, O.; Talanta 2004, 62, 463.
29. Guilarduci, V. V. S.; de Mesquita, J. P.; Martelli, P. B.; Gorgulho, H. F.; Quim. Nova 2006, 29, 1226.
30. Meng, Z-F.; Zhang, Y-P.; Zhang, Z-Q.; J. Hazard. Mater.2008, 159, 492.
31. Krug, F. J.; Bergamin Filho, H.; Zagatto, E. A. G.; Anal. Chim. Acta1986, 179, 103.
32. Crespin, A. M.; Gallego, M.; Valcarel, M.; Anal. Chem.1999, 71, 14.
33. Neto, B. B.; Scarminio, I. S.; Bruns, R. E.; Como Fazer Experimentos, 4a. ed.; Artmed: Porto Alegre, Brasil, 2010.
34. Stevenson, F. J.; Humus Chemistry, Genesis, Composition, Reactions. John Wiley Sons, Inc.: New York, 1994.
35. Fiamegos, Y. C.; Stalikas, C. D.; Pilidis, G. A.; Karayannis, M. I.; Anal. Chim. Acta2000, 403, 315.
Submitted: November 11, 2011