*Correspondence: A. M. Rubim. Laboratório de Controle de Qualidade de Me-dicamentos, Departamento de Farmácia, Universidade Federal de Santa Maria, Caixa Postal 5083, 97105-900 - Santa Maria-RS. E-mail: [email protected]
A
vol. 49, n. 3, jul./sep., 2013
A simple method for the quantification of diclofenac potassium in
oral suspension by high-performance liquid chromatography with
UV-detection
Alexandre Machado Rubim
1,*, Jaqueline Bandeira Rubenick
2, Luciane Varine Laporta
2,
Clarice Madalena Bueno Rolim
11Department of Pharmacy, Federal University of Santa Maria, 2Laboratory of Control of Drug Quality,
Franciscan University Center
A rapid, simple and low cost method was developed to determine diclofenac potassium (DP) in oral suspension, using a reverse-phase column (C8, 150 mm x 4.6 mm, 5 µm), mobile phase containing
methanol/buffer phosphate (70:30 v/v, pH 2.5), at a low rate of 1.0 mL/min, isocratic method, and ultraviolet detection at 275 nm. A linear response (r = 1.0000) was observed in the range of 10.0-50.0 µg/ mL. Validation parameters such as linearity, speciicity, precision, accuracy and robustness were evaluated. The method presented precision (repeatability: relative standard deviation = 1.21% and intermediate precision: between-analyst = 0.85%). The speciicity of the assay was evaluated by exposure of diclofenac potassium under conditions of stress such as hydrolysis, photolysis, oxidation and high temperature. The method presented accuracy values between 98.28% and 101.95%. The results demonstrate the validity of the proposed method that allows determination of diclofenac potassium in oral suspension and may be used as an alternative method for routine analysis of this product in quality control.
Uniterms: High performance liquid chromatography. Diclofenac potassium. Oral suspension.
Desenvolveu-se método simples, de baixo custo para determinar o diclofenaco potássico (DP) em suspensão oral, usando coluna de fase reversa (C8, 150 mm x 4,6 mm, 5 µm), fase móvel contendo
metanol/tampão fosfato (70:30 v/v, pH 2,5), com luxo de 1,0 mL/min, método isocrático e detecção no ultravioleta a 275 nm. Observou-se resposta linear (r = 1,0000) na faixa de 10,0-50,0 µg/mL. Avaliaram-se parâmetros de validação, como linearidade, especiicidade, precisão, exatidão e robustez. O método apresentou precisão (repetibilidade: desvio padrão relativo = 1,21% e precisão intermediária: entre analista = 0,85%). A especiicidade do ensaio foi avaliada pela exposição do diclofenaco potássico a condições de estresse, tais como hidrólise, fotólise, oxidação e alta temperatura. O método apresentou valores de exatidão entre 98,28% e 101,95%. Os resultados mostram a validade do método proposto, que permite a determinação de diclofenaco potássico em suspensão oral e pode ser utilizado como alternativa para análise de rotina desse produto no controle de qualidade.
Unitermos: Cromatograia de alta eiciência. Diclofenaco potássico. Suspensão oral.
INTRODUCTION
Diclofenac potassium (DP), 2-[(2,6-dichlorophenyl)-amino]-benzeneacetic acid, is an acid phenyl acetic derivative with inflammatory, analgesic and anti-thermal properties. It is usually found as potassium and
described in British Pharmacopeia (BP, 2012). The United States Pharmacopeia and Brazilian Pharmacopeia employ techniques such as titration in non-aqueous medium, spectrophotometry and LC (Farmacopéia Brasileira, 2010; USP, 2012).
The development of analytical, safe and reliable methods is a very important tool for the quality control of pharmaceutical products and raw material. For this reason many authors have published articles on the subject (Arend et al., 2009; Nogueira et al., 2007; Rosa et al., 2008).
D u e t o t h e l a c k o f a m e t h o d o l o g y f o r t h e determination of DP in oral suspension this study aimed to develop and validate a methodology for the determination of diclofenac potassium in oral suspension for routine analysis in laboratories. This method was validated according to the oficial guidelines (Brasil, 2003; ICH, 2005; Inmetro, 2007).
MATERIAL AND METHODS
Chemical and Reagents
DP reference substance was obtained from Farmacopeia Brasileira, batch 1053. DP oral suspension (Catalam®) was purchased from the Brazilian market. All chemicals used were of analytical grade and all solvents were LC grade. Methanol and phosphate sodium were purchased from Sigma Aldrich. The puriied water used was obtained utilizing the reverse osmosis system (Milli-Q Millipore Corporation®).
Equipment and Chromatographic conditions
The development and validation of the assay was performed on a Shimadzu LC system (Kyoto Japan), with an LC-20AT pump, SIL-20A ht automatic injector, CTO-20AC column oven, SPD-M20A photodiode array detector (PDA) and CBM-20A controller with LC solution software. Chromatographic separations were achieved using a Phenomenex® Luna C8 (150 x 4.6 mm, 5 µm) column. The mobile phase and diluent contained a mixture of methanol: buffer phosphate pH 2.5 (70:30 v/v) and methanol: water (70:30 v/v) respectively, low of 1.0 mL/ min, PDA detection at 275 nm. The injection volume was 20 µL.
Preparation of Standard Solution
10.0 mg of diclofenac potassium reference substance was accurately weighed and dissolved in a 10 mL volumetric lask with diluents. This solution was diluted
appropriately in the range from 10.0 to 50.0 µg/mL, with an average concentration of 30.0 µg/mL.
Preparation of Sample Solution
An aliquot equivalent of 2.0 mg of DP, about 1.0 mL of oral suspension was transferred to a 10.0 mL volumetric lask and dissolved with diluents. Then a 1.5 mL aliquot was pipetted into a 10 mL volumetric lask and diluted with the same solvent.
Validation Study
Specificity
Placebo, sample oral suspension and DP reference substance solution were analyzed for the determination of method speciicity. The placebo formulation contains: citric acid, sorbic acid, deionized water, strawberry flavor, cellulose microcrystalline, sodium cyclamate, hydroxyethylcellulose, propylparaben, methylparaben, propylene glycol, glyceryl polyoxyethyleno glycol stearate, saccharin sodium.
Moreover, the speciicity was evaluated for stress testing (ICH, 2005). The stress conditions follow:
Hydrolytic Conditions
Individually, 25.0 mg of DP reference substance were dissolved in a 25 mL volumetric lask with diluent to generate a concentration of 1 mg/mL. Then 5 mL aliquots were transferred to a 25 mL volumetric lask and dissolved in HCl 0.1 M and NaOH 0.1 M. After 5 and 24 hours, aliquots of 1.5 mL were transferred to a 10 mL volumetric lask and neutralized with NaOH 0.1 M and HCl 0.1 M, respectively.
Oxidative Condition
The equivalent of 25.0 mg of DP reference substance was dissolved in a 25 mL volumetric lask with diluent to generate a concentration of 1 mg/mL. After that, 5 mL aliquots were transferred to a 25 mL volumetric lask and dissolved in hydrogen peroxide 3%. After, 5 and 24 hours, 1.5 mL aliquots were transferred to a 10 mL volumetric lask dissolved in diluents.
Photolytic degradation
aliquot was transferred to a 10 mL volumetric lask and dissolved in diluents. All the solutions were analyzed in triplicate.
Linearity and range
The linearity was determined by constructing three independent analytical curves, with ive concentrations of DP (10.0; 20.0; 30.0; 40.0 and 50.0 µg/mL), which were analyzed in triplicate on three consecutive days. The results were subjected to regression analysis by the least squares method to calculate the calibration curves.
Detection Limit and Quantification Limit
The detection limit (DL) and quantiication limit (QL) were based on the standard deviation of the response and the slope of the mean of three calibration curves.
Precision and Accuracy
The precision assay was investigated with respect to repeatability (intra-day) and intermediate precision (inter-day). The repeatability was evaluated by assaying three determinations at concentrations of 10.0; 30.0 and 50.0 µg/mL, during same day and under the same experimental conditions. The intermediate precision was assessed by carrying out the same analysis on 3 different days. The precision was expressed as % of relative standard deviation (RSD).
Accuracy was evaluated from the amount of DP reference substance recovered. The study was performed by adding a known amount of DP standard solution (10.0; 20.0; 30.0 and 40.0 µg/mL) to sample solution. The actual and the measured concentration were then compared. The experiments were repeated three times.
Robustness
The robustness evaluation of the chromatographic method for DP was performed using the method proposed by Youden and Steiner (1975).Five analytical parameters were selected and small variations were induced in the nominal values of the method. The five analytical parameters employed, as well as the variations introduced are shown in Table I. Then, eight runs were performed aiming to determine the inluence of each parameter in the inal results, according to a matrix of factors in Table II.
The parameters A, a, B, b, C, c, D, d, E, e, were calculated according to equations(equations 1-10) as follows:
According to Nogueira et al. (2011), this method will be robust if conditions 1 and 2 are met:
Condition 1: (for factor A and other factors) content of DP – 5% ≤ A ≤ content of DP + 5%.
Condition 2: (for factor A and other factors) A – a ≤ 3% involving the DP content.
An appropriate amount was transferred into an individual 10 mL volumetric flask, diluted to volume with diluents, and iltered through a 0.45 μm membrane filter (Millipore, Bedford, USA), obtaining the final concentration of 30.0 µg/mL of the active pharmaceutical ingredient. The concentrations of DP presented in samples were determined from the standard curve.
System Suitability
System suitability was evaluated by ive replicate analyses of a DP reference substance and sample at a concentration of 30.0 µg/mL. The calculated parameters were: number of theoretical plates, tailing factor and asymmetry (FDA, 1994).
RESULTS AND DISCUSSION
System Suitability
To obtain the best chromatographic method, the mobile phase of methanol and buffer phosphate (70:30 v/v, pH 2.5) was utilized to provide adequate peak and satisfactory results according to criteria evaluated. A
TABLE I - Analytical parameters and variations to evaluate the
robustness of the chromatographic method for DP quantiication
Parameter Variation
Mobile phase low rate
(mL min-1)
A - 1.2 a - 0.8
Column supplier B - Gemini b - Sunire
Column temperature (ºC) C - 30 c - 20
Methanol concentration in mobile phase (%)
D - 73 d - 67
Time of ultrasonic bath for preparation sample (min)
E - 25 e - 15
TABLE II - Matrix of factors for the determination of method
robustness
Value of factor
Combination assayed
1 2 3 4 5 6 7 8
A or a A A A A a a a a
B or b B B b b B B b B
C or c C c C c C c C c
D or d D D d d d d D D
E or e E e E e e E e E
150 mm length octylsilane column was able to obtain a resolution and peak asymmetry and a time analytical short when compared, for example to the method used for the determination of diclofenac in the raw material and tablets.
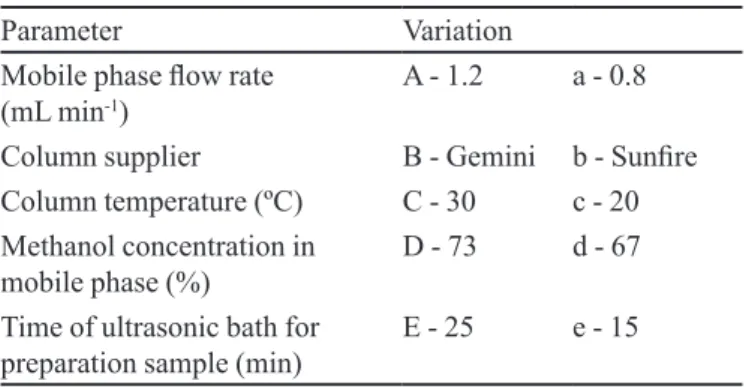
Specificity
The chromatograms obtained with the speciicity test (Figure 1), showed that none of the excipients of the formulation eluted in the same retention time were related to the DP peak. Therefore none of them interfered in its determination.
Furthermore, the interference of potential degradation products was investigated through a forced degradation test. These studies were performed to identify the key factors which will impact the drug stability, as well
as verify that the method is useful for stability studies. Usually the range of degradation is 10% to 30% (Chan et al., 2004).
Basic Conditions
After alkali hydrolysis, the concentration remained constant and no degradation of the DP reference substance was found. The stress test did not show the formation of secondary peaks in the chromatogram.
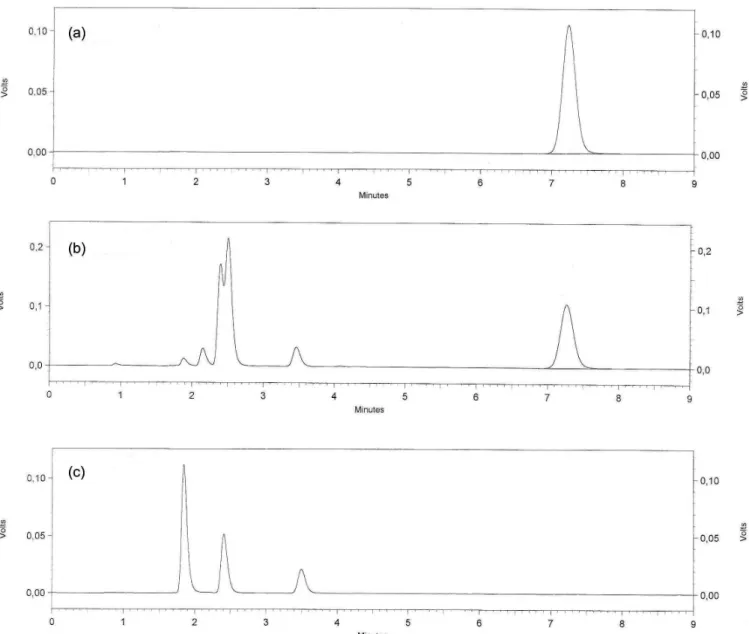
Acidic Conditions
After zero, 5 and 24- hour hydrolysis times, a reduction in area of around 8.3%, 39.0% and 45.6% occurred respectively, according to Figure 2.
FIGURE 1 - Chromatograms corresponding to: (a) solution of DP reference substance, (b) oral suspension sample and (c) sample
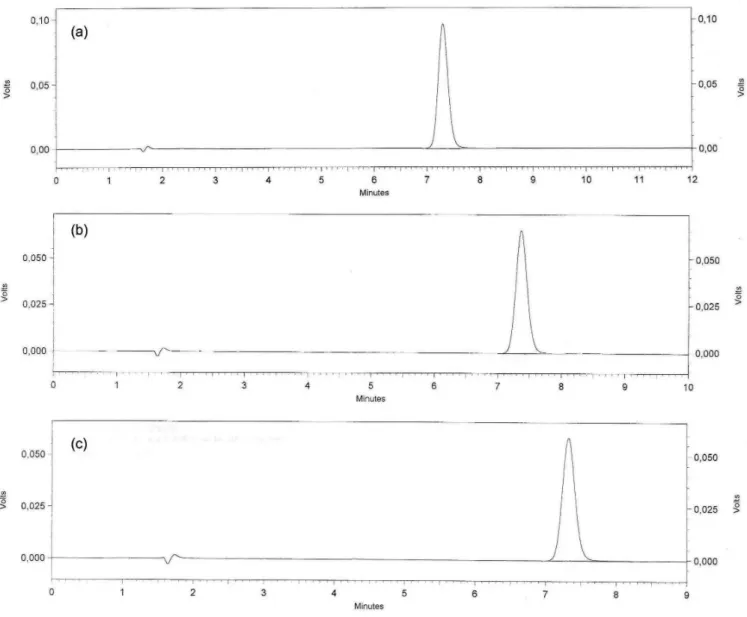
Oxidative Conditions
After chemical oxidation with H2O2 3%, during a 24-hour period, a reduction of area around 14.6% and 43.0% occurred at 5 and 24 hours respectively, according to Figure 3.
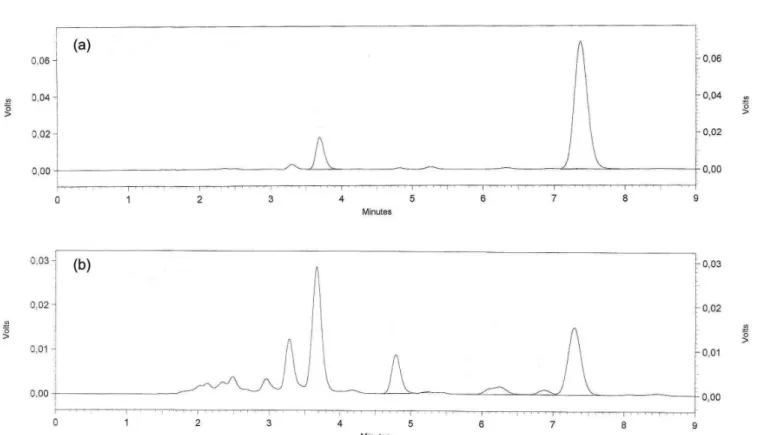
Photolytic degradation
Under photolytic condition the average area for DP showed a reduction of about 86.5% at the end of 24 hours, according to Figure 4.
In conclusion, stress degradation tests under the conditions described showed that DP degraded partially under acidic, oxidative and photolytic conditions. Although degradation of the drug occurs under acid and oxidative conditions, there was no appearance
of secondary peaks related to degradation products. Under acidic and oxidative conditions there was no appearance of secondary peaks related to degradation products, which may be explained by the fact that they do not have chromophoric groups in their molecule, present low concentrations or are detected after the end of the run. After 24 hours under photolytic conditions, the drug degraded, as did the appearance of new peaks in the chromatogram related to potential degradation products.
The method proposed can be used to indicate stability because the peak of the parent drug does not suffer interference from other signals in the chromatograms. The purity of peaks was attested with photodiode detector support.
FIGURE 2 - Chromatograms corresponding to: (a) solution of DP reference substance time zero, (b) solution of DP reference
Linearity and range
Linearity was observed over the concentration range of 10.0-50.0 µg/mL, according to Figure 5, with a correlation coefficient of (r = 1.0000) according to the criteria established for (r = 0,9999) and the linear regression equation y = 44934x + 36300 (where, x is concentration and y is the peak absolute area). Assay validity was veriied by means of the ANOVA. According to the statistical data, there is a linear relationship between the variables and there is no deviation from linearity (p < 0.05). The quantiication and detection limits were 0.05 µg/mL and 0.02 µg/mL respectively showing method sensibility.
Precision
The precision of the method was evaluated as
repeatability and intermediate precision and was expressed as RSD%. The mean results were 1.21% and 0.85% of RSD respectively. The limit for this assay is an RSD maximum of 2.0% (USP, 2012).
Accuracy
Accuracy was calculated as the percentage of recovery by the assay of the known added amount DP reference substance in solutions, using three concentration levels and three replicates of each concentration. The average percentage obtained was 98.28%–101.95% satisfying the acceptance criteria for the study.
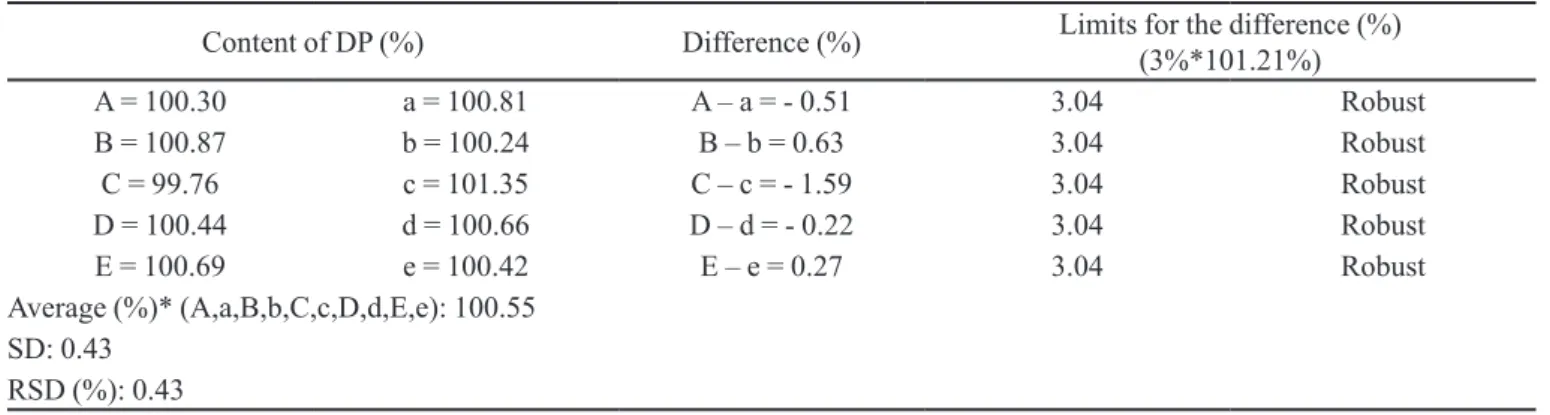
Robustness
The method described by Youden and Steiner (1975), makes it possible not only to evaluate method
FIGURE 3 - Chromatograms corresponding to: (a) solution of DP reference substance time zero, (b) solution of DP reference
FIGURE 4 - Chromatograms corresponding to: (a) solution of DP reference substance time 5 hours and (b) solution of DP reference substance time 24 hours after photolytic conditions.
FIGURE 5 - Calibration curve of Diclofenac potassium.
robustness, but also to sort the variation of each parameter in the inal results (INMETRO, 2007). Results presented in Tables III and IV, indicate satisfactory robustness of the method.
After variation of some parameters of the method proposed, these variations were not able to signiicantly change the DP content in the sample, average levels of DP ranging from 98.43% to 102.34%. The results satisfy conditions 1 and 2, and were therefore considered a robust method for the determination of DP in oral suspension.
CONCLUSION
The proposed liquid chromatography method provides speciic, accurate, precise and robust results for
TABLE III - Combinations tested to evaluate the robustness of the analytical method, evaluating the conditions 1
Combination assay
Results s t u v w x y z
Content (%): 99.52 101.50 99.76 100.43 101.34 101.14 98.43 102.34
Average content (%): 100.56
RSD (%): 1.26
TABLE IV - Combinations tested to evaluate the robustness
Content of DP (%) Difference (%) Limits for the difference (%)
(3%*101.21%)
A = 100.30 a = 100.81 A – a = - 0.51 3.04 Robust
B = 100.87 b = 100.24 B – b = 0.63 3.04 Robust
C = 99.76 c = 101.35 C – c = - 1.59 3.04 Robust
D = 100.44 d = 100.66 D – d = - 0.22 3.04 Robust
E = 100.69 e = 100.42 E – e = 0.27 3.04 Robust
Average (%)* (A,a,B,b,C,c,D,d,E,e): 100.55 SD: 0.43
RSD (%): 0.43
*average for three determinations; SD: standard deviation; RSD: relative standard deviation
the quantitative determination of DP in oral suspension. Hence, the method developed represents an alternative in the routine of pharmaceuticals laboratories, and is suitable to determine DP in the quality control routine for the pharmaceutical form.
ACKNOWLEDGMENTS
This study was supported by a grant from the Department of Pharmacy, Federal University of Santa Maria and Laboratory of Drug Quality Control, Franciscan University Center.
REFERENCES
AREND, M.; CARDOSO, S.; HURTADO, F.; RAVANNELO, A.; LANZANOVA, F.; ROLIM, C. Development and validation of a stability-indicating LC method for determination of ebastine in tablet and syrup. Chromatographia, v.69, n.2, p.195-199, 2009.
BRASIL. Resolução RE 899, de 29 de maio de 2003. Guia para validação de métodos analíticos. p.15.
BRITISH Pharmacopoeia Commission. London: The Stationery
Ofice, 2012. p.687
CHAN, C.C.; LEE, Y.C.; LAM, H.; ZHANG, X-M. (Eds.). Analytical methodvalidation and instrument performance
veriication. New Jersey: John Wiley & Sons, 2004. 316 p.
ELKADY, E. Simultaneous determination of diclofenac
potassium and methocarbamabol in ternary mixture with guaifenesin by reverse phase liquid chromatography. Talanta, v.82, n.4, p.1604-1607, 2010.
FARMACOPEIA Brasileira. 5.ed. Brasília: Agencia Nacional
de Vigilância Sanitária, 2010. v.2, 902 p.
FDA. Reviewer guidance: validation of chromatographic methods. Rockville: Center for Drug Evaluation and Research, 1994. 33 p.
INMETRO (Brasil). Normalização e qualidade industrial. DOQ-CGCRE-008, 2007. Available at: http://www. inmetro.gov.br/Sidoq/Arquivos/CGCRE/DOQ/DOQ-CGCRE-8_02.pdf. Accessed on: 26th October 2012.
INTERNATIONAL CONFERENCE HARMONIZATION. Validation of analytical procedures: text and methodology Q2 (R1). ICH, 2005. Available at: <http://www.ich.org/
fileadmin/Public_Web_Site/ICH_Products/Guidelines/
Quality/Q2_R1/Step4/Q2_R1_Guideline.pdf>. Accessed on: 17Apr. 2010.
NAIDOO, V.; WOLTER, K.; CUTHBERT, R.; DUNCAN, N.
Veterinary diclofenac threatens Africa’s endangered vulture species. Regul. Toxicol. Pharmacol., v.53, n.3, p.205-208, 2009.
NOGUEIRA, D.; D`AVILA, F.; ROLIM, C.; DALMORA, S. Development and validation of a stability-indicating LC method for the determination of rupatadine in pharmaceutical formulation. Chromatographia, v.66, n.11, p.915-919, 2007.
NOGUEIRA, R.; WOLLINGER, W.; SILVA, T.; OLIVEIRA, L.; MOREIRA, G.; BARIN, J.; LAPORTA, L.; MESKO, M.; BITTENCOURT, C.; RODRIGUES, J.; CUNHA,
V. Validation of a Liquid chromatographic method for
determination of related substances in a candidate certiied
ROSA, S.; BARATA, P.; MARTINS, J.; MENEZES, J.
Development and validation of a method for active drug
identiication and content determination of ranitidine in pharmaceutical products using near-infrared relectance
spectroscopy: a parametric release approach. Talanta, v.75, n.3, p.725-733, 2008.
SANCHES, A.; VILETTI, F. Uso indiscriminado e/ou irracional
de anti-inlamatórios não esteroidais (AINES) observados em uma farmácia de dispensação. Visão Acadêmica, v.10, n.1, p.69-76, 2009.
SILVA, P. Farmacologia. Rio de Janeiro: Guanabara Koogan, 2010. 711 p.
SOUZA, R.; TUBINO, M. Spectrophotometric determination of diclofenac on pharmaceutical preparation. J. Braz. Chem. Soc., v.16, n.5, p.1068-1073, 2005.
SPARIDANS, R.; LAGAS, J.; SCHINKEL, A.; SCHELLENS, J.; BEIJNEN, J. Liquid chromatography-tandem mass
spectrometric assay for diclofenac and three primary metabolites in mouse plasma. J. Chromatogr. B, v.872, n.1, p.77-82, 2008.
UNITED States Pharmacopoeia. 35.ed. Rockville: United States Pharmacopoeia Convention, 2012. 2879 p.
YOUDEN, W.; STAINER, E. Statistical manual of AOAC.
Washington: AOAC, 1975. 88 p.
Received for publication on 13th November 2012