Article
Printed in Brazil - ©2014 Sociedade Brasileira de Química0103 - 5053 $6.00+0.00A
*e-mail: [email protected]
Cobalt Catalyst Characterization for Methane Decomposition and Carbon
Nanotube Growth
Hugo A. Oliveira,a Dante F. Franceschinib and Fabio B. Passos*,a
aDepartamento de Engenharia Química e Petróleo, Universidade Federal Fluminense,
Rua Passos da Pátria, 156, 24210-240 Niterói-RJ, Brazil
bInstituto de Física, Universidade Federal Fluminense, Av. Milton Tavares de Souza, s/n,
24210-341 Niterói-RJ, Brazil
Varias técnicas, como fisissorção, espectroscopia de fotoelétrons excitados por raios X (XPS), difração de raios X (XRD), redução à temperatura programada (TPR) e quimissorção foram usadas para a caracterização de catalisadores de Co/γAl2O3 para a produção de nanotubos de carbono por
deposição de metano. Os catalisadores apresentaram três principais espécies de cobalto: CoAl2O4, CoO e Co3O4. As espécies de CoAl2O4 estavam bem dispersas nos catalisadores e apresentaram elevada temperatura de redução, fazendo com que estas espécies sejam inativas para a produção de nanotubos. Para o catalisador 1%Co/Al2O3, a principal espécie encontrada foi o CoAl2O4.
Contudo, com o aumento do teor de cobalto nos catalisadores, ocorreu um aumento na formação das espécies Co3O4 em relação às espécies CoO e CoAl2O4. Os catalisadores 2 e 3%Co/Al2O3 apresentaram aglomeração das partículas de cobalto após a etapa de redução e baixa seletividade para produção de nanotubos. Entretanto, o catalisador 4%Co/Al2O3 não apresentou aglomeração, resultando em uma melhor seletividade para formação de nanotubos, 71%, principalmente do tipo nanotubos de carbono de paredes múltiplas (MWNT).
Several analytical techniques, such as N2 physisorption, X-ray photoelectron spectroscopy (XPS), X-ray diffraction (XRD), temperature programmed reduction (TPR) and chemisorption were employed to characterize the structure of Co/γAl2O3 catalysts used for the production of
carbon nanotubes by methane vapor deposition. The catalysts were studied after the calcination step and presented three main cobalt species, CoAl2O4, CoO and Co3O4. The CoAl2O4 species were well dispersed and were reduced only at high temperatures, rendering them inactive for the carbon nanotube production. In the case of the 1%Co/Al2O3 catalyst, the main cobalt species found
was CoAl2O4. However, increasing the cobalt content in the catalysts led to a higher formation
of Co3O4 as compared to CoO and CoAl2O4 species. The 2 and 3%Co/Al2O3 catalysts showed
particle agglomeration during the pretreatment step that decreased selectivity towards nanotube production. The 4%Co/Al2O3 catalyst did not show particle agglomeration and presented a higher selectivity to carbon nanotube production, 71%, mainly multi-walled carbon nanotubes (MWNT).
Keywords: carbon nanotubes, cobalt, catalyst support, chemical vapor deposition, methane
Introduction
Carbon nanotubes (CNT) exhibit unique physical and chemical properties that have opened a vast number of applications and new ones are still under development. However, for the incorporation of CNT into everyday materials, it is important to control their growth. The production of CNT with pre-determined specifications is an essential requirement for their industrial use. The
investigation into CNT production by catalytic chemical vapor deposition (CVD) has attracted great attention and has become the most popular synthesis method due to its easy setup and scale-up for mass production.1,2
Many researchers3-5 have studied different catalyst
nanotube production in order to develop a strategy to maximize the catalyst selectivity and activity. In our previews work,6 among various catalyst formulations investigated,
cobalt catalysts supported on alumina exhibited the highest carbon nanotube yield. Therefore, this contribution has focused on the characterization of the cobalt species present in a cobalt/alumina system for each step of CNT growth and explored their influence in CNT synthesis.
In our CNT production method, there are two main steps: reduction of the oxide catalyst followed by methane decomposition on the reduced catalyst for carbon nanotube growth. Therefore, 1, 2, 3 and 4 wt.% Co/Al2O3 catalysts
were studied in three different states, as an oxide, reduced and passivated.
The catalysts were investigated using energy-dispersive X-ray spectroscopy (EDX), X-ray diffraction (XRD), N2 physisorption, temperature programmed reduction
(TPR), CO and H2 chemisorption and X-ray photoelectron
spectroscopy (XPS). The combination of these techniques can detail the structure of the catalysts, which can be used to clarify the activity and selectivity toward carbon nanotube formation.
CNT characterization was performed by Raman spectroscopy, temperature programmed oxidation (TPO), scanning electron microscopy (SEM) and transmission electron microscopy (TEM).
Experimental
Catalyst preparation
The Al2O3 support was obtained by drying bohemite
(Catapal-A, Sasol, degree of purity: 99.9%) in air at 120 oC for 16 h and then calcining in air at a heating rate
of 10 oC min-1 up to 550 oC for 2 h. A series of 1, 2, 3
and 4 wt.% Co/Al2O3 catalysts was prepared by incipient
wetness impregnation using a solution of Co(NO3)2.6H2O
(Merck, degree of purity: 99.8%). After impregnation, the catalysts were dried in air at 120 oC for 16 h and then
calcined in air for 2 h at 550 oC.
Catalyst characterization
The oxide catalysts were studied after the calcination step. For the reduced state, the oxide catalysts were reduced under H2 flow from room temperature to 700 oC
at a heating rate of 10 oC min-1 and were then analyzed.
For the passivated state, the samples were reduced as described above and then the catalysts were cooled to room temperature in He flow. Finally, they were passivated with 1.0% O2/He (30 mL min-1) during 2 h at room temperature.
Measurements of surface area, pore volume and pore diameter distribution were performed in a Micromeritics ASAP 2010 apparatus by N2 adsorption. The oxide catalysts
were evacuated at 220 oC during 4 h before analysis. Pore
volume and pore diameter distribution were calculated from the N2 desorption curve using the Barrett-Joyner-Halenda
(BJH) method.
The chemical compositions of the oxide catalysts were determined by EDX in vacuum using an EDX-720 Shimadzu apparatus.
XPS experiments of the oxide and passivated catalysts were performed with a Thermo Scientific ESCALAB 250Xi with monochromatic Al Kα X-rays with a spot size of 650 µm. The base pressure inside the analysis chamber was 1 × 10⁻⁹ mbar or lower. The samples were mounted on a
sample holder by means of a double-sided adhesive carbon tape. For the survey spectra an energy step size of 1.0 eV and a pass energy of 100 eV were used. For the individual element spectra, Co2p, O1s and Al2p, an energy step size of 0.05 eV and a pass energy of 25.0 eV were used. The flood gun was used to neutralize charge buildup on the surface of the samples. The spectra were analyzed and peak fitted with a linear type background and a Gaussian product function. XRD experiments of the oxide and passivated catalysts were performed in a Rigaku Miniflex diffractrometer with monochromatic Cu Kα (1.540 Å) radiation with a scan rate of 0.05o min-1 in the range of 2θ = 2.00 to 80.00o. The
average cobalt particle sizes were calculated from the most intense Co3O4 line, 2θ = 36.9o, using the Scherrer formula.
Raman spectroscopy was used for the characterization of the oxide catalysts and carbon deposits on the catalysts after the reaction step. Raman spectra were taken in a Confocal Raman Microscope alpha 300, Witec, using a 50× objective lens and green laser with 532 nm wavelength. The integration time was 1.0 s and the number of scans was 500. TPR experiments were performed in a U-shaped tubular quartz reactor coupled to a quadrupole mass spectrometer (Omnistar, Balzers). The oxide catalysts, approximately 0.5 g, were dried in He for 30 min at 150 oC before TPR.
After cooling to room temperature, a mixture of 5% H2/Ar
flowed (30 mL min-1) through the catalyst and the
temperature was raised at a heating rate of 10 oC min-1 up
to 1000 oC.
H2 and CO chemisorptions were performed using a
volumetric method in a Micromeritcs ASAP 2010 device. The pretreatment of the oxide catalysts consisted of drying at 220 oC for 30 min under a 30 mL min-1 He flow before the
reduction. After cooling to room temperature, the reduction step was performed. The temperature was raised at a heating rate of 10 oC min-1 up to 700 oC under 30 mL min-1
vacuum at 700 oC before cooling to 150 oC, where the H 2
chemisorption measurements were performed. Then, the catalysts were evacuated at 500 oC, and finally the CO
chemisorption measurements were done at 35 oC. H 2 and
CO chemisorption on cobalt are performed at temperatures higher than room temperature as they are activated.7 Total and
reversible isotherms were measured at the pressure range of 10-300 mmHg. The amount of H2 and CO adsorbed in each
measurement was determined by extrapolating the linear part of the isotherm to zero pressure. It is assumed that the adsorption stoichiometries for H2 and CO are H/Co = 1 and
CO/Co = 1, respectively. The Co particle size was calculated supposing spherical Co particles. For H2 chemisorption, these
calculations were performed assuming total chemisorption as recommended by Reuel and Bartholomew.8
CNT production
For the CNT production by methane CVD, 1.0 g of catalyst was inserted into a quartz boat and then placed in a horizontal tubular quartz reactor. The catalyst was heated under 200 mL min-1 H
2 flow from room temperature to
700 oC at a heating rate of 10 oC min-1. Then, the H 2 flow
was switched to 200 mL min-1 methane for 30 min. Finally,
the sample was cooled to room temperature under Ar flow.
CNT characterization
TPO experiments were performed in the same apparatus described for the TPR experiments. The samples (0.2 g) were dried in He for 30 min at 200 oC before TPO.
Afterwards, the sample was cooled to room temperature, a 5% O2/He mixture flowed through the sample at
30 mL min-1 as the temperature was raised at a heating
rate of 10 oC min-1 up to 1000 oC. There was always O 2 in
excess to avoid the formation of carbon monoxide. The mass of carbon present in each sample was determined by the evolution of CO2.
CNT morphology was analyzed by SEM images. SEM images were performed in a Zeiss EVO MA and a Jeol
JSM-5800 LV scanning electron microscopes with electron beam energy in the 10-30 kV range.
The TEM images were obtained in a FEI Tecnai F30 transmission electron microscope. For this experiment, the samples were dispersed in isopropanol and ultrasonicated for 15 min. Then, a few drops of the resulting suspension were deposited on a grid and subsequently evaporated.
Results and Discussion
N2 physisorption
N2 physisorption measurements were performed to
determine the changes in surface area and pore diameter distribution between the support and catalyst after the calcination step. Table 1 shows the textural properties of the support and cobalt catalysts. The surface area and the average pore diameter of the alumina are typical of γ-phase, as found by Rane et al..9
Higher cobalt loading catalyst showed lower surface area and pore volume. This may be attributed to the blocking of narrow pores by the cobalt oxide particles. Since the narrow pores are blocked, there is an increase in average pore diameter as shown in Figure 1 and Table 1.
Table 1. Textural properties and chemical composition of the catalysts
Sample Surface area /
(m2 g-1)
Pore volume / (cm3 g-1)
Average pore diameter / nm
Bulk Coa /
wt.%
Surface Cob /
wt.%
Fraction of Co as CoAl2O4b
Al2O3 282 0.64 7.1 – – –
1Co/Al2O3 266 0.63 7.4 0.92 1.10 0.93
2Co/Al2O3 257 0.61 7.5 2.02 0.54 0.82
3Co/Al2O3 256 0.61 7.5 2.99 0.56 0.69
4Co/Al2O3 248 0.59 7.8 3.96 0.74 0.52
aMeasured by EDX; bmeasured by XPS.
Energy-dispersive X-ray spectroscopy
The catalyst chemical composition was analyzed by EDX. The cobalt fraction is consistent with the nominal value used in the catalyst preparation. Table 1 shows the cobalt composition of the catalysts.
X-ray photoelectron spectroscopy
XPS can be used to determine the surface chemical composition of the catalyst. Two survey spectra were obtained at different points for each catalyst and they showed the same profile. This indicates a uniform cobalt distribution on the support. The survey spectrum detected four elements: cobalt, aluminum, oxygen and carbon. The carbon comes from adventitious hydrocarbons nearly always present on samples, introduced from the laboratory environment or from adhesive carbon tape.
The cobalt composition found by XPS is a function of its depth and surface distribution. So, when cobalt particles are concentrated in the top layers of the catalyst or they are highly dispersed on the support, the intensity of the cobalt X-ray photoelectron is increased. 1Co/Al2O3 showed approximately the same surface
cobalt concentration as its bulk value, Table 1. This is an indicative that the cobalt particles are uniformly distributed within the catalyst pellet.
Usually, three different cobalt species are present in a Co/Al2O3 catalyst: Co3O4, CoO and CoAl2O4. Each of these
cobalt species shows a different color; cobalt aluminate is light blue, CoO is olive greenish-brown and Co3O4 is
black.10,11 1Co/Al
2O3 catalysts presented a light blue color,
indicating that most of the cobalt is in the form of cobalt aluminate. Increasing the cobalt loading of the catalysts, they became darker until turning black for 4%Co/Al2O3. So,
the amount of Co3O4 species increased with cobalt loading
and XPS helped in identifying these species.
The identification of cobalt chemical states depends on the accurate determination of the binding energy lines. The flood gun technique was used to neutralize charge build-up on the sample surface. However, the flood gun may provide more electrons to the catalyst than those leaving it. As a result, the whole catalyst surface may charge up due to the energy of the flood gun beam. For this reason, the peak energies were corrected by reference to the C1s line at 284.8 eV. In our experiments, there was an excessive charge compensation making the peaks shift to lower binding energy at values of 0.5, 0.4, 0.3 and 0.2 eV for the catalysts with cobalt loadings of 1, 2, 3 and 4 wt.%, respectively. Other authors, such as Hilmen et al.,12 have
corrected the peak energy by reference to Al2p. In our
results, there was no significant difference between the correction by reference to the C1s line or to the Al2p line.
The binding energy of the cobalt species present on the catalysts can be compared to the binding energy of reference compounds, such as Co3O4, CoO and CoAl2O4.3,12,13
According to Hilmen et al.,12 the binding energy of the
Co2p3/2 peak is found at 780.2 eV for a Co3O4 bulk sample
and its asymmetric shape can be explained due the slightly higher binding energy of Co2+ in relation to Co3+ (780.3
and 779.5 eV, respectively). For a bulk CoO sample, Herrera et al.3 found a binding energy of 780.5 eV for the
Co2p3/2 peak. As these cobalt species show approximately
the same binding energy, it is hard to distinguish these peaks precisely. However, the Co2p3/2 peak of CoAl2O4 is found at
higher binding energy, 782.0 eV, than the binding energy of the 2p3/2 peak of Co3O4 and CoO. In this way, it is possible
to distinguish the cobalt aluminate Co2p3/2 peak from the
other cobalt species. Therefore, the amount of CoAl2O4
could be estimated by deconvolution of the Co2p3/2 peak into
two mixed Gaussian-Lorentzian curves centered at a fixed binding energy peak, 780 eV for CoO and Co3O4 species
and 782.0 eV for CoAl2O4. Figure 2 shows the XPS spectra
of the oxide catalyst for the Co2p region and Table 1 shows the fraction of cobalt aluminate present on the catalysts.
The Co2p3/2 peak of the 1Co/Al2O3 catalyst has the same
binding energy of the CoAl2O4 bulk sample, as found by
Hilmen et al..12 It shows that most of the cobalt species on
the 1Co/Al2O3 catalyst is CoAl2O4. Increasing the cobalt
content on the catalysts, the binding energy of the Co2p3/2
peak shifted to lower energy and the satellite peak intensity decreased. The first effect shows an increase of the CoO
Figure 2. XPS spectra of the oxide catalyst in the Co2p region. (a) 1Co/Al2O3; (b) 2Co/Al2O3; (c) 3Co/Al2O3; (d) 4Co/Al2O3. The vertical dot lines are binding energy reference compounds: Co3O4 (780.2 eV) and
and Co3O4 fraction in relation to CoAl2O4 and the second
effect points to an increase of Co3O4 species in relation to
CoO. The satellite peak intensity is weaker for Co3O4 than
for CoO and centered about 10 eV from the main peaks.13
In our results, the satellite peak could only be observed in the case of the 1Co/Al2O3 catalyst, Figure 2.
The Co3O4 and CoAl2O4 species represent the two limit
cases of cobalt/alumina interaction in a catalyst. The Co3O4
species has no any interaction with alumina while CoAl2O4
shows complete spinel formation.12
Kerkhof and Moulijn14 have shown that the supported
phase/support signal intensity ratio is related to the dispersion of the supported phase. In this model, the catalyst is supposed to consist of several sheets of the support with cubic particles of equal size in between. Thus, the oxide cobalt particle size can be estimated from the Co2p3/2 and
Al2p intensity ratio, (ICo/IAl)crystallite, according to equation 1:
(1)
(1)
where , c is the cube edge length of the average
cobalt particle and λCo is the mean escape depth of the photoelectrons from cobalt passing through cobalt oxide.
The predicted monolayer intensity of Co and Al were calculated using the Kerkhof and Moulijn model,14
according to equation 2:
(2)
where β1 = t / λ(Al/Al) and β2 = t / λ(Co/Al). λ(Al/Al) is the mean
escape depth of the photoelectrons from aluminum passing through the alumina, λCoAl is the mean escape depth of the
photoelectrons from cobalt passing through the alumina and t is mean thickness of the alumina. The term (nCo/nAl)bulk
is the bulk atomic ratio of cobalt and aluminum from the
catalysts. The mean escape depth of the photoelectrons used were obtained from Penn.15
The detector efficiency D is a function of the kinetic energy of the electrons and σ is the photoelectron cross sections. These parameters were substituted by the atomic sensitivity factor from the Avantage Software library, 12.62 for Co2p3/2 and 0.537 for Al2p.
For the 1Co/Al2O3 catalyst, the ratio between the
measured Co2p3/2 and Al2p intensity ratios and the
predicted monolayer intensity ratio is 1.28 as shown in Table 2. As this ratio cannot be higher than 1, this result indicates that cobalt aluminate is not dispersed as in the Kerkhof and Moulijn model. For the other catalysts, the average CoAl2O4 particle size was estimated. The cobalt
aluminate particle size increased with the cobalt content. As the cobalt Co2p3/2 peak from CoO and Co3O4 have
approximately the same binding energy, it was not possible to separate these peaks precisely. Hence, the average particle size of CoO and Co3O4 were estimated together.
The average cobalt oxide size also increased with cobalt content and they are larger than the CoAl2O4 particles. The
cobalt particle size is shown in Table 2.
For the 1CoAl2O3 catalyst, a highly dispersed cobalt
aluminate may be formed by cobalt atom migration into the bulk alumina matrix, as found by Liotta et al.16 and
Jongsomjit et al..17
The 1Co/Al2O3 catalyst presented only CoAl2O4
species as found by XPS, a surface analysis, and by TPR, a bulk analysis (see TPR section, below). This catalyst showed approximately the same CoAl2O4 concentration
on the surface (XPS measurements) and in the bulk phase, as found by EDX analysis (Table 1). Application of the Kerkhof and Moulijn model has also shown that the cobalt aluminate species remain highly dispersed in the other catalysts as in the case of 1Co/Al2O3. In this way,
the CoAl2O4 concentration on the surface was assumed
as equal to the bulk concentration for all studied catalysts and the total amount of cobalt as CoAl2O4 present in the
catalysts was determined by multiplying the fraction of Co as CoAl2O4 estimated by XPS by the weight fraction
of bulk Co measured by EDX.
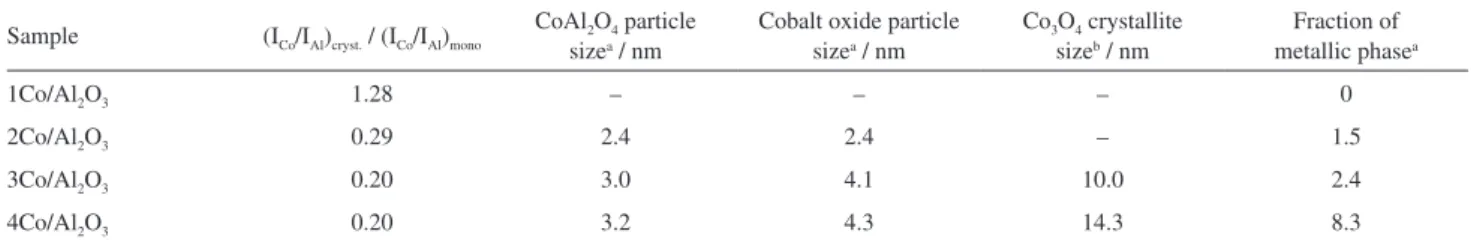
Table 2. Average cobalt particle size estimated by XPS intensities, Co3O4 crystallite average size calculated by XRD
Sample (ICo/IAl)cryst. / (ICo/IAl)mono
CoAl2O4 particle sizea / nm
Cobalt oxide particle sizea / nm
Co3O4 crystallite sizeb / nm
Fraction of metallic phasea
1Co/Al2O3 1.28 – – – 0
2Co/Al2O3 0.29 2.4 2.4 – 1.5
3Co/Al2O3 0.20 3.0 4.1 10.0 2.4
4Co/Al2O3 0.20 3.2 4.3 14.3 8.3
Increasing the cobalt content in the catalysts, there was an increase in the total amount of CoAl2O4 up to
2.1 wt.% on the 3Co/Al2O3 catalyst. This shows that there
is a maximum limit between 2 and 3 wt.% Co for the CoAl2O4 formation on the cobalt/alumina catalyst, when
it is prepared as in the synthesis conditions described in the experimental section.
X-Ray diffraction
XRD analysis was used to determine the crystalline phases and to estimate the cobalt oxide crystallite size. Figure 3 shows the XRD patterns of the support and oxide catalysts. The diffraction peak at 40.0 and 66.7o are those
of γ-Al2O3 and they can be observed in all samples.
The 3 and 4Co/Al2O3 catalysts showed diffraction
peaks at 31.3, 36.9 and 59.5o. These diffraction lines can be
related to Co3O4 or CoAl2O4 species.17 In this way, it was not
possible to distinguish these two phases by XRD. However, CoAl2O4 species are well dispersed and there is a maximum
on its formation (2.1 wt.%) in the 3Co/Al2O3 catalysts,
as found by XPS. This way, the increase in the cobalt diffraction peak intensity from 3 to 4Co/Al2O3 catalysts on
the XRD patterns may be attributed to the Co3O4 species.
The diffraction peaks of CoO, 42.6 and 61.8o,17 could not
be observed in the XRD patterns. It may due to its low loading, which can lead to a very small particle size or the CoO particles were amorphous.
The average Co3O4 crystallite size was calculated from
the most intense Co3O4 peaks at 36.9° using the Scherrer
equation. These results can be observed in Table 2.
The average crystallite sizes found by XRD were quite larger than the particle size found by XPS. In the case of XPS, the particle size was estimated from the Co2p3/2 peak
associated with photoelectrons leaving the CoO and Co3O4
particles, not only from the crystalline Co3O4 particles.
Thus, the particle size calculated by XPS is probably an average of small CoO and large Co3O4 particles.
Temperature programmed reduction
TPR can help with the identification and quantification of the cobalt oxide species supported on alumina. The TPR profile for 1Co/Al2O3 didn’t show any significant hydrogen
consumption, Figure 4a. This shows that there was only irreducible cobalt species present on this catalyst, in the form of CoAl2O4, as suggested by Jongsomjit et al..17 XPS
analysis showed that 93 wt.% of these species are cobalt aluminate. The presence of this species on the catalysts is not desired, since only metallic cobalt particles are able to decompose methane and grow carbon nanotubes.
The TPR profile of the 2Co/Al2O3 catalyst showed
four small reductions peaks, suggesting that there are four different reducible cobalt species. The peak at 364 oC
is attributed to the reduction of an amorphous cobalt oxide similar to bulk Co3O4.18 The peak around 507 oC is
attributed to the two-step reduction of Co3O4. This reduction
temperature is higher than the reduction temperature of a bulk Co3O4 sample. This shift to higher temperatures
demonstrates that there is an interaction between the support and the cobalt oxide particles.19 The small peak at
737 oC is associated with the reduction of CoO linked to
alumina19and the reduction peak at 1000 oC is attributed
to reduction of cobalt aluminate.20
Figure 3. XRD patterns of oxide catalysts: (a) Al2O3; (b) 1Co/Al2O3;
(c) 2Co/Al2O3; (d) 3Co/Al2O3; and (e) 4Co/Al2O3. □ Co3O4 phase;
●γ-Al2O3 phase.
Figure 4. TPR profiles of catalysts (a) 1Co/Al2O3; (b) 2Co/Al2O3; (c) 3Co/Al2O3; and (d) 4Co/Al2O3. The reduction was conducted under
The irreducible cobalt aluminate present in the 1Co/Al2O3 catalyst may have different structure from the
reducible aluminate present in the 2Co/Al2O3 catalyst. The
cobalt aluminate spinel may be a partly inverse spinel, in which some Co2+ ions are placed in unstable octahedral
positions, or a normal spinel, with Co2+ ions placed in
stable tetrahedral positions. Because of their different stability, Co2+ ions in partly inverse spinel are reduced at
lower temperatures than in normal spinel.
The reduction profile for the 3Co/Al2O3 catalyst also
showed four different reducible cobalt species, as in 2Co/Al2O3. However, the fraction of each reduced cobalt
species was different. The fraction of Co3O4 (peak at 507 oC)
was higher for 3Co/Al2O3 than for 2Co/Al2O3. This peak
was also intense in the TPR profile of the 4Co/Al2O3
catalyst, in agreement with its X-ray diffractogram. The degree of reduction is an important parameter on catalyst activity and different cobalt oxide species require different amounts of hydrogen to be reduced to its metallic form. The fraction of the cobalt present as Co3O4 species
can be estimated from the hydrogen consumption from 130 to 645 oC. This reduction corresponds to the following
reaction: Co3O4 + 4H2→ 3Co + 4H2O. Thus, a molar ratio
of 1.33 H2/Co is required. The CoO and CoAl2O4 species
demand a molar ratio of 1H2/Co for their reduction.18,19
In this way, it was possible to estimate the total hydrogen consumption for a complete catalyst reduction and the degree of reduction was then calculated. Table 3 shows the degree of reduction for the several catalysts.
The degree of reduction increased with the cobalt content in the catalyst. However, there was a large cobalt fraction that was not reduced in all studied catalysts. The strong interaction between cobalt and alumina can form surface and bulk spinels that are not easily reduced.21
The trend of increasing degree of reduction with the cobalt content was previously observed for the Co/Al2O3
catalysts.21
While all Co3O4 was reduced to its metallic form, only
a small fraction of CoO and CoAl2O4 was reduced from
645 to 1000 oC. In this way, the overall fraction of CoO
and CoAl2O4 could not be determined by TPR. However,
the fraction of CoO can be calculated by the subtraction of the Co3O4 fraction determined by TPR from the CoAl2O4
fraction estimated by XPS. XPS was used to estimate the CoAl2O4 concentration, considering that this species is
uniformly distributed through the catalyst, as discussed before. Figure 5 shows the distribution of cobalt species for the catalysts.
The increase of cobalt loading on the catalysts led to a higher formation of reducible Co3O4 as compared to
reducible CoO and CoAl2O4 species. From Figure 5 we can
also note that the weight percentage of cobalt as irreducible CoAl2O4 did not increase much, increasing with the cobalt
content up to the 3Co/Al2O3 catalyst while the formation
of irreducible CoO keeps increasing. These changes in composition affect the catalyst color and they became darker with the increase of Co3O4 species.
Chemisorption
A better representation of the cobalt particle as it stands before the carbon nanotube reaction can be done by its characterization in the reduced or in the passivated state. The chemisorption measurements may be used to estimate the average metallic particle size. For this, it is necessary to know the catalyst degree of reduction at the beginning of reaction. So, the pretreatment degree of
Table 3. Results from TPR. Oxide catalyst degree of reduction, distribution of cobalt species and degree of reduction of the reduced catalysts (after pretreatment reduction step)
Sample Degree of reduction / % Fraction of Co
3O4
Fraction of CoO and CoAl2O4
Pretreatment degree of reduction / %
1Co/Al2O3 0 0 1 0
2Co/Al2O3 27 0.07 0.93 17
3Co/Al2O3 30 0.16 0.84 20
4Co/Al2O3 31 0.24 0.76 22
reduction was determined by a new TPR after the reduction step. The difference between the hydrogen consumption for reduction of the oxide catalysts and for the partially reduced catalysts is related to the hydrogen consumption during the reduction pretreatment step. Table 3 shows values of the pretreatment degree of reduction of the catalysts. The pretreatment degree of reduction increased with cobalt loadings up to 22%. After pretreatment, the catalysts show values of degree of reduction similar to the degree of reduction observed after the standard TPR. So, an increase in the temperature of catalyst reduction during the pretreatment reduction step would not increase the final degree of reduction. Additionally, static H2 and CO
chemisorption measurements were used to determine the dispersion and average particle size of the metallic cobalt particles. These reduced species are related to the catalyst activity and structure of carbon nanotube growth. There is a correlation between the size of the catalyst particles and the CNT diameter.22-24 The average particle size was
calculated from total H2 uptake and from irreversible CO
uptake using a stoichiometric adsorption ratio of 2 and 1, respectively. Table 4 shows the total and irreversible H2 and
CO uptakes and average particle size.
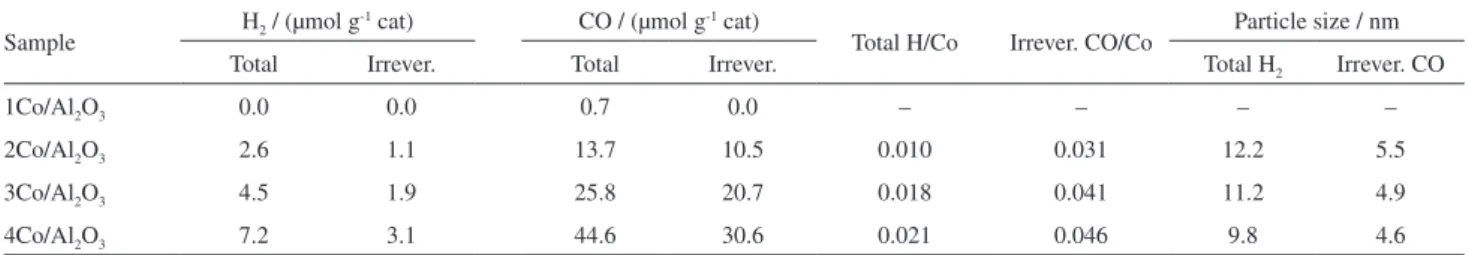
H2 and CO uptakes increased with cobalt loading and
higher values were obtained for CO uptake, as previously reported by Reuel and Bartholomew.8 Besides, the total
H/Co and irreversible CO/Co ratios have shown some increase with increasing metal loading. In this way, the 4Co/Al2O3 catalyst showed better metallic dispersion and
smaller metallic particle size than 2 and 3 wt.% cobalt catalysts. However, in the oxidized state, the particle size increased with the increase of cobalt loading. Nevertheless, the 2 and 3 wt.% cobalt catalysts showed cobalt oxide particles that are reduced at low temperature (see TPR profile). These metallic particles may have agglomerated on the reduction pretreatment step.
To clarify the cobalt agglomeration during the reduction pretreatment, the reduced catalysts were re-oxidized with 1.0% O2/He (30 mL min-1) during 2 h at 550 oC. Then,
these catalysts were analyzed by XRD. The particle size of the 1 and 2 wt.% cobalt catalysts could not be estimated
due the low Co3O4 peak signal. However, the particle size
of 3Co/Al2O3 increased from 10.0 to 14.3 nm and the
4Co/Al2O3 catalyst didn’t change much its particle size,
14.2 nm. These results support the particle agglomeration suggestion during the reduction pretreatment.
These re-oxidized samples were also studied by XPS measurements, Figure 6. There was no significant difference between the XPS spectra of 1Co/Al2O3 in
the oxide and passivated state. This result agrees with TPR findings, where no reduction was observed for the 1Co/Al2O3 oxide catalyst. Thus, there was no chemical
change in its composition after the reduction and passivation steps. The XP spectrum of the other passivated catalysts showed small differences in their profile in relation to oxide profile. These differences can be observed in the inset graph of Figure 6. The 2, 3 and 4Co/Al2O3 catalysts
showed two main peaks in the inset. The first peak, at 778.2 eV, represents the increase of the metallic phase,3,12
and the second peak (negative), at 780.3 eV, represents the decrease of cobalt as oxide species in the passivated catalyst in relation to the oxide catalysts.
Table 4. Total and irreversible H2 and CO chemisorption, dispersion and particle sizes of catalysts obtained from chemisorption
Sample H2 / (µmol g
-1 cat) CO / (µmol g-1 cat)
Total H/Co Irrever. CO/Co Particle size / nm
Total Irrever. Total Irrever. Total H2 Irrever. CO
1Co/Al2O3 0.0 0.0 0.7 0.0 – – – –
2Co/Al2O3 2.6 1.1 13.7 10.5 0.010 0.031 12.2 5.5
3Co/Al2O3 4.5 1.9 25.8 20.7 0.018 0.041 11.2 4.9
4Co/Al2O3 7.2 3.1 44.6 30.6 0.021 0.046 9.8 4.6
Figure 6. XPS spectra of the passivated catalysts in the Co2p region. The oxide catalysts were reduced in H2 at 700 oC and then exposed to 1% O
2/He
for 2 h at room temperature. (a) 1Co/Al2O3; (b) 2Co/Al2O3; (c) 3Co/Al2O3;
and (d) 4Co/Al2O3. The vertical dot lines are binding energy reference compounds: Co0 (778.2 eV), Co
3O4 (780.2 eV) and CoAl2O4 (782.0 eV).12
The fraction of metallic phase, R, can also be obtained by using the following equation:25
(3)
The fraction of metallic phase increased with the cobalt loading,Table 2. However, the degree of reduction found
by XPS is significantly lower than that calculated by TPR. The passivation step produces a cobalt oxide shell on the metallic cobalt particle and the cobalt fraction on the oxide shell is higher on small particles. Moreover, XPS is a surface method while TPR is a bulk method.
Carbon nanotube production and characterization
TEM
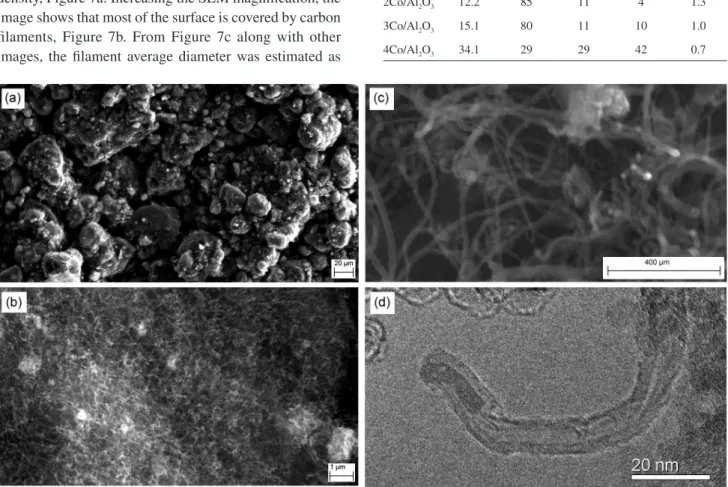
Carbon nanotube production was characterized by SEM and TEM. The SEM images showed low-density carbon deposits in the case of the 1, 2 and 3Co/Al2O3 catalysts.
However, the 4Co/Al2O3 catalyst showed a high carbon
density, Figure 7a. Increasing the SEM magnification, the image shows that most of the surface is covered by carbon filaments, Figure 7b. From Figure 7c along with other images, the filament average diameter was estimated as
13 nm (73 filaments measured). The average diameter of metallic cobalt particles found by H2 chemisorption was
approximately the same of the average diameter of the filaments, 14.2 nm. TEM images show that theses filaments are carbon nanotubes and most of them are multi-walled carbon nanotubes (MWNT). Figure 7d shows MWNT growth on the 4Co/Al2O3 catalyst.
TPO
The total carbon yield during the reaction step was defined as the mass of carbon deposited per mass of
catalyst. 1Co/Al2O3 didn’t show any significant carbon
deposition. In this catalyst, most of the cobalt is present as cobalt aluminate and it could not be reduced during the reduction pretreatment. Table 5 shows the total carbon yield for the several catalysts. The carbon yield is proportional to
Figure 7. Images of carbon nanotubes prepared on 4Co/Al2O3 catalysts. (a), (b) and (c) SEM images at different magnifications; (d) TEM image. Table 5. TPO and Raman spectroscopy data of carbon deposits on the catalysts
Carbon deposit on catalyst
Yield / %
Selectivity / %
D/G ratio
Amorphous SWNT MWNT
1Co/Al2O3 0 – – –
2Co/Al2O3 12.2 85 11 4 1.3
3Co/Al2O3 15.1 80 11 10 1.0
the metallic surface area. The 4Co/Al2O3 catalyst showed
the highest production, 37.5%.
Combining the data obtained from TPO, Raman and electron microscopy, it was possible to estimate the amount of each carbon species produced in the reaction step. Three main different species can be produced in the carbon nanotube reaction step. These different carbon species oxidize at different temperatures. The TPO profiles of the carbon species present on the catalysts are illustrated in Figure 8. The 2 and 3Co/Al2O3 catalysts showed low
selectivity toward carbon nanotubes. In their profiles, there is a large peak at 380 oC related to amorphous
carbon oxidation. These catalysts have shown metallic particle agglomeration in the reduction pretreatment. These agglomerated particles may not have the adequate shape or size for carbon nanotube growth. Table 5 shows the catalyst activity and selectivity of catalysts.
Raman
Raman spectroscopy provides information about the structure of carbon nanotubes and other carbon species. The tangential mode, called G band, at 1590 cm-1 is used
to identify the presence of ordered carbon-like graphite and carbon nanotubes. The D band at 1350 cm-1 is related to
defects on the carbon nanotube structure and the presence of amorphous carbon.26-28 The intensity of the D band relative
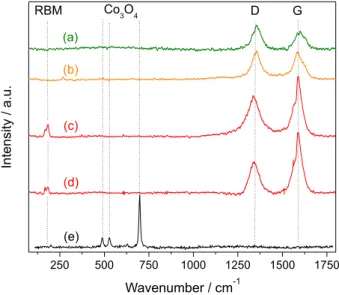
to the G band has been used as qualitative measurement of the formation of undesirable forms of carbon on nanotube production. Figure 9 shows the Raman spectra of carbon deposits formed on the catalysts.
The carbon deposits on the 2 and 3 Co/Al2O3 catalysts
showed high D/G intensity ratios. These results indicate
the presence of amorphous carbon and/or poorly structured carbon nanotubes, which were not observed on the SEM images. The TPO profile of these samples showed that most of the carbon deposits were amorphous carbon.
The D/G intensity ratio of carbon deposits on 4Co/Al2O3 was lower than on the 2 and 3Co/Al2O3 catalysts.
The TPO profile also showed a decrease in the amorphous carbon fraction.
The influence of amorphous carbon in the Raman spectrum was verified by its oxidation for the 4Co/Al2O3
catalyst. The oxidation consisted of a flow of 1% O2/He
(30 mL min-1) at a heating rate of 2 oC min-1 up to 350 oC.
Then, the sample was cooled under He flow until room temperature and a new TPO profile and a Raman spectrum were acquired, Figure 8d and Figure 9d, respectively. The new TPO profile showed a smaller fraction of amorphous carbon and the remnant carbon species deposited on the catalysts did not change their oxidation profile significantly. In the case of the Raman experiments, the D/G intensity improved to 0.5, indicating the amorphous carbon was removed by the oxidation at 350 oC.
The carbon deposits on the 4Co/Al2O3 catalyst showed
two small peaks at 167 and 183 cm-1. These peaks are
associated with single-walled carbon nanotubes (SWNT) and they are called radial breathing mode (RBM) peaks. TPO showed that 29% of carbon deposits on 4 Co/Al2O3
were SWNT. Some oxide species, like CoO, Co3O4 and
CoAl2O4 can also show Raman peaks in the RBM region. In
order to identify the cobalt oxide peaks, a Raman spectrum of the 4Co/Al2O3 oxide catalyst was acquired, Figure 9e.
There was not any overlap between the RBM peaks and
Figure 8. TPO profiles of the carbon species present on (a) 2Co/Al2O3;
(b) 3Co/Al2O3; and (c) 4Co/Al2O3. (d) TPO profiles of the carbon species
present in 4Co/Al2O3 after CNT reaction and oxidation step under 1% O2/He (30 mL min-1) at a heating rate of 2 oC min-1 up to 350 oC.
Figure 9. Raman spectra of the carbon deposits on (a) 2Co/Al2O3;
(b) 3Co/Al2O3 and (c) 4Co/Al2O3. (d) Spectrum of the carbon deposits on 4Co/Al2O3 after CNT reaction and oxidation step under 1% O2/He (30 mL min-1) at a heating rate of 2 oC min-1 up to 350 oC. (e) Spectrum
the cobalt oxide peaks. So, the peaks found at 167 and 183 cm-1 on spectra c and d in Figure 9 are from SWNT.
Conclusions
There are three main cobalt species in Co/γ-Al2O3
catalysts, CoAl2O4, CoO and Co3O4. Most cobalt in the
1Co/Al2O3 catalyst was present as CoAl2O4. This species
was irreducible and highly dispersed on the support. Increasing the cobalt content of the catalysts led to a higher formation of Co3O4 as compared to the reducible CoO and
CoAl2O4 species.
Catalysts with 2 and 3 wt.% of cobalt have cobalt oxide particles that reduced at low temperatures, lower than 400 oC. These particles agglomerated during the
pretreatment step. These particles may not have the shape or size for carbon nanotube production.
The 4Co/Al2O3 catalyst showed high selectivity toward
carbon nanotube production, mainly MWNT. The average metallic particle size is approximately the size of the carbon nanotube diameter, with the same correlation found in the literature.
Acknowledgments
We would like to thank Coordenação de Aperfeiçoamento de Pessoal de Nível Superior (CAPES) and Fundação de Amparo à Pesquisa do Estado do Rio de Janeiro (FAPERJ Proc. E-26/110.128/2013) for financial support and also Instituto Militar de Engenharia (IME) for the SEM images. We dedicate this manuscript to the memory of Prof Roberto Fernando de Souza, who acted for the development of the catalytic community in Brazil.
References
1. Cheng, H. M.; Li, F.; Su, G.; Pan, H. Y.; He, L. L.; Sun, X.; Dresselhaus, M. S.; Appl. Phys. Lett. 1998, 72, 3282.
2. Zhou, W. Y.; Bai, X. D.; Wang, E. G.; Xie, S. S.; Adv. Mater.
2009, 21, 4565.
3. Herrera, J. E.; Balzano, L.; Borgna, A.; Alvarez, W. E.; Resasco, D. E.; J. Catal. 2001, 204, 129.
4. Irurzun, V. M.; Tan, Y. Q.; Resasco, D. E.; Chem. Mater. 2009,
21, 2238.
5. Wen, Q.; Zhang, R. F.; Qian, W. Z.; Wang, Y. R.; Tan, P. H.; Nie, J. Q.; Wei, F.; Chem. Mater. 2010, 22, 1294.
6. Oliveira, H. A.; Franceschini, D. F.; Passos, F. B.; J. Braz. Chem. Soc. 2012, 23, 868.
7. Zowtiak, J. M.; Bartholomew, C. H.; J. Catal. 1983, 83, 107. 8. Reuel, R. C.; Bartholomew, C. H.; J. Catal. 1984, 85, 63.
9. Rane, S.; Borg, O.; Yang, J.; Rytter, E.; Holmen, A.; Appl. Catal., A 2010, 388, 160.
10. Sexton, B. A.; Hughes, A. E.; Turney, T. W.; J. Catal. 1986, 97, 390.
11. Carta, G.; Casarin, M.; El Habra, N.; Natali, M.; Rossetto, G.; Sada, C.; Tondello, E.; Zanella, P.; Electrochim. Acta 2005, 50,
4592.
12. Hilmen, A. M.; Schanke, D.; Hanssen, K. F.; Holmen, A.; Appl. Catal., A 1999, 186, 169.
13. Lee, J. C.; Kang, H. J.; Kim, K. J.; Kim, Y. S.; Moon, D. W.;
Surf. Sci. 1976, 324, 338.
14. Kerkhof, F. P. J.; Moulijn, J. A.; J. Phys. Chem. 1979, 83, 1612.
15. Penn, D. R.; J. Electron Spectrosc. Relat. Phenom. 1976, 9, 294.
16. Liotta, L. F.; Pantaleo, G.; Macaluso, A.; Di Carlo, G.; Deganello, G.; Appl. Catal., A 2003, 245, 167.
17. Jongsomjit, B.; Panpranot, J.; Goodwin, J. G.; J. Catal. 2001,
204, 98.
18. Van Steen, E.; Sewell, G. S.; Makhothe, R. A.; Micklethwaite, C.; Manstein, H.; De Lange, M.; O’Connor, C. T.; J. Catal. 1996, 162, 220.
19. Storsaeter, S.; Totdal, B.; Walmsley, J. C.; Tanem, B. S.; Holmen, A.; J. Catal. 2005, 236, 139.
20. Zhang, J. L.; Chen, J. G.; Ren, J.; Sun, Y. H.; Appl. Catal., A
2003, 243, 121.
21. Chin, R. L.; Hercules, D. M.; J. Phys. Chem. 1982, 86, 360.
22. Nagaraju, N.; Fonseca, A.; Konya, Z.; Nagy, J. B.; J. Mol. Catal. A: Chem. 2002, 181, 57.
23. Chai, S. P.; Zein, S. H. S.; Mohamed, A. R.; Chem. Phys. Lett. 2006, 426, 345.
24. Dai, H.; Surf. Sci. 2002, 500, 218.
25. Stranick, M. A.; Houalla, M.; Hercules, D. M.; J. Catal. 1987, 103, 151.
26. Grimm, D.; Gruneis, A.; Kramberger, C.; Chem. Phys. Lett.
2006, 428, 416.
27. Saito, R.; Fujita, M.; Dresselhaus, G.; Dresselhaus, M. S.; Appl. Phys. Lett. 1992, 60, 2204.
28. Alvarez, W. E.; Pompeo, F.; Herrera, J. E.; Balzano, L.; Resasco, D. E.; Chem. Mater. 2002, 14, 1853.
Submitted: August 5, 2014