Article
J. Braz. Chem. Soc., Vol. 25, No. 4, 759-769, 2014. Printed in Brazil - ©2014 Sociedade Brasileira de Química
0103 - 5053 $6.00+0.00
A
*e-mail: [email protected]
Study of Biodiesel Photodegradation Through Reactions
Catalyzed by Fenton’s Reagent
Elizangela Ambrosio, Lorena M. Milano, Maísa Tatiane F. de Souza, Lucas U. R. Chiavelli, Paula F. Montanher, Jesuí V. Visentainer,
Vitor de C. Almeida, Nilson E. Souza* and Juliana C. Garcia
Departamento de Química, Universidade Estadual de Maringá, Av. Colombo, 5790, 87020-900 Maringá-PR, Brazil
A fotodegradação de biodiesel em contato com água, utilizando reação foto-Fenton, foi investigada neste estudo. Após 360 h de fotodegradação obteve-se uma redução de 73% dos ésteres metílicos de ácidos graxos (FAMEs) quantificados inicialmente por cromatografia em fase gasosa acoplada ao detector por ionização em chama (GC/FID). No decorrer da fotodegradação foram detectados picos para cetona e grupo epóxido nas cadeias alifáticas em análises por cromatografia em fase gasosa acoplada ao espectrômetro de massas (GC/MS), e deslocamentos típicos de aldeídos e ácidos graxos de cadeia curta em análises por espectroscopia de ressonância magnética nuclear de hidrogênio (1H RMN). As análises de eco toxicidade usando como organismo teste Artemia salina
evidenciaram componentes tóxicos na fase aquosa que aumentaram até 168 h de fotodegradação, apresentando decréscimo após este período.
This study reports on the photodegradation of biodiesel in contact with water using the photo-Fenton reaction. After 360 h of photodegradation, we observed a reduction of 73% in the amount of fatty acid methyl esters (FAMEs) initially quantified by gas chromatography coupled with a flame ionization detector (GC/FID). During the photodegradation, peaks for ketones and epoxy groups in carbon chains were recorded by gas chromatography coupled with mass spectrometry (GC/MS), and typical aldehyde and short-chain fatty acid shifts in hydrogen nuclear magnetic resonance spectroscopy (1H NMR) were observed. Ecotoxicity assays with Artemia salina revealed
the presence of toxic components in the aqueous phase in increasing amounts up to 168 h of photodegradation and decreasing thereafter.
Keywords: photodegradation, Fenton reactions, biodiesel, bioassay, advanced oxidation processes
Introduction
Biodiesel and bio-oil are useful options for the generation of renewable energy from biomass. Indeed, aiming at economic and social benefits, biodiesel is already being used in several countries, including China, Nicaragua, the United States, Japan, European Union countries, and Brazil. However, during the transport of these fuels, accidents and spills may occur and contaminate soil and aquatic environments.1 Due to limitations in the removal of
this type of material from the environment, it is important to investigate alternatives for safely and economically degrading them on site. To date, studies have been published
on the oxidative stability of biodiesel in contact with air, light, and at high temperatures.2-6 It is known that the stability
of biodiesel is related to the presence of unsaturation in the carbon chains, temperature, presence of light, enzymes, and microorganisms, and storage conditions. Oxidation can be accelerated in the presence of metallic ions, leading to the formation of several degradation products, such as peroxides and hydroperoxides, which can later be converted into aldehydes, ketones, and short-chain and volatile carboxylic acids. However, long-chain compounds are also formed by oxidative polymerization.6
Physico-chemical processes, such as coagulation/flocculation7,8 and
filtration,9,10 may be used to treat effluents by removing
by Ramirez et al.,11 whereby a biological process was
linked to the photo-Fenton process to treat wastewater from the washing of biodiesel. AOPs are efficient for the degradation of many organic compounds and are characterized by the action of the highly oxidative hydroxyl radical (•OH) (equation 1), which can oxidize various organic compounds to CO2, H2O, and inorganic ions derived
from heteroatoms.12
HO• + e– + H+→ H
2O, Eº = 2.730 V (1)
Hydroxyl radicals are generally formed in reactions as a result of the combination of oxidants (e.g., ozone or hydrogen peroxide) and catalysts (e.g., metallic ions and semiconductors) under ultraviolet (UV) or visible (Vis) light. Among AOPs, the Fenton process is often employed due to its efficiency and non-toxicity.12-14 The Fenton
reaction occurs through the catalyzed decomposition of hydrogen peroxide by ferrous ions in an acid medium, with the production of hydroxyl radicals (equation 2). In the absence of a substrate, the hydroxyl radicals formed may oxidize other Fe+2 ions, as shown in equation 3, and
the resulting ferric ions can decompose H2O2 into water and
oxygen. However, excess H2O2 can hinder the degradation
process due to the formation of hydroperoxyl radical (HO2•)
via a reaction with hydroxyl.12
Fe2+ + H
2O2→ Fe
3+ + HO• + OH– (2)
Fe2+ + HO• → Fe3+ + OH– (3)
The objective of this study was to investigate the photodegradation of biodiesel B 100 using the photo-Fenton AOP under irradiation from a mercury lamp and to compare it to other catalytic degradation methods (Fenton and photolysis) in terms of degradation time and efficiency.
Experimental
This study utilized pure biodiesel (B 100) obtained by a methylic route from animal (40%) and vegetable origin (60%) and was kindly provided by a mill from the northwest region of Paraná State, Brazil. The biodiesel was stored at room temperature in amber-colored glass flasks wrapped in aluminum foil. The following chemicals of analytical grade were used without previous purification: H2O2 (30-32%, FMaia), H2SO4 (95-97%,
Biotec), FeSO4.7H2O (97.6%, FMaia), ethanol (99.3%,
FMaia), NaOH (98.0%, Synth), K2Cr2O7 (99.0%,
Nuclear), KI (99.0%, Neon), Na2SO3 (98.8%, J. T. Baker),
HPLC-grade dichloromethane (99.9%, Sigma-Aldrich), and HPLC-grade hexane (99.9%, Mallinckrodt).
Chamber for sample irradiation
A wooden box measuring 0.57 × 0.90 × 0.53 m
(l × w × h) was fitted with 8 cooling blowers, four on each of two opposite sides. A mercury lamp (250 W, Philips E-40) without a glass protection cover was fixed at the center of the top of the box, 30 cm away from the suspension surface. The lamp emitted in the UVA, UVB, UVC, and visible bands, but the UVC radiation was filtered by the borosilicate glass of the reactors. The inside of the box was painted black with Brasilux extra-quick-drying enamel paint to prevent light reflection on the walls. The power of the light source inside the photo-reactor was measured with a light meter probe placed at the same position of the sample, resulting in an irradiance of approximately 3.0 mW cm-2.
Biodiesel degradation
To accelerate the degradation of biodiesel, assays were performed with aliquots of biodiesel in contact with water and Fenton’s reagent. The water was acidified with sulfuric acid (pH 2.50) and was placed in Petri dishes (15.0 ± 0.1 mL), and B 100 was added (1.00 ± 0.02 mL), forming a thin layer on top of the water. Fenton’s catalyst, consisting of a ferrous sulfate solution (9.79 ± 0.49 g L-1)
mixed with 30% (v/v) hydrogen peroxide, was then added; the dishes were covered with PVC film and placed inside the irradiation chamber.
Temperature effect
To determine the effect of the temperature inside the reactor on the degradation of biodiesel, some Petri dishes were wrapped in aluminum foil and placed inside the box together with the other samples.
The influence of UV radiation
The effect of light on the degradation of biodiesel was assessed by photolysis assays. Aliquots of B 100 without Fenton’s reagent were irradiated together with the other samples.
Initial H2O2 concentration
To determine the optimum degradation conditions, the irradiation time was set at 144 h, and the ratio between the molar concentration of ferrous ions [Fe2+] from the ferrous
sulfate heptahydrate solution and the molar concentration of hydrogen peroxide [H2O2] was varied as follows:
[Fe2+]:[H
5.34 to 10.4 × 10⁻³ mol L-1 and [H
2O2] as 4.02, 8.05, 15.6,
and 32.9 × 10⁻³ mol L-1.
Extraction
After the irradiated samples were removed from the chamber, the pH of the samples was measured and adjusted to 6.5-7.0 by adding a Fenton reaction inhibitor solution containing 0.10 mol L-1 KI, 0.10 mol L-1 Na
2SO3, and
0.10 mol L-1 NaOH to precipitate solid Fe(OH) 3.
13 The
mixture was filtered through a membrane (HA cellulose esters, 0.45 µm, 47 mm, flat white, Millipore) using hexane to facilitate the passage of the organic phase, and a separation funnel was used to separate the organic and aqueous phases of the filtrate (hexane, 2 × 10.0 mL). The organic phase was evaporated in a rotary evaporator and transferred to Eppendorf tubes, covered with aluminum foil, and frozen. The volume of the aqueous fractions was adjusted to 99.919 ± 0.0218 mL and stored in a refrigerator in amber-colored glass flasks wrapped with aluminum foil.
Gas chromatography coupled with mass spectrometry (GC/MS)
The chemical constituents were analyzed by GC/MS (Thermo-Finnigan) equipped with a source of electron ionization (EI, 70 eV) and a mass analyzer quadrupole. The constituents were identified by a comparative analysis with fatty acid methyl ester mass spectra from the spectrum database contained in the NIST MS Search spectral library using the software Xcalibur with the Kovats indices, which were obtained by co-injection of the organic phase with a mixture of alkane standards (C9-C21) using the Van den Dool and Kratz equation.15 The oil phases were subjected to
rotary evaporation to eliminate the hexane and diluted with HPLC-grade dichloromethane at 1:10000 and analyzed by GC/MS using a DB-5 capillary column (5% phenyl-95% methylpolysiloxane, 30 m × 0.25 mm × 0.25 µm) and He as the carrier gas. The detected masses ranged from 45 to 550 m/z. A sample volume of 1 µL was injected in split mode 1/10 at injector and ionizer temperatures of 250 °C, with the following heating ramp: initial temperature of 50 °C up to 290 °C at 3 °C min-1, maintained for 20 min.
Gas chromatography coupled with flame ionization detection (GC/FID)
The methyl esters were separated by gas chromatography using a Trace Ultra 3300 chromatograph (Thermo Scientific) equipped with flame ionization and a cyanopropyl capillary column (100 m × 0.25 mm × 0.25 µm, CP 7420). The
gas flow rates used were 1.2 mL min-1 carrier gas (H 2),
30 mL min-1 make-up gas (N
2), and 35 and 350 mL min -1
flame gases (H2 and synthetic air, respectively). The
sample-splitting rate was 1:80, and 2-µL samples were injected in triplicate. The operation parameters were as follows: detector and injection port temperatures of 240 °C and 220 °C, respectively, and a column temperature of 185 °C for 7.5 min, programmed to increase at 4 °C min-1 from 1 to
235 °C and kept at this temperature for 1.5 min. The peak areas were determined using ChromQuest 5.0 software. The fatty acid retention times were compared to those of standard methyl esters. Quantification (in mg FAME g-1
of biodiesel) was performed using tricosanoic acid methyl ester as an internal standard (23:0), as described by Joseph & Ackman.16 Theoretical FID correction factor values were
used to obtain the concentrations,17 and the FAME contents
were calculated in mg g -1 of biodiesel using equation 4:
FAME = (AX WIS CFX /AIS WX ) × 100 (4)
where FAME is the mg of fatty acid methyl esters per g of biodiesel, AX is the peak area (FAME), AIS is the peak area
of the internal standard (IS), methyl ester of tricosanoic acid (23:0), WIS is the amount of IS added to the sample
in mg, WX is the sample weight (in mg), CFX is the
theoretical correction factor, and CFAE is the conversion
factor necessary to express the results in mg of fatty acids rather than methyl esters. However, the CFAE factor was
not used in this study because the results were already expressed in mg FAME.
Nuclear magnetic resonance spectroscopy (1H NMR)
B 100 biodiesel and biodiesel samples photodegraded with Fenton’s reagent for 6, 12, 24, 48, 72, 96, and 120 h were analyzed by 1H NMR.3,18 The spectra were recording
using a Varian Mercury Plus Model BB 300 MHz spectrometer operating at 300.06 MHz at 26.0 °C. The samples were dissolved in deuterated dichloromethane (CDCl3, from Aldrich) at 0.1% v/v tetramethylsilane (TMS)
(δ = 0.0 ppm), and the chemical shifts (δ) are given in ppm relative to TMS. The following acquisition parameters were used: spectral window, –2 to 14 ppm; pulse, 45°; number of repetitions of the pulse sequence, 32; acquisition time, 3.333 s; recycling delay, 1.000 s; spectral width, 4800.8 Hz; line broadening, 0.2 Hz; standard pulse sequence for 1H.
Oxitest
per analysis, an initial pressure of 6.0 bar, and an oxygen temperature of 110 °C.
Chemical oxygen demand (COD)
The chemical oxygen demand (COD) of the aqueous phase was determined by the colorimetric method.19 To
verify the consumption of the hydrogen peroxide added at the beginning of the photocatalysis process, it was necessary to quantify the final amount and its evolution during the photodegradation process. The ammonium metavanadate method was used,14,20 and the values of
residual peroxide were subtracted from the COD values.
Toxicological assay with A. salina L.
A brine shrimp (A. salina L.) assay was also employed for lethality screening of the aqueous phase of the samples irradiated with Fenton’s reagent for 24, 72, 120, 168, and 360 h based on the LC50 criterion using a nutritive solution, as described by Meyer et al..21,22 The cyst-like eggs were
hatched within a few hours, and the most resistant nauplii were used in the toxicity assay. For each test, a 5 mL mixture of effluent sample and nutritive solution (v/v) was prepared in a 10 mL glass tube at four dilutions (1, 10, 20, and 50%) in triplicate and was added to 1.00 mL of brine shrimp mixture into each tube. After 24 h, the numbers of dead and live brine shrimp in each tube were counted. As a control assay, A. salina L. larvae were incubated in pure nutritive solution.
Fluorescence spectroscopy
Synchronous fluorescence scans were recorded for the organic phase irradiated for 24, 72, 120, 168, and 360 h with Fenton’s reagent and for the initial biodiesel B 100 sample without dilution. The spectra were obtained with
a Varian Cary-50 commercial fluorimeter using a quartz cell. The wavelength interval, ∆λ, between λ
em and λex was
20 nm, with a 10 nm bandpass. All the experiments were performed at 20 °C.23,24
UV-Vis spectrophotometry
The aqueous and organic phases were tested using a Lambda 25 double-beam spectrophotometer (Perkin Elmer) in the range of 800 to 200 nm with 1.0 cm optical path length quartz cuvettes. Distilled water was used to adjust the transmittance to 100%, and aqueous-phase aliquots diluted in distilled water (1:1000) were analyzed. The organic phase was diluted in ethanol (1:10000), and ethanol was used to adjust the transmittance to 100%.
Results and Discussion
Determination of the best biodiesel photodegradation conditions using Fenton’s reagent
Eight biodiesel photodegradation assays were performed with five repetitions using a fixed degradation time of 144 h, Fenton reagent volumes ranging from 1.5 to 3.0 mL, and ferrous ion to hydrogen peroxide rates [Fe2+]:[H
2O2] of
0.30, 0.65, and 1.33, as shown in Table 1.
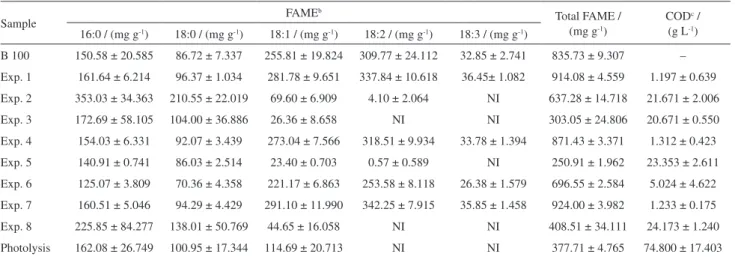
COD analyses of the aqueous phase and GC/FID analyses of the organic phase were performed, and the results are shown in Table 2.
Table 2 also shows the results of the main FAMEs identified in B 100, which are expressed as the methyl esters identified in 1 g of biodiesel or the organic phase. Comparing the FAME values for the initial B 100 biodiesel with the values found in experiments 1, 4, and 7 revealed an increase in the concentration of FAMEs in these experiments (Table 2). These results can be explained by the initial B 100 not coming into contact
Table 1. Factors analyzed for the optimization of the degradation of biodiesel
Experimenta [Fe2+] / (mol L-1) [H
2O2] / (mol L-1) Fenton volume / mL [Fe²+] : [H2O2] Light
1 5.34 × 10⁻³ 8.05 × 10⁻³ 1.54 0.65 absence
2 10.4 × 10⁻³ 32.9 × 10⁻³ 3.00 0.30 presence
3 5.34 × 10⁻³ 4.02 × 10⁻³ 1.54 1.33 presence
4 10.4 × 10⁻³ 15.6 × 10⁻³ 3.00 0.63 absence
5 5.34 × 10⁻³ 8.05 × 10⁻³ 1.54 0.65 presence
6 5.34 × 10⁻³ 4.02 × 10⁻³ 1.54 1.33 absence
7 10.4 × 10⁻³ 32.9 × 10⁻³ 3.00 0.30 absence
8 10.4 × 10⁻³ 15.6 × 10⁻³ 3.00 0.63 presence
with water prior to the GC/FID analysis. When B 100 contacted water, a fraction of glycerol migrated from B 100 to the aqueous phase, causing a relative increase in the concentration of FAMEs in the organic phase. This effect occurred in all experiments but was most evident in experiments 1, 4, and 7, which were performed in the absence of light.
During the degradation, there was a decrease in percentage in 16:1, 18:1, 18:2, and 18:3 unsaturated esters and an increase in the proportion of 16:0, 17:0, 18:0, 20:0, 22:0, and 24:0 saturated esters. Photolysis was performed to determine the influence of light alone on this process, proving to be an intense factor, as there was a decrease in total FAMEs of approximately 55% in relation to their initial amount in B 100. In contrast, a high COD, 59.476 g L-1, was
observed for the aqueous phase. In the assays with Fenton’s reagent, the maximum COD was lower than half of this value, which can be attributed to the action of the reagent on the photoproducts that migrated to the aqueous phase, thus accelerating their degradation. In the experiments in which the Petri dishes were wrapped with aluminum foil (experiments 1, 4, 6, and 7), the only effects observed were those of Fenton’s reagent and the temperature. As the increase in the temperature inside the irradiation box was not greater than 2 °C above room temperature, the main effect observed was due to Fenton’s reagent in the absence of light. Additionally, the COD values of the aqueous phase were approximately 20% smaller than those observed for the aqueous phase under irradiation, suggesting that few organic-phase components were transported to the aqueous phase. Therefore, the joint action of Fenton’s reagent and light is important in these reactions.
The aliquots with Fenton’s reagent that were irradiated showed an increase in saturated FAMEs and a decrease in unsaturated FAMEs, with a mean value of 61.5 ± 2.05% relative to B 100 and 22.5 ± 1.59% for the aqueous-phase COD. The best results were obtained in experiment 5, which had a total FAME content of 229.54 mg per g of organic phase analyzed and a smaller aqueous phase COD of 69% relative to the photolysis assay.
Gas chromatography coupled with mass spectrometry (GC/MS)
Kovats experimental indices (KI) were calculated using equation 5, as proposed by Van Den Dool and Kratz:15
KI = 100 × n + 100 ∆n × [(tr
x – trz) / (trz+1 – trz)] (5)
where n = the number of carbon atoms of compound x, ∆n = the variation in the number of carbon atoms of the hydrocarbon standard eluted before and after the addition of compound x, trx = the compound x retention time, trz = the
retention time of the hydrocarbon standard eluted before the addition of compound x, and trz+1 = the retention time
of the hydrocarbon standard eluted immediately after the addition of compound x.
The results were compared with those in the literature (NIST MS search, 2.0) and are provided in Table 3.
B 100 presented four main FAMEs: 16:0, 18:2, 18:1, and 18:0, and two other compounds, 16:1 and nonanoic acid 9-oxo-methyl ester, were found during the 24 h photodegradation process. In addition to these compounds, ramifications of the ester carbon chain and epoxidation were
Table 2. GC/FID and COD results obtained for the degradation of biodiesela
Sample FAME
b
Total FAME / (mg g-1)
CODc / (g L-1) 16:0 / (mg g-1) 18:0 / (mg g-1) 18:1 / (mg g-1) 18:2 / (mg g-1) 18:3 / (mg g-1)
B 100 150.58 ± 20.585 86.72 ± 7.337 255.81 ± 19.824 309.77 ± 24.112 32.85 ± 2.741 835.73 ± 9.307 –
Exp. 1 161.64 ± 6.214 96.37 ± 1.034 281.78 ± 9.651 337.84 ± 10.618 36.45± 1.082 914.08 ± 4.559 1.197 ± 0.639
Exp. 2 353.03 ± 34.363 210.55 ± 22.019 69.60 ± 6.909 4.10 ± 2.064 NI 637.28 ± 14.718 21.671 ± 2.006
Exp. 3 172.69 ± 58.105 104.00 ± 36.886 26.36 ± 8.658 NI NI 303.05 ± 24.806 20.671 ± 0.550
Exp. 4 154.03 ± 6.331 92.07 ± 3.439 273.04 ± 7.566 318.51 ± 9.934 33.78 ± 1.394 871.43 ± 3.371 1.312 ± 0.423
Exp. 5 140.91 ± 0.741 86.03 ± 2.514 23.40 ± 0.703 0.57 ± 0.589 NI 250.91 ± 1.962 23.353 ± 2.611
Exp. 6 125.07 ± 3.809 70.36 ± 4.358 221.17 ± 6.863 253.58 ± 8.118 26.38 ± 1.579 696.55 ± 2.584 5.024 ± 4.622
Exp. 7 160.51 ± 5.046 94.29 ± 4.429 291.10 ± 11.990 342.25 ± 7.915 35.85 ± 1.458 924.00 ± 3.982 1.233 ± 0.175
Exp. 8 225.85 ± 84.277 138.01 ± 50.769 44.65 ± 16.058 NI NI 408.51 ± 34.111 24.173 ± 1.240
Photolysis 162.08 ± 26.749 100.95 ± 17.344 114.69 ± 20.713 NI NI 377.71 ± 4.765 74.800 ± 17.403
aResults expressed in mg of ester for each gram of biodiesel or organic phase analyzed. Values are means of three replicates accompanied by deviation; bthe symbols represent the main chain of the FAME (fatty acid methyl ester); cchemical oxygen demand: expressed in grams of O
also observed after 96 h; however, the experimental KI values did not match the theoretical values. No KI values were found in the literature for the analysis of this compound using the column used in the present study. Ketones and epoxides have also been found during the thermal degradation of biodiesel,5
and it was observed that saturated FAMEs were not oxidized at high temperatures, with high concentrations remaining
after 360 h. Ketones were observed during the degradation of epoxides, which are produced by the addition of peracids to carbon chain unsaturations. During photodegradation, there was an increase in the amount of saturated esters and a decrease in the amount of unsaturated esters. However, the GC/MS analysis was only qualitative; thus, a quantitative analysis was performed using GC/FID.
Table 3. GC/MS results and Kovats Index (KI) of the biodiesel analyzed during photodegradation with 1.54 mL of Fenton’s reagent, [Fe²+]:[H
2O2] = 0.65, for up to 360 h
Sample Retention time / min No. of C Experimental KI Compound Theoretical KI
Standard 26.97 14 – n-tetradecane 1400
31.03 15 – n-pentadecane 1500
38.58 17 – n-heptadecane 1700
42.09 18 – n-octadecane 1800
48.62 20 – n-eicosane 2000
60.13 24 – n-tetracosane 2400
B 100 46.13 17 1924 hexadecanoic acid, methyl ester 1870-1926
51.36 19 2095 9,12-octadecadienoic acid (Z,Z)-, methyl ester 2092-2098
51.55 19 2102 9-octadecenoic acid, methyl ester 2082-2107
52.33 19 2129 octadecanoic acid, methyl ester 2128-2135
24 h 28.20 10 1430 nonanoic acid, 9-oxo-, methyl ester 1436-1439
46.10 17 1923 hexadecanoic acid, methyl ester 1870-1926
51.31 19 2093 9,12-octadecadienoic acid (Z,Z)-, methyl ester 2092-2098
51.50 19 2100 9-octadecenoic acid (Z,Z)-, methyl ester 2082-2107
51.68 19 2106 10-octadecenoic acid, methyl ester 2100-2110
52.32 19 2129 octadecanoic acid, methyl ester 2128-2135
96 h 28.19 10 1430 nonanoic acid, 9-oxo-, methyl ester 1436-1439
46.13 17 1924 hexadecanoic acid, methyl ester 1870-1926
51.33 19 2094 9,12-octadecadienoic acid (Z,Z)-, methyl ester 2092-2098
51.52 19 2101 9-octadecenoic acid (Z,Z)-, methyl ester 2082-2107
51.72 19 2108 10-octadecenoic acid, methyl ester 2100-2110
52.32 19 2129 octadecanoic acid, methyl ester 2128-2135
56.68 19 2280 octadecanoic acid, 9,10-epoxy-methyl ester 2129
58.71 18 2351 6-hexadecenoic acid, 7-methyl, methyl ester 1963
168 h 28.23 10 1431 nonanoic acid, 9-oxo-, methyl ester 1436-1439
46.10 17 1923 hexadecanoic acid, methyl ester 1870-1926
51.52 19 2101 10-octadecenoic acid, methyl ester 2100-2110
52.33 19 2129 octadecanoic acid, methyl ester 2128-2135
56.69 19 2070 octadecanoic acid, 9,10-epoxy-methyl ester 2129
58.71 57 2088 6-hexadecenoic acid, 7-methyl,methyl ester 1963
360 h 36.98 15 1706 tetradecanoic acid, methyl ester 1675-1725
45.58 17 1907 Hexadecanoic acid, methyl ester 1870-1926
50.97 19 2082 10-octadecenoic acid, methyl ester 2100-2110
51.80 19 2111 octadecanoic acid, methyl ester 2128-2135
Gas chromatography coupled with flame ionization detection (CG/FID)
The FAMEs initially found in B100 were 16:0, 17:0, 18:0, 20:0, 22:0, 24:0, 16:1, 18:1, 18:2, and 18:3, with the main esters being quantified during the photodegradation process after 144 and 360 h. The results are given in Table 4.
FAMEs, particularly the unsaturated FAMEs, were degraded during the photodegradation process. A 1 g sample of B 100 showed 835.73 mg FAMEs. In contrast, there was a total decrease in FAMEs of 51% after 144 h, and only 27% of the initial amount was observed after 360 h. Furthermore, only 16:0 and 18:0 were detected after degradation for 360 h.
¹H NMR
The ¹H NMR spectra exhibited signals for specific types of protons in the ester mixture, as illustrated by the spectrum of B 100 shown in Figure 1.
Some researchers have used ¹H NMR spectra to analyze fatty acid and biodiesel composition by utilizing only the integration value peaks caused by the protons in the fatty acid chains.3,5,18 The peaks that may allow the quantification
of unsaturated FAMEs are those of the protons of olefins (5.3-5.4 ppm), bis-allylic carbons (2.7-2.8 ppm), allylic carbons (2.0-2.1 ppm), and terminal methyl groups (0.8-0.9 ppm). Saturated FAMEs can be determined using the signal for methylene protons, CH2 (1.2-1.4 ppm). The
% FAME values calculated according to Knothe et al.3,18
are given in Table 5.
The peaks of the terminal methyl groups of linolenic methyl esters were not observed after 24 h of irradiation, suggesting that the conjugated double bonds of FAMEs were oxidized during this period. This result is due to the
Table 4. FAMEs quantified by GC/FID for pure biodiesel (B 100) and biodiesel degraded by 1.54 mL of Fenton’s reagent, [Fe²+]:[H
2O2] = 0.65, for 144 h and 360 ha
FAME B 100 / (mg g-1) 144 h / (mg g-1) 360 h / (mg g-1)
16:0 b150.58 ± 20.585 a225.85 ± 84.277 b144.15 ± 3.005
18:0 b86.72 ± 7.337 a138.01 ± 50.769 b84.98 ± 2.520
18:1 a255.81 ± 19.824 b44.65 ± 16.058 –
18:2 a309.77 ± 24.112 – –
18:3 a32.85 ± 2.741 – –
Total a835.73 ± 38.203 b408.51 ± 99.689 c229.13 ± 3.922
aThe results are averages of three replicates followed by the standard deviation. Expressed as mg FAME per 1 g of organic material analyzed. Means followed by the same letter on the same line do not differ significantly (Tukey’s test, p < 0.05).
Figure 1. ¹H NMR spectrum of B 100. The biodiesel was dissolved in CDCl3 at 0.1% v/v TMS (Aldrich, δ = 0.0 ppm).
Table 5. FAME percentages of non-irradiated B 100 and B 100 irradiated for 12 h by 1.54 mL of Fenton’s reagent, [Fe²+]:[H
2O2] = 0.65, analyzed by 1H NMR. The samples were dissolved in CDCl
3
Sample FAMEs / %
C16:0 C18:0 C18:1 C18:2 C18:3
B 100 7.59 46.25 31.36 9.35 5.45
proximity of the C15-C16 double bond in linolenic methyl esters to the terminal CH3; the signal of the terminal CH3
is thus shifted downfield to approximately 0.95 ppm and can be integrated separately from the signal of the terminal CH3 in the other fatty acid chains.18 As peaks for olefinic,
allylic, and bis-allylic carbon protons were not observed after 120 h of irradiation, the fatty acid unsaturations had been oxidized during this time period (Figure 2).
An increase in viscosity and darkening of the color of the degraded biodiesel was observed, most likely due to the oxidation of unsaturations. The signal of the beta group (–CH2–CH2–COOCH3) at δ 1.6 ppm showed
some broadening during the photodegradation process, which may be due to the oxidation of unsaturations and consequent overlapping of CH2 group signals.
Oxitest
The Oxitest equipment analyzes the induction time of organic matter, which is the time needed to oxidize organic matter in an oxygen-rich atmosphere, a process that depends on the nature and amount of fatty acids in the biodiesel sample. Biodiesel free of antioxidants has an induction time of approximately 2 h,25 and the
investigated biodiesel was considered to be free of antioxidants because it showed an induction time of 2:44 h. After irradiation of the samples with Fenton’s
reagent for 6 h, the induction time decreased to 29 min, and the samples were completely oxidized in under 24 h of photodegradation.
Chemical oxygen demand (COD)
The aqueous-phase COD increased during up to 120 h of photodegradation with 3.0 mL of Fenton’s reagent ([Fe2+]:[H
2O2] = 0.65, with 10.4 × 10⁻³ mol L-1
[Fe2+] and 15.6 × 10⁻³ mol L-1 [H
2O2]) in different Petri
dishes (Figure 3). This increase may be attributed to an increase in the amount of organic matter in the water from photoproducts transferred from the organic phase to the aqueous phase. After this time, the COD decreased progressively up to 360 h of photodegradation and apparently reached equilibrium, with the migration of the photoproducts to the aqueous phase, following oxidation by Fenton’s reagent in the presence of light. However, the COD was not completely reduced because the organic matter resulting from the degradation of biodiesel continues to migrate to the aqueous phase until the biodiesel film on the water surface has been completely degraded.
Toxicity test with Artemia salina L.
There was an increase in the mortality rate of
A. salina L. during photodegradation, reaching a maximum
Figure 2. ¹H NMR spectra of non-irradiated B 100 and B 100 irradiated with 1.54 mL of Fenton’s reagent, [Fe²+]:[H
between 120 and 168 h, though we observed a slight decrease in mortality at 360 h for the most diluted aliquots (1%). The aqueous-phase samples with a concentration greater than 20% presented 100% mortality for all the photodegradation times investigated, indicating that the biodiesel products were either transferred or transformed during photodegradation. The experimental results of the
A. salina L. assays are provided in Figure 4.
By comparing the results of the acute toxicity results of COD (Figure 3), it is clear that recalcitrant components were formed, reaching higher concentrations between 120 h and 168 h of photodegradation. After 168 h, there was a decrease in these recalcitrant compounds due to the action of the photo-Fenton system, thereby decreasing the mortality of the microcrustaceans.
Biodegradation refers to the process by which organisms use organic contaminants as a food or energy source. However, recalcitrant compounds are not degraded by microorganisms; thus, the action of a chemical agent is very important, as noted in the work of Garcia et al.22 in
which the action of advanced oxidation processes (AOP) decreased the toxicity of an effluent to A. salina L.
A study of the biodegradability of biodiesel in soil found 84% biodegradation of B 100 after 60 days.26 This
same study also reported respirometer tests and the analysis of microorganism DNA, concluding that, although B 100 can be more rapidly degraded than diesel fuel, there was a decrease in the microbial community of soil contaminated with B 100 after 60 days. This finding indicates that some products of biodiesel photodegradation can be toxic to organisms.
Because there was no mortality with the aqueous phase in contact with biodiesel not degraded after 24 h, the toxic effects of photodegradation can be attributed to the biodiesel intermediates that migrated to the aqueous phase.
Fluorescence spectroscopy
Synchronous scan excitation spectra were obtained by measuring the fluorescence intensity simultaneously with excitation and emission at a certain wavelength using a constant optimized by the difference of the wavelengths, as follows: ∆λ = λ
em – λexc.27 The synchronous scan
excitation spectra of the undiluted organic phase are shown in Figure 5.
Prior to photodegradation, the biodiesel presented bands between 340 and 363 nm and close to 520 nm. However, only one band, between 380 and 400 nm, was observed after 24 h of photodegradation, and this band became less intense at 72 h; no fluorescence signal was observed at 120 h. The chromophore compounds that may be present in biodiesel, such as FAME molecules with double conjugated bonds, are oxidized during the photodegradation process, eliminating
Figure 3. Chemical oxygen demand of the aqueous phase under irradiation for 360 h with 3.0 mL of Fenton’s reagent: [Fe2+]:[H
2O2] = 0.65.
Figure 4. Percent mortality rate of A. salina L. in aliquots of aqueous phases irradiated for 360 h with 1.54 mL of Fenton’s reagent, [Fe²+]:[H
2O2] = 0.65. The aqueous phase was diluted with a saline mixture (v/v): (--) 1%; (--) 10%; (--) 20%.
Figure 5. Synchronous fluorescence spectra of (a) biodiesel B 100 and biodiesel with 1.54 mL of Fenton’s reagent, [Fe²+]:[H
Figure 6. UV-region spectrophotometry of the aqueous phase (--) λ = 226 nm (aqueous phase: distilled water dilution rate, 1:1000). UV-region spectrophotometry of the organic phase (--) λ = 205 and (--) λ = 228 nm (organic phase: ethanol dilution rate, 1:1000). For degradation of 1 mL of biodiesel, 1.54 mL of Fenton’s reagent were used, [Fe²+]:[H
2O2] = 0.65.
the fluorescence. Although the aqueous-phase aliquots were scanned, the salts previously added to interrupt the Fenton reaction interfered with the measurements.
UV/Vis photometry
During the photodegradation process, the biodiesel photoproducts are transferred to water, which increases absorption in the UV region. As the aqueous phase had a maximum absorbance at 226 nm, the absorbance was monitored at this wavelength for various photodegradation times, as shown in Figure 6. The absorbance was at a maximum after 120 h of irradiation, decreasing thereafter and reaching a minimum at 360 h, most likely because the photoproducts were transferred to water and continued to be subjected to the action of Fenton’s reagent and irradiation. Two maximum absorbance wavelengths were observed for biodiesel in the UV region, at 205 and 228 nm. During irradiation, the absorbance at 205 nm decreased and reached a minimum after 360 h of photodegradation. An increase in absorbance was also observed at 228 nm during the first 24 h, followed by a decrease in this region up to 360 h.
Conclusions
The best degradation conditions for 1 mL of biodiesel using Fenton’s reagent were [Fe²+]:[H
2O2] = 0.65, with the
addition of 1.54 mL of a mixture of sulfate heptahydrate with concentrations of [Fe2+] = 5.34 × 10⁻³ mol L-1 and
[H2O2] = 8.05 × 10⁻³ mol L-1 under irradiation. Under these
conditions, the FAME concentrations were the smallest in the organic phase, and COD was smaller in the aqueous phase than in the non-irradiated samples and the samples irradiated without the addition of Fenton’s reagent. After 360 h, a 73% decrease in total FAMEs was found, with only 18:0 and 16:0, the most persistent FAMEs, being quantified by GC/FID. Peaks for ketone and carbon chain epoxide groups were observed during photodegradation according to GC/MS analyses, as were typical aldehyde and short-chain fatty acid shifts according to 1H NMR
analyses. Ecotoxicity analyses with Artemia salina revealed toxic components in the aqueous phase, which increased up to 168 h of photodegradation and decreased thereafter.
Supplementary Information
Supplementary data are available free of charge at http://jbcs.sbq.org.br as PDF file.
Acknowledgements
The authors would like to thank Coordenação de Aperfeiçoamento de Pessoal de Nível Superior (CAPES) and Conselho Nacional de Desenvolvimento Científico e Tecnológico (CNPq) and Fundação Araucária for research funds.
References
1. http://www.biodieselbr.com/noticias/usinas/acidente/caminhao-biodiesel-tomba-contamina-lago-palmas-190111.htm accessed in January 2014.
2. Dunn, R. O.; J. Am. Oil. Chem. Soc.2002, 79, 915. 3. Knothe, G.; Eur. J. Lipid. Sci. Technol. 2006, 108, 493. 4. Knothe, G.; Fuel Process. Technol.2007, 88, 669.
5. Chuck, C. J.; Bannister, C. D.; Jenkins, R. W.; Lowe, J. P.; Davidson, M. G.; Fuel2012, 96, 426.
6. Aquino, I. P.; Hernandez, R. P. B.; Chicoma, D. L.; Pinto, H. P. F.; Aoki, I. V.; Fuel2012, 102, 795.
7. Sarika, R.; Kalogerakis, N.; Mantzavinos, D.; Environ. Int.
2005, 31, 297.
8. Ginos, A.; Manios, T.; Mantzavinos, D.; J. Hazard. Mater.2006,
B133, 135.
9. Filidei, S.; Masciandaro, G.; Ceccanti, B.; Water Air Soil Pollut.
2003, 145, 79.
10. Sabbah, I.; Marsook, T.; Basheer, S.; Process Biochem.2004,
39, 1947.
11. Ramírez, X. M. V.; Mejía, G. M. H.; López, K. V. P.; Vásquez, G. R.; Sepúlveda, J. M. M.; Water Sci. Technol.2012, 66, 824. 12. Nogueira, R. F. P.; Trovó, A. G.; Silva, M. R. A.; Villa, R. D.;
13. Galvão, S. A. O.; Mota, A. L. N.; Silva, D. N.; Moraes, J. E. F.;
Sci. Total Environ.2006, 367, 42.
14. Silva, M. R. A.; Oliveira, M. C.; Nogueira, R. F. P.; Eclet. Quim.
2004, 29, 19.
15. Dool, H. V. D.; Kratz, D. J.; J. Chromatogr.1963, 11, 463. 16. Joseph, J. D.; Ackman, R. G.; J. AOAC Int.1992, 75, 488. 17. Visentainer, J. V.; Quim. Nova2012, 35, 274.
18. Knothe, G.; Kenar, J. A.; Eur. J. Lipid Sci. Technol.2004, 106, 88.
19. Greenberg, A. E.; Clesceri, L. S.; Eaton, A. D. In Standard Methods for the Examination of Water and Wastewater, 8th ed.;
Greenberg, A. E.; Clesceri, L. S.; Eaton, A. D., eds.; APHA: Washington, D. C., 1992, ch. 5.1.
20. Nogueira, R. F. P.; Oliveira, M. C.; Paterlini, W. C.; Talanta 2005, 66, 86.
21. Meyer, B. N.; Ferrigini, N. R.; Putnan, J. E.; Jacobsen, L. B.; Nichols, D. E.; McLaughlin, J. L.; Planta Med. 1982, 45, 31.
22. Garcia, J. C.; Freitas, T. K. F. S.; Palácio, S. M.; Ambrosio, E.; Souza, M. T. F.; Santos, L. B.; Almeida, V. C.; de Souza, N. E.;
Environ. Monit. Assess. 2013, 185, 2179.
23. D’Auria, M.; Emanuele, L.; Racioppi, R.; Velluzzi, V.;
J. Photochem. Photobiol. A2008, 198, 156.
24. Gracetto, A. C.; Batistela, V. R.; Caetano, W.; de Oliveira, H. P. M.; Santos, W. G.; Cavalheiro, C. C. S.; Hioka, N.; J. Braz. Chem. Soc.2010, 21, 1497.
25. Araújo, F. D. S.; de Moura, C. V. R.; Chaves, M. H.; Quim. Nova2010, 33, 1671.
26. Silva, G. S.; Marques, E. L. S.; Dias, J. C. T.; Lobo, I. P.; Gross, E.; Brendel, M.; da Cruz, R. S.; Rezende, R. P.; Appl. Soil Ecol.2012, 55, 27.
27. Miano, T. M.; Senesi, N.; Sci. Total Environ.1992, 117/118, 41.
Submitted: October 10, 2013
Supplementary Information
Printed in Brazil - ©2014 Sociedade Brasileira de Química0103 - 5053 $6.00+0.00S
I
*e-mail: [email protected]
Study of Biodiesel Photodegradation Through Reactions
Catalyzed by Fenton’s Reagent
Elizangela Ambrosio, Lorena M. Milano, Maísa Tatiane F. de Souza, Lucas U. R. Chiavelli, Paula F. Montanher, Jesuí V. Visentainer,
Vitor de C. Almeida, Nilson E. Souza* and Juliana C. Garcia
Departamento de Química, Universidade Estadual de Maringá, Av. Colombo, 5790, 87020-900 Maringá-PR, Brazil
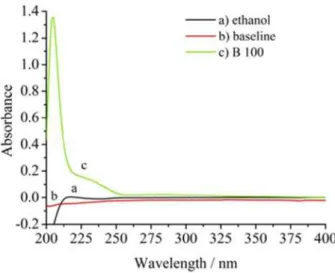
The absorbance spectrum for ethanol compared with the absorbance spectrum of biodiesel is shown in Figure S1.
It is possible to use ethanol as solvent for the organic phase as it does not interfere with their absorbance spectra. Figure S2 shows the absorption spectra for the organic phase and the aqueous phase which have undergone the action of Fenton’s reagent and light at various periods of time.
Figure S1. UV-region spectrophotometry of the biodiesel (ethanol dilution rate, 1:1000) (); ethanol (99.3%, FMaia) (); and baseline ().
Figure S2. Absorbance spectra of: a) organic phase and b) the aqueous phase irradiated for 360 h using Fenton’s reagent: () distilled water (baseline), () ethanol (baseline), () biodiesel undegraded, () 24 h, () 72 h, () 120 h, ()168 h, () 360 h. Aqueous phase was diluted with distilled water, 1:1000 and the organic layer diluted with ethanol, 1:10000. For degradation of 1 mL biodiesel, Fenton’s reagent was used [Fe²+]:[H2O2] = 0.65, 1.54 mL was added to a mixture of ferrous sulfate heptahydrate concentration of [Fe2+] = 5.34
× 10-3 mol L-1 and [H2O2] =
Figure S3. GC/MS chromatogram of B 100 dissolved in dichloromethane.
Figure S5. GC/MS chromatogram of degraded biodiesel by photo-Fenton ([Fe²+]:[H2O2] = 0.65, 1.54 mL) for 96 h, dissolved in dichloromethane.
Figure S7. GC/MS chromatogram of degraded biodiesel by photo-Fenton ([Fe²+]:[H2O2] = 0.65, 1.54 mL) for 360 h, dissolved in dichloromethane.

![Table 3. GC/MS results and Kovats Index (KI) of the biodiesel analyzed during photodegradation with 1.54 mL of Fenton’s reagent, [Fe² + ]:[H 2 O 2 ] = 0.65, for up to 360 h](https://thumb-eu.123doks.com/thumbv2/123dok_br/18998579.462986/6.892.65.799.165.949/table-results-kovats-biodiesel-analyzed-photodegradation-fenton-reagent.webp)
![Table 5. FAME percentages of non-irradiated B 100 and B 100 irradiated for 12 h by 1.54 mL of Fenton’s reagent, [Fe² + ]:[H 2 O 2 ] = 0.65, analyzed by 1 H NMR](https://thumb-eu.123doks.com/thumbv2/123dok_br/18998579.462986/7.892.115.799.717.1086/table-fame-percentages-irradiated-irradiated-fenton-reagent-analyzed.webp)
![Figure 2. ¹H NMR spectra of non-irradiated B 100 and B 100 irradiated with 1.54 mL of Fenton’s reagent, [Fe² + ]:[H 2 O 2 ] = 0.65, for up to 120 h](https://thumb-eu.123doks.com/thumbv2/123dok_br/18998579.462986/8.892.103.749.111.529/figure-nmr-spectra-non-irradiated-irradiated-fenton-reagent.webp)
![Figure 3. Chemical oxygen demand of the aqueous phase under irradiation for 360 h with 3.0 mL of Fenton’s reagent: [Fe 2+ ]:[H 2 O 2 ] = 0.65](https://thumb-eu.123doks.com/thumbv2/123dok_br/18998579.462986/9.892.96.438.114.285/figure-chemical-oxygen-demand-aqueous-irradiation-fenton-reagent.webp)

![Figure S4. GC/MS chromatogram of degraded biodiesel by photo-Fenton ([Fe²+]:[H 2 O 2 ] = 0.65, 1.54 mL) for 24 h, dissolved in dichloromethane.](https://thumb-eu.123doks.com/thumbv2/123dok_br/18998579.462986/13.892.66.805.512.948/figure-chromatogram-degraded-biodiesel-photo-fenton-dissolved-dichloromethane.webp)
![Figure S5. GC/MS chromatogram of degraded biodiesel by photo-Fenton ([Fe²+]:[H 2 O 2 ] = 0.65, 1.54 mL) for 96 h, dissolved in dichloromethane.](https://thumb-eu.123doks.com/thumbv2/123dok_br/18998579.462986/14.892.93.826.111.445/figure-chromatogram-degraded-biodiesel-photo-fenton-dissolved-dichloromethane.webp)
