Short Report
J. Braz. Chem. Soc., Vol. 19, No. 7, 1429-1432, 2008. Printed in Brazil - ©2008 Sociedade Brasileira de Química 0103 - 5053 $6.00+0.00*e-mail: [email protected]
Determination of Oleanolic and Ursolic Acids in Different Parts of
Perilla frutescens
by High-Performance Liquid Chromatography
Shengqin Zou* and Wu Chen
Key Laboratory of Jiangxi Province for Research on Active Ingredients in Natural Medicines, Bioengineering Research Institute of Yichun University, Yichun University,Yichun 336000, P. R. China
APerilla frutescens (L.) Britt.(Lamiaceae) é uma planta famosa usada na medicina tradicional chinesa para o tratamento de diversas doenças. A fim de avaliar a qualidade da P. frutescens de forma simples, rápida e precisa foi desenvolvido um método de cromatografia líquida de alta performance (CLAE) para caracterização dos dois ácidos triterpenos bioativos: o ácido oleanólico (OA) e o ácido ursólico (UA). Foi usada uma coluna Kromasil 100 C18 RP, com metanol e solução de ácido fosfórico (H3PO4) como fase móvel e detecção a 210 nm. O método foi preciso, com um desvio-padrão relativo para esses dois componentes variando entre 0,3-0,6% (análises feitas no mesmo dia) e 0,6-1,2% (análises em dias diferentes). As quantidades de OA e UA na P. frutescens foram determinados por recuperação, variando de 96,7 a 102,0%. Os teores desses dois fitoquímicos encontrados em diferentes partes da P. frutescens cultivada em cinco locais da China, foram determinados para verificar a eficácia do método.
Perilla frutescens (L.) Britt.(Lamiaceae), a famous traditional Chinese medicine, has been used for the treatment of various diseases. To evaluate the quality of P. frutescens, a simple, rapid and accurate high-performance liquid chromatography (HPLC) method was developed for the assessment of two bioactive triterpene acids: oleanolic acid (OA) and ursolic acid (UA). The HPLC system used an Kromasil 100 C18 RP column with methanol and aqueous H3PO4 as the mobile phase and detection at 210 nm. The method was precise with relative standard deviations for these two constituents that ranged between 0.3-0.6 % (intraday) and 0.6-1.2 % (interday). The contents of the OA and UA in P. frutescens were determined with recoveries ranging from 96.7 to 102.0%. The content of these two phytochemicals in different parts of P. frutescens growing at five different locations of China were determined to establish the effectiveness of the method.
Keywords:Perilla frutescens, Lamiaceae, HPLC, oleanolic acid, ursolic acid
Introduction
Perilla frutescens (L.) Britt. (Lamiaceae) is known as the wild/weedy form, which is found in China, Korea and Japan. It is used as a spicy vegetable and as an oil crop.1
P. frutescens, which is a traditional Chinese medicinal herb, has been used in China for centuries to treat various diseases including depression, anxiety, tumor, cough, bacterial and fungal infections, allergy, intoxication and some intestinal disorders.2-5 It has been reported that
triterpenoid compounds isolated from the leaves of P. frutescens, the two main bioactive constituents were identified spectroscopically and chemically as oleanolic acid (OA) and ursolic acid (UA) (Figure 1).6,7 OA and
UA were both reported to have the anti-inflammatory
activity.8,9 Furthermore, OA possesses anti-ulcer10 and
hepatoprotective activities,11 and UA exerts its anti-tumor
action through enhancing the production of both nitric oxide and tumor necrosis factor- .12 Needless to say, a
sufficiently high content of the bioactive phytochemicals is crucial for therapeutic effect.
Like most plant extracts composed of complex phytochemical constituents, proper method is particularly
Determination of Oleanolic and Ursolic Acids in Different Parts of Perilla frutescens J. Braz. Chem. Soc.
1430
desired for the quality control of the extract of the title plant as well as that of pharmaceutical and/or nutraceutical products made therefrom. As no method is available to date for the co-quantification of these two bioactive triterpene acids, we developed an accurate high-performance liquid chromatography (HPLC) method for the quality assessment ofP. frutescens. The contents of these two constituents in different parts of the plant collected from five geographically different areas of China has been determined to demonstrate the robustness of the established method.
Experimental
Materials and chemicals
A total of five sets of plant materials of P. frutescens was harvested in 2006 from Jiangxi, Guizhou, Hebei, Fujian and Sichuan provinces of China, respectively. All materials were sorted and identified by Professor W. Chen with voucher specimens (YCU-ZS060901—YCU-ZS060905) deposited in the Herbarium of Yichun University, Yichun 336000, China.
OA and UA were purchased from National Institute for the Control of Pharmaceutical and Biological Products (Beijing, China). methanol (HPLC grade) was purchased from Luzhong Regent Factory of Shanghai (Shanghai, China). Ultrapure water with resistivity greater than 18 M was collected from a certified UPWS-I-T system (Hangzhou, China). All the other chemicals used in the study were of analytical grade.
Liquid chromatography conditions
The HPLC system consisted of a Waters Alliance (Waters Corporation, MA, USA) equipped with a Waters 515 pump and a Waters 2996 photodiode array detector. Data acquisition was performed by the Empower software operated on a Pentium® IV microprocessor. Analysis was
carried out at 210 nm with a Kromasil 100 C18 reversed-phase column of 250 mm × 4.6 mm i.d., 5 µm dimensions (VDS Optilab, Chromatographie technik GmbH, Germany). The column temperature was kept at 25 °Cand the injection volume was 20 µL. Satisfactory separation was obtained with a mobile phase of methanol: 0.5% aqueous H3PO4(88:12, v/v) at a rate of 0.8 mL min-1.
Preparation of standard solution
To prepare standard solutions, an accurately weighed amount of the OA and UA standards (8.20 and 16.62 mg, respectively) were dissolved in methanol (25 mL) yielding
concentrations of 16.40; 32.80; 65.60; 131.2 and 328.0 µg mL-1
for OA and 33.24; 66.48; 132.96; 265.9 and 664.8 µg mL-1 for
UA. The solutions were filtered through a 0.45 µm membrane. Evaluation of each point was repeated 3 times and the calibration curve was fitted by linear regression.
Preparation of sample solution
The air-dried leaf, aerial part, stem and root of P. frutescens(1 g) were separately pulverized and ultrasonic extracted thrice with methanol (each 30 min). The extracts with each set were combined and filtered while hot. The filtrate was concentrated to a tarry lump, which was dissolved in 10 mL of methanol. The afforded solution was filtered through a 0.45 µm syringe filter prior to HPLC.
Preparation of recovery studies
The sample preparation was evaluated by the percentage of recovery of the bioactive markers added to the sample of P. frutescens leaf before extraction. Appropriate amounts of OA and UA were added to approximately the double contents of those acids in treated materials. The follow-up extractions and HPLC analyses were accomplished in the same manner as detailed above. The recovery was determined as follows:
Recovery(%)= (A-B)/ C×100
where A is the amount detected after addition of substance, B is the amount detected without addition and C is the amount added.
Results and Discussion
The analytical method described above was used to analyze P. frutescens. This method was validated for its specificity, linearity, precision, accuracy and limit of detection with the following results.
The retention times and ultraviolet (UV) absorption spectra of the eluted peaks from the samples were compared with those obtained from the standards. The retention times and the UV spectra of the eluted bioactive markers from the samples agreed well with those of the standards, indicating the identity and purity of the peaks eluted from the samples. Therefore, the specificity of the method was validated.
Zou and Chen 1431 Vol. 19, No. 7, 2008
Calibration graphs were constructed in the range 16.40-328.0 µg mL-1 for OA, and 33.24-664.8 µg mL-1
for UA. The regression equations of these curves and their coefficients of determination (r2) were calculated as
follows: OA, y = 1.1622×10⁶x + 1.6129×10⁴ (r2 = 0.9992);
UA, y = 1.2769×10⁶x + 1.1865×10⁴ (r2 = 0.9996). The
method showed a linear relationship between peak areas and concentrations over this range for all two compounds. A signal three times higher than the noise was regarded as the detection limit. Accordingly the detection limits of these constituents were: 0.42, 0.39 µg mL-1 for OA and
UA, respectively.
To assess the precision of the method, we injected standard solutions of OA and UA, respectively, six times on the same day and over a 6-day period. The coefficient variation of intraday and interday studies were both less than 2.0% (Table 1). The precision as well as repetivity of this method was satisfactory. The results of the recoveries of OA and UA ranged from 96.7 to 102.0%. The relative standard deviations (RSD) of recoveries of two constituents were 2.1 and 1.1%, respectively (Table 2).
When the sample solution was analyzed in the same manner, the peaks were identified by comparison of the retention time and UV spectrum with those corresponding to the standards. Regarding the extraction efficiency, one time work-up was sufficient since it allowed an over 98% extraction of the two constituents.
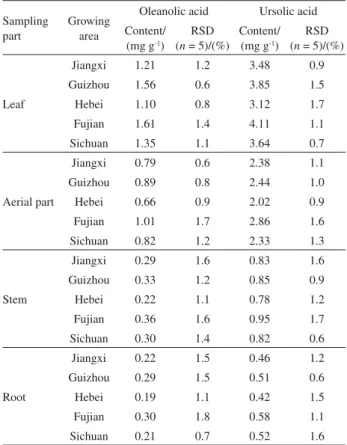
The content of the two constituents in different parts ofP. frutecens growing in different locations was also analyzed demonstrating that all of these phytochemicals in the title plant are strikingly dependent of the sampling
Table 2. Recovery of OA and UA
Bioactive markers
Amount added/ (µg mL-1)
Amount found/ (µg mL-1)
Recovery/ (n= 5) (%)
OA
75.0 76.48 102.0
75.0 73.01 97.3
75.0 73.99 98.7
75.0 73.47 98.0
75.0 72.53 96.7
UA
210.0 212.57 101.2
210.0 211.45 100.7
210.0 213.96 101.9
210.0 207.92 99.0
210.0 209.51 99.8
Mean RSD: 2.1 for OA, 1.1 for UA.
Table 3. The mean contents of two constituents in P. frutescens from five different locations of China
Sampling part
Growing area
Oleanolic acid Ursolic acid Content/
(mg g-1) RSD (n = 5)/(%)
Content/ (mg g-1)
RSD (n = 5)/(%)
Leaf
Jiangxi 1.21 1.2 3.48 0.9
Guizhou 1.56 0.6 3.85 1.5
Hebei 1.10 0.8 3.12 1.7
Fujian 1.61 1.4 4.11 1.1
Sichuan 1.35 1.1 3.64 0.7
Aerial part
Jiangxi 0.79 0.6 2.38 1.1
Guizhou 0.89 0.8 2.44 1.0
Hebei 0.66 0.9 2.02 0.9
Fujian 1.01 1.7 2.86 1.6
Sichuan 0.82 1.2 2.33 1.3
Stem
Jiangxi 0.29 1.6 0.83 1.6
Guizhou 0.33 1.2 0.85 0.9
Hebei 0.22 1.1 0.78 1.2
Fujian 0.36 1.6 0.95 1.7
Sichuan 0.30 1.4 0.82 0.6
Root
Jiangxi 0.22 1.5 0.46 1.2
Guizhou 0.29 1.5 0.51 0.6
Hebei 0.19 1.1 0.42 1.5
Fujian 0.30 1.8 0.58 1.1
Sichuan 0.21 0.7 0.52 1.6
Figure 2. Chromatogram of standards (A) and methanol extract of
P. frutecens (B).
Table 1. Intra-and inter-day precision for determination of OA and UA
Bioactive markers
Concentration/ (µg mL-1)
RSD/(%)
Intraday (n= 6) Interday (n= 6)
OA 65.60 0.6 0.9
131.2 0.3 1.0
UA 132.8 0.6 1.2
Determination of Oleanolic and Ursolic Acids in Different Parts of Perilla frutescens J. Braz. Chem. Soc.
1432
part and locality (Table 3). The content was determined as follows:
Content (mg g-1) = ( × V)/(1000 × m)
Where (µg mL-1) is the concentration of UA in sample
solutions,V(mL) is the volume of sample solutions and m(g) is the mass of samples.
Conclusions
In conclusion, the newly established HPLC method is validated for the quantification of the main bioactive triterpenes OA, and UA, and the quality control of the plant materials such as P. frutecens where the triterpene(s) is (are) the dominant phytochemical(s). This method is rapid, precise, reproducible, sample-saving, and maybe helpful for the quantitative analysis of phytochemicals analogous to the triterpenes.
Acknowledgments
This work was supported by the Hi Tech Research and Development Program of China (863 Program) (grant No. 2002AA2Z3217).
References
1. Nitta, M.; Kobayashi, H.; Ohnishi-Kameyama, M.; Nagamine, T.; Biochem. Syst. Ecol.2006,34, 25.
2. Lee, K. N.; Shin, H. H.; Han, D. S.; Kim, Y. O.; Choi, K. E.; Kwag, J. S.; Back, S. H.; Korean J. Pharmacogn.1997,28, 264.
3. Takeda, H.; Tsuji, M.; Matumiya, T.; Kubo, M.; Jpn. J. Psychopharmacol.2002,22, 15.
4. Liu, J. H.; Steigel, Reininger, A. E.; Bauer, R.; J. Nat. Prod.
2000,63, 403.
5. Nakamura, Y.; Ohto, Y.; Murakami, A.; Ohigashi, H.; J. Agric. Food Chem.1998,46, 4545.
6. Banno, N.; Akihisa, T.; Tokuda, H.; Yasukawa, K.; Higashihara, H.; Ukiya, M.; Watanabe, K.; Kimura, Y.; Hasegawa, J.; Nishino, H.;Biosci., Biotechnol., Biochem.2004,68, 85. 7. Fujita, T.; Funayoshi, A.; Nakayama, M.; Phytochemistry1994,
37, 543.
8. Nadinic, E.; Gorzalczany, S.; Rojo, A.; Baren, C. V.; Fototerapia
1999,70, 166.
9. Alvarez, M. E.; Rotelli, A. E.; Pelzer, L. E.; Saad, J. R.; Giordano O.;Il Farmaco2000,55, 502.
10. Farina, C.; Pinza, M.; Pifferi, G.; Il Farmaco1998,53, 22. 11. Jeong, H. G.; Toxicol. Lett.1999,105, 215.
12. You, H. Y.; Choi, C. Y.; Kim, J. Y.; Park, S. J.; Hahm, K. S.; Jeong, H. G.; FEBS Lett.2001,509, 156.
Received: May 1, 2008