*Correspondence: Wenjie Zhang. School of Pharmacy. Liaoning University of Traditional Chinese Medicine. 77 Shengming 1 Road, DD Port - 116600 - Dalian, China. E-mail: [email protected]
A
vol. 51, n. 3, jul./sep., 2015 http://dx.doi.org/10.1590/S1984-82502015000300016
Tissue distribution and excretion of the five components of
Portulaca oleracea
L. extract in rat assessed by UHPLC
Wenjie Zhang
1,*, Di Li
1, Aijing Leng
2, Junjun Ai
1, Yang Du
2, Yihan Meng
1, Yucong Gao
1,
Xixiang Ying
11School of Pharmacy, Liaoning University of Traditional Chinese Medicine, Dalian, China, 2First Ailiated Hospital of Dalian Medical University, Dalian, China
The aim of the present study was to investigate the tissue distribution and excretion of ive components of Portulaca oleracea L. extract (POE) in rat following oral administration. A rapid, sensitive and speciic
ultra-high performance liquid chromatography (UHPLC) method with puerarin as the internal standard was used for the quantitative analysis of ive components of POE, including cafeic acid (CA), p-coumaric acid (p-CA), ferulic acid (FA), quercitrin (QUER) and hesperidin (HP) in rat tissues including the liver, intestine, stomach, muscle, heart, lung, brain, kidney and spleen, urine and feces. The results show that only p-CA and FA were found in nearly all tissues with low cumulative ratios, and CA was higher in the intestine and stomach with a slightly higher cumulative ratio in the urine and feces after 24 h. HP and QUER were found at low levels in the tissues with low cumulative ratios.
Uniterms: Portulaca oleracea L./pharmacokinetics. Portulaca oleracea L./extract/experimental study.
Portulaca oleracea L./extract/ tissue distribution. Portulaca oleracea L./extrato/excretion. Compostos fenólicos. Ultra performance liquid chromatography/quantitative analysis.
O objetivo do presente estudo foi investigar a distribuição tecidual e excreção de cinco componentes de extrato Portulaca oleracea L. (POE) em ratos após administração oral. Um método analítico rápido, sensível e especíico para quantiicação de cinco componentes de POE (ácido cafeico (CA), ácido p-cumárico (p-CA), ácido ferúlico (FA), quercitrina (QUER) e hesperidina (HP)) por cromatograia líquida de ultra eiciência (UHPLC), empregando puerarina como padrão interno de referência. Os compostos foram quantiicados em diferentes tecidos dos animais, sendo eles fígado, intestino, estômago, músculo, coração, pulmão, cérebro, rim e baço, urina e fezes. Os resultados mostraram que apenas p-CA e FA foram encontradas em todos os tecidos com baixas taxas cumulativas e CA apresentou níveis mais altos no intestino e estômago com a taxa cumulativa um pouco mais elevada na urina e nas fezes após 24 h. HP e QUER apresentaram baixas concentrações nos tecidos com baixas taxas cumulativas.
Uniterms: Portulaca oleracea L./farmacocinética. Portulaca oleracea L./extrato/estudo experimental.
Portulaca oleracea L./extrato/distribuição tecidual. Portulaca oleracea L./extrato/excreção. Compostos fenólicos. Cromatograia líquida de ultra eiciência/análise quantitativa.
INTRODUCTION
Portulaca oleracea L. is a well-known traditional Chinese medicine and is recorded in the Chinese pharmacopoeia (PRC, 2010). It has historically been used for removing heat, counteracting toxicity, cooling the blood, hemostasis and treating dysentery. As P. oleracea
L. is also a widespread and abundant plant in the world,
much attention has been paid to its pharmacological study, such as its anti-inflammatory and anti-pruritic (Lim et al., 2011), hypocholesterolemic(Movahedian, Ghannadi, Vashimia, 2007) and hypoglycemic(Gong et al., 2009) effects. Some reports have focused on in vitro and in vivo analyses of the components in P. oleracea L. extract
(POE) i.e., lavonoids, by capillary electrophoresis with
electrochemical detection (Xu, Yu, Chen, 2006), and four compounds of POE have been detected in rat plasma by HPLC after intravenous administration of P. oleracea
Therefore, a rapid, sensitive and speciic UHPLC method
with an internal standard was established to evaluate the
tissue distribution and excretion of ive components of
Portulaca oleracea L. extract (POE), including cafeic
acid (CA), p-coumaric acid (p-CA), ferulic acid (FA), quercitrin (QUER) and hesperidin (HP), after oral
administration in rats, which will ill in some of the gaps
in our overall knowledge of POE.
MATERIAL AND METHODS
Plant material
Portulaca oleracea L. was collected from the
collection site with the geographical coordinates 37°27′-38°47′ N, 113°30′-115°20′ E (Anguo, Hebei, China) in September 2013, and identiied by Prof. Yanjun Zhai. A voucher specimen (No. 20130925) was deposited at the
School of Pharmacy, Liaoning University of Traditional Chinese Medicine.
Reagents and chemicals
Puerarin as the internal standard (IS) and QUER
were purchased from the National Institute for the Control
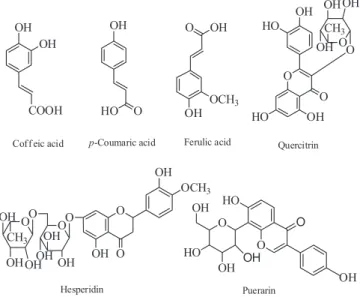
of Pharmaceutical and Biological Products (Beijing, China), and CA, p-CA, FA and HP were obtained from Sichuan Weikeqi Biological Technology Co., Ltd (Chengdu, China). Figure 1 illustrates the chemical
structures of the ive investigated components and the IS.
Methanol and acetonitrile were of HPLC grade provided by Damao Chemical Reagent Plant (Tianjin, China).
Puriied water was obtained from Wahaha Group Ltd., Co.
(Shenyang, China). All other reagents were of analytical grade purchased from Jinfeng Chemical Factory (Tianjin, China).
Chromatographic system and conditions
The analysis was performed on a NEXERAX2
UHPLC LC-30A system (Japan, Shimadzu) was equipped with a solvent delivery pump (LC-30AD), a vacuum degasser (DGU-20A), a Shimadzu UV-is spectrophotometric detector (SPD-20A) and LabStation software (Shimadzu). The analytes were determined on an analytical shim-pack ODS column (75mm × 2 mm, 1.6 µm particle size, Shimadzu, Japan) at a column temperature
of 40ºC incorporating a UV detector at a low rate of 0.3
mL/min with the detection wavelength set at 320 nm. The mobile phase consisted of phase A (acetonitrile) and B (0.1% acetic acid aqueous) in a gradient elution: 8% A within 0-2 min, 16% A within 2-4 min, 17% A within 4-6 min, 25% A within 6-7 min, 45% A within 7-10 min and then returned to initial condition for a 10 min re-equilibration, with a total run time of 20 min. The mobile
phase was passed under vacuum through a 0.22 μm ilter
membrane and degassed by exposure to ultrasonic waves before use.
Animals
Male Wistar rats (body weight 300 ± 20 g) were provided by the Laboratory Animal Center of Dalian University (Dalian China). All rats were kept in a controlled environment for a week and had free access to standard laboratory food and water intake before the experiments. The rats were fasted overnight prior to the administration of POE. Animal experiments were carried out in accordance with the Guidelines for Animal Experimentation of Liaoning University of Traditional Chinese Medicine, and the procedure was approved by the Animal Ethics Committee of this institution (20140528).
Preparation of the POE solution
Whole dried P. oleracea L. (3 kg) was reluxed twice
with water (30 L), each for 1 h, then POE was obtained after the water was removed under reduced pressure. Then, the residue was passed through an AB-8 macroporous resin column (8 × 100 cm, Shanghai, China). To eliminate impurities, the column was eluted with 15 L of water and eluted with 30 L of 50% ethanol. After removing the ethanol of the 50% ethanol fraction in vacuo, the
OH OH HO O O OCH3 OH OH O O OH HO OH HO O O CH3 O
OH OHOH OH O OH OH O OCH3 OH O OH O HO O OH HO OH
Coff eic acid p-Coumaric acid Ferulic acid Quercitrin
Hesperidin Puerarin COOH O OH OH OH O CH3 O OH OH OH
suspended solution of POE was obtained and stored at 4 °C prior to use. Using the external standard method for
quantiication, the contents of CA, p-CA, FA, QUER and HP in the suspended solution of extract were found to be 0.467, 0.146, 0.433, 0.0738 and 1.60mg/mL, respectively.
Preparation of standards and quality control samples
The stock solutions of the ive standard compounds
CA, p-CA, FA, QUER, HP and the IS were precisely weighed and dissolved using ultrasound in methanol, to yield concentrations of 235, 221, 327, 259, 242 and 212 ug·mL-1, respectively.
For the tissue assay, ive calibrators of CA (0.05,
0.1, 0.2, 0.5, 1.25 and 5.0 ug·mL-1), p-CA (0.05, 0.1, 0.2, 0.5, 1.25 and 5.0 ug·mL-1), FA (0.1, 0.2, 0.4, 1.0, 2.5 and 10.0 ug·mL-1), QUER (0.075, 0.15, 0.3, 0.75, 1.875 and 7.5 ug·mL-1) and HP (0.4, 0.8, 1.6, 4, 10 and 40 ug·mL-1) were prepared by adding standard working solutions
(50 μL) and the IS (10 μL) to drug-free rat tissues. All
stock and working standard solutions were stored in brown bottles at 4ºC until analysis. Quality control (QC) tissue samples were prepared at low, medium and high concentrations (0.125, 0.7 and 4 ug·mL-1 for CA and p-CA; 0.25, 1.4 and 7.98 ug·mL-1 for FA; 0.1875, 1.05 and 5.985 ug·mL-1 for QUER; 1.0, 5.7 and 32 ug·mL-1 for HP) in bulk and aliquots were stored at -20 °C until analysis.
For the urine and feces assay, ive calibrators of CA
(0.15, 0.3, 0.6, 1.5, 3.75 and 15 ug·mL-1), p-CA (0.125, 0.25, 0.5, 1, 2.5 and 6.25 ug·mL-1), FA(0.09, 0.18, 0.35, 0.88, 2.19 and 5.47 ug·mL-1), QUER (0.19, 0.38, 0.75, 1.88, 4.69 and 18.75 ug·mL-1), and HP (1.25, 2.5, 5, 10, 25 and 75 ug·mL-1) were prepared by adding standard
working solutions (50 μL) and IS (50 μL) to drug-free
rat urine/fecal samples. All stock and working standard solutions were stored in brown bottles at 4ºC until analysis. The quality control (QC) samples of urine/feces were prepared at low, medium and high concentrations (0.38, 4.25 and 48.00 ug·mL-1 for CA; 0.63, 7.07 and 80.00 ug·mL-1 for p-CA; 0.22, 3.91 and70.00 ug·mL-1 for FA; 0.1875, 0.47, 5.30 and 60.00 ug·mL-1 for QUER; 3.13, 13.69 and 60.00 ug·mL-1 for HP) in bulk and aliquots were stored at -20 °C until analysis.
Preparation of biosamples
Twenty-five rats were divided into five groups (n = 5) at random. All rats were orally dosed with POE at a dose of 8.4 mL·kg-1, (approximately equivalent to 3.92 mg·kg-1 of CA, 1.23 mg·kg-1 of p-CA, 3.64 mg·kg-1
of FA, 0.62 mg·kg-1 of QUER and 13.47 mg·kg-1 of HP). Also, tens rat were divided into two groups (n=5) at random for the urine and feces assay.
For the tissue assay, the dosed rats were sacriiced
and tissues removed at 10, 30, 60, 90 and 150 min. Tissues were collected, including liver, intestine, stomach, muscle, heart, lung, brain, kidney and spleen. All tissues were
rinsed with physiological saline, blotted on ilter paper
and weighed (the contents of stomach and intestine were removed before rinsing). Approximately 0.2 g of each tissue was weighed out and homogenized in 0.5 mL of saline solution, then centrifuged at 3000 rpm for 15 min. Tissue samples were stored at -20 °C until analysis.
The homogenized tissue samples (0.2 mL) were
supplemented with 10 μL of the IS, 20 μL of acetic acid
and 1 mL of methanol, followed by vortex mixing for 1 min, then centrifuged at 3000 rpmfor 15 min. The supernatant was collected and evaporated to dryness at 50 °C under a gentle stream of nitrogen. Then, the dried
residue was reconstituted in 100 μL of the initial mobile phase and centrifuged at 10,000 rpm for 10 min. A 1 μL
aliquot of the supernatant was injected into the UHPLC system for analysis.
For the urine and feces assay, all the rats were housed in stainless-steel metabolism cages to collect urine and feces at 0-2 h, 2-4 h, 4-8 h, 8-12 h and 12-24 h post-dosing.
Water and standard laboratory food were ofered during
the whole experiment. The volume of the each collected urine sample and the weight of each collected feces sample were respectively recorded. All the samples were stored at –20°C until analysis.
Urine samples (200 μL) were supplemented with 50 μL of the IS, 20 μL of acetic acid and 1 mL of methanol
and pipetted, followed by vortex mixing for 1 min. After centrifugation at 3000 rpm for 15 min, the supernatant was separated and evaporated to dryness under a gentle stream of nitrogen at 40°C. The residue was reconstituted in
200 μL of the mobile phase and centrifuged at 10,000 rpm for 10 min. Then, a 1 μL aliquot of the clean supernatant
was injected into the UHPLC system for analysis. About 0.2 g of feces was homogenized in 0.5 mL of physiological saline solution (w/v, 2/5). The homogenate
was then supplemented with 50 μL of the IS, 20 μL of
acetic acid and 1 mL of methanol, then treated further in a similar manner as the urine samples.
Method validation
Selectivity
from five drug-free rats with those of corresponding
standard tissue/urine/feces samples spiked with the ive
standard solutions and IS, as well as the biosamples obtained after oral administration of POE.
Linearity, LOD and LLOQ
The calibration curves of tissues were performed over the linear range of 0.05-5 ug·mL-1 CA, 0.05-5 ug·mL-1
p-CA, 0.1-10 ug·mL-1 FA, 0.075-7.5 ug·mL-1 QUER, and 0.4-40 ug·mL-1 HP. The calibration curves of urine/feces were performed over the linear range of 0.15-60 ug·mL-1 CA, 0.125-100 ug·mL-1 p-CA, 0.0875-87.5 ug·mL-1 FA, 0.1875-75 ug·mL-1 QUER, and 1.25-75 ug·mL-1
HP). The calibration curves for each analyte in diferent
tissue/urine/fecal samples were generated by plotting the
area ratio of ive compounds to the IS separately vs. the nominal concentration in the standard tissue/urine/fecal samples. Moreover, the weighted (1/c2) least-square linear regression was applied to obtain the regression equation. The LOD (limit of detection) was determined by diluting the QC samples stepwise, given as the signal-to-noise
ratio (S/N = 3). The lower limit of quantiication (LLOQ),
considered to be the lowest concentration point in the calibration curves, displayed an acceptable accuracy (RE) within ± 15% and a precision of less than 20%.
Precision and accuracy
Five replicates of QC tissue/urine/fecal samples at three concentrations were assessed to calculate the intra-day precision and accuracy on the same intra-day. Inter-intra-day precision was determined by analyzing the QC tissue/ urine/feces samples over three consecutive days. The intra-day and inter-day precision were defined as the relative standard deviation, and accuracy was determined by calculating the relative error (RE).
Extraction recovery
The extraction recoveries of ive compounds were
determined by comparing the peak area of each compound from QC samples at three concentrations with that of the unextracted standard solutions containing the equivalent amount of analytes regarded as 100% recovery.
Stability
The stability of QC samples was investigated at three concentrations, i.e. low, medium and high. The short-term stability experiment was conducted at ambient temperature (25 °C) for 24 h, and long-term stability was assessed after storage at -20 °C for 1 month. The freeze (-20 °C)-thaw (room temperature) stability was assessed after three freeze-thaw cycles.
RESULTS AND DISCUSSION
Method development and optimization
In order to obtain suitable retention times and good separation for the five components in the POE
and IS, diferent combinations of several mobile phases
were chosen, i.e. methanol-water and acetonitrile-water. Comparatively, there existed a serious baseline drift and interference of endogenous components in the tissues with analytes using the methanol-water system; besides, we could not obtain satisfactory separation among the compounds in POE. These problems were ultimately solved by using acetonitrile-water as the mobile phase in gradient elution, into which some acetic acid was added in order to obtain perfect peak shapes.
Three different wavelengths (270, 320 and 360
nm) were chosen to achieve high sensitivity for the ive
investigated components of POE. Finally, a detection wavelength of 320 nm was applied for the simultaneous
analysis of the ive compounds with no interference.
Method validation
Selectivity
To determine the selectivity of this method, blank tissues/urine/feces, tissues/urine/feces spiked with known
amounts of the ive reference substances, and tissue/urine/
feces removed from rats after oral dosing with POE were analyzed. The chromatograms of the stomach were chosen as an example (Figure 2) and show that there were no interfering peaks in the region of the peaks of the analytes. The retention times of CA, IS, p-CA, FA, QUER, and HP were approximately at 3.61, 4.42, 5.24, 6.25, 7.11 and 8.21 min, respectively. The total run time was 10 min.
Linearity, LOD and LLOQ
The calibration curves, correlation coeicients and
linear ranges of the five compounds in each tissue are
given in Table I. The LODs of the ive components, i.e.
CA, p-CA, FA, QUER and HP were 0.015, 0.015, 0.03, 0.0225 and 0.12 ug·mL-1, respectively. The LLOQ of the
ive components was deined as the lowest concentration
on the calibration curve with precision/accuracy within 20%, verified by repeated analysis. The calibration
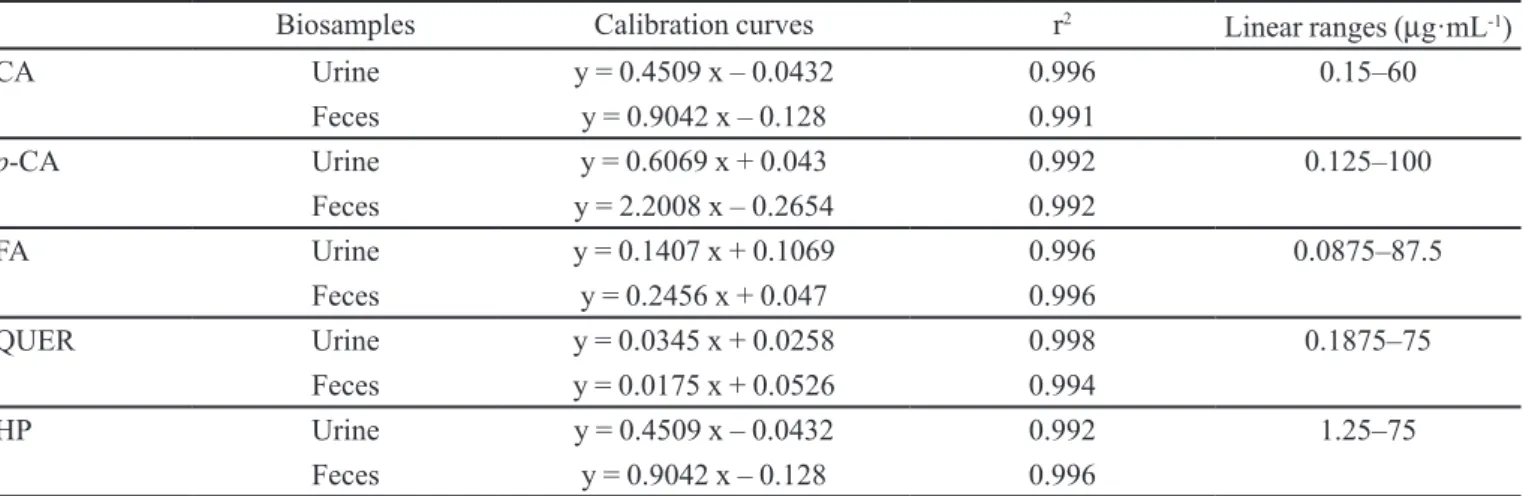
curves, correlation coeicients and linear ranges of the ive compounds in urine/feces are given in Table II. The LODs of the ive components, i.e. CA, p-CA, FA, QUER and HP were 0.045, 0.0375, 0.026, 0.056 and 0.375 ug·mL-1, respectively. The LLOQ of the ive components
curve with precision/accuracy within 20%, veriied by
repeated analysis.
Precision and accuracy
The intra- and inter-day precision/accuracy of each analyte in the tissue QC samples at three concentrations are given in Table III. The intra- and inter-day precision/
accuracy of each analyte in the urine/feces QC samples at three concentrations are given in Tables IV/V. The RSDs
of the ive compounds were all < 20% for the intra-day and
inter-day assays, which is in accordance with the guidance of the USFDA (FDA, 2001).
Extraction recovery and stability
Tables III-V show that the extraction recoveries of
the ive compounds in diferent tissues ranged from 82.14
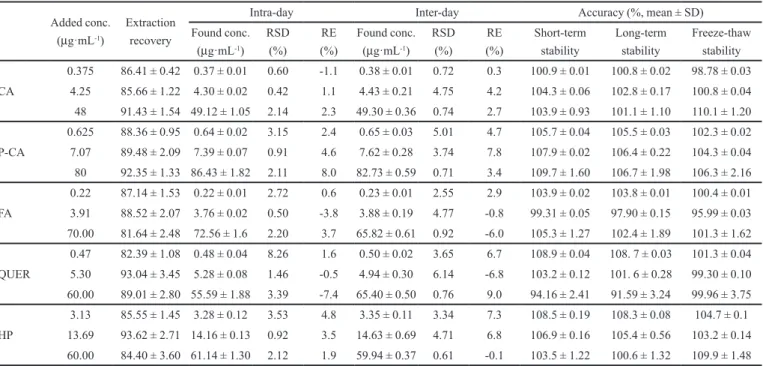
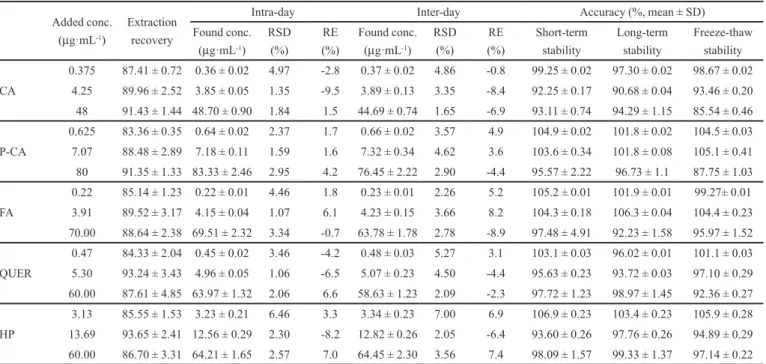
± 1.03% to 93.62 ± 2.71%, and that of the IS was 92.93 ± 3.14%, 81.64 ± 2.48% to 94.93 ± 2.34% in the urine and 83.36 ± 0.35% to 93.65 ± 2.41% in the feces, demonstrating that there was negligible loss during extraction, which could be attributed to the high solubility of the analytes in methanol and the one-step protein precipitation used in the sample preparation. The results of the short-term stability, long-term stability and freeze-thaw stability also indicated that no remarkable degradation occurred during the chromatography, extraction and sample storage processes for excreta samples.
Tissue distribution assay
The concentrations of the ive components in the
nine tissues collected at 10, 30, 60, 90 and 150 min after oral administration of POE are shown in Table VI.
Although the chemical structures of CA, p-CA and FA were similar, their concentrations in the tissues were
signiicantly diferent (Table VI). After oral administration
of the POE in rats, only p-CA and FA were found in all tissues (except for p-CA in the brain). The reason why
p-CA was higher in tissues (except for the brain) is that the transepithelial transport of p-CA depends on concentration and saturation (Konishi, Kobayashi, Shimizu, 2003), and higher FA levels in the intestine could partly be attributed
to gradual elux from the stomach. CA was only observed in the stomach and intestine at the diferent ive points, and in the muscle at the irst point. Both QUER and HP are lavonoids, and their behaviors were basically consistent
in vivo after gavage (Table VI). QUER was abundant in the stomach and intestine but only a little was found in the liver, and the highest concentrations of HP were in the stomach with low levels in the liver, kidney and intestine; HP was not found in other tissues. Bacteria and/or enzyme-related hydrolysis of HP in the gastrointestinal tract is an important factor responsible for the poor absorption of HP, and its absorption might depend on the type of sugar moiety bonded to the aglycone (Chang et al., 2005).
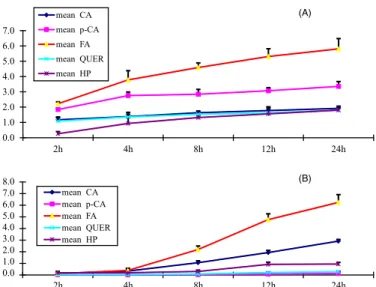
Excretion assay
The cumulative ratios of the five analytes are
FIGURE 2 - Typical chromatograms A-C. Blank stomach sample
A, blank stomach sample spiked with standard ive compounds
TABLE II - Calibration curves, correlation coeicients and linear ranges of the ive compounds in the urine/feces samples
Biosamples Calibration curves r2 Linear ranges (
µg·mL-1)
CA Urine y = 0.4509 x – 0.0432 0.996 0.15–60
Feces y = 0.9042 x – 0.128 0.991
p-CA Urine y = 0.6069 x + 0.043 0.992 0.125–100
Feces y = 2.2008 x – 0.2654 0.992
FA Urine y = 0.1407 x + 0.1069 0.996 0.0875–87.5
Feces y = 0.2456 x + 0.047 0.996
QUER Urine y = 0.0345 x + 0.0258 0.998 0.1875–75
Feces y = 0.0175 x + 0.0526 0.994
HP Urine y = 0.4509 x – 0.0432 0.992 1.25–75
Feces y = 0.9042 x – 0.128 0.996
y, peak area ratio; x, concentration of the reference standard (µg·mL-1); r, correlation coeicient.
TABLE I - Calibration curves, correlation coeicients and linear ranges of the ive compounds in the tissue samples
Biosamples Calibration curves r2 Linear range
(µg·mL-1) Biosamples Calibration curves r
2 Linear range
(µg·mL-1)
CA
stomach y=4.7598x+0.3953 0.999
0.05-5 FA
stomach y=3.9862x+0.6429 0.9998
0.1-10
liver y=5.1869x+0.1426 0.9932 liver y=3.2723x+0.2441 0.999
intestine y=6.5169x+0.0752 0.9994 intestine y=3.7437x+0.3976 0.999
muscle y=3.6674x+0.0644 0.9994 muscle y=3.2464x+0.1811 0.9992
heart y=2.1671x+0.1147 0.9968 heart y=2.6317x+0.0206 0.999
lung y=4.32751x+0.2351 0.991 lung y=3.0402x+0.2042 0.999
brain y=4.6791x+0.673 0.994 brain y=2.8763x+0.4505 0.9996
kidney y=4.1844x+0.4002 0.9902 kidney y=0.5426x+0.2368 0.9934
spleen y=1.2381x+0.1635 0.993 spleen y=3.1617x+0.0763 0.9948
p-CA
stomach y=8.9653x+0.5561 0.9992
0.05-5 QUER
stomach y=1.9548x+0.2086 0.9998
0.075-7.5
liver y=7.8747x+0.2996 0.999 liver y=1.4638x+0.1653 0.999
intestine y=8.6427x+0.3888 0.999 intestine y=1.7038x+0.1838 0.9992
muscle y=8.7493x+0.2771 0.9994 muscle y=1.2381x+0.0074 0.999
heart y=7.4364x+0.1338 0.9992 heart y=0.6773x+0.1474 0.997
lung y=7.3137x+0.2229 0.999 lung y=0.937x+0.1624 0.9986
brain y=6.4779x+0.5136 0.999 brain y=1.0706x+0.3502 0.997
kidney y=7.3448x+0.7083 0.9924 kidney y=0.6990x+0.1709 0.996
spleen y=6.9256x+0.2891 0.9924 spleen y=1.134x+0.1163 0.991
HP
stomach y=0.1299x+0.0483 0.9994
0.4-40 liver y=0.1252x+0.0459 0.9994
intestine y=0.1184x+0.0204 0.9994 muscle y=0.1178x+0.0526 0.9996 heart y=0.1156x+0.0946 0.9994 lung y=0.1110x+0.1166 0.994 brain y=0.0884x+0.1894 0.9936 kidney y=0.1004x+0.1126 0,997 spleen y=0.0952x+0.1656 0.998
TABLE III - Extraction recovery, precision, accuracy and stability of the ive compounds in stomach. (n = 5)
Added conc. (µg·mL-1)
Extraction recovery
Intra-day Inter-day Accuracy (%, mean ± SD)
Found conc. (µg·mL-1)
RSD (%)
RE (%)
Found conc. (µg·mL-1)
RSD (%)
RE (%)
Short-term stability
Long-term stability
Freeze-thaw stability 0.125 84.41 ± 0.92 0.12 ± 0.01 6.40 -3.3 0.12 ± 0.01 5.07 -3.2 90.90 ± 0.95 88.41 ± 0.92 94.25 ± 2.07 CA 0.7 86.96 ± 2.22 0.66 ± 0.01 1.67 -6.2 0.67 ± 0.03 4.70 -6.4 86.48 ± 4.88 86.96 ± 2.22 86.12 ± 2.46 4 91.03 ± 1.74 3.76 ± 0.10 2.53 -5.9 3.69 ± 0.12 3.12 -7.7 92.51 ± 3.50 94.03 ± 4.88 91.67 ± 5.10 0.125 85.36 ± 0.55 0.12 ± 0.03 1.66 -3.1 0.12 ± 0.01 5.92 -3.9 91.97 ± 1.57 85.36 ± 0.55 85.98 ± 1.17
p-CA 0.7 87.48 ± 3.09 0.67 ± 0.03 4.04 -4.7 0.66 ± 0.01 0.83 -6.2 86.56 ± 4.08 87.48 ± 3.09 88.62 ± 0.49 4 90.35 ± 1.13 3.73 ± 0.07 1.94 -6.8 3.72 ± 0.03 0.78 -7.0 85.06 ± 5.11 90.35 ± 4.13 93.48 ± 4.94 0.125 82.14 ± 1.03 0.13 ± 0.01 4.10 3.2 0.13 ± 0.02 2.16 0.3 92.54 ± 0.90 97.14 ± 3.03 102.5 ± 4.06 FA 0.7 86.52 ± 3.07 0.72 ± 0.05 7.11 2.8 0.75 ± 0.01 1.86 6.6 108.0 ± 2.85 106.5 ± 3.07 93.24 ± 0.31 4 83.64 ± 2.78 4.20 ± 0.14 3.38 4.9 4.23 ± 0.09 2.18 5.8 103.3 ± 0.07 100.6 ± 2.78 105.3 ± 5.75 0.188 84.39 ± 2.08 0.18 ± 0.01 6.70 -2.5 0.179 ± 0.01 7.10 -5.0 97.29 ±1.81 99.39 ± 2.08 87.29 ± 2.78 QUER 1.05 93.04 ± 3.45 1.01 ± 0.02 1.79 -3.8 1.01 ± 0.10 9.91 -4.0 88.40 ± 5.83 93.04 ± 3.45 88.93 ± 4.41 6 87.01 ± 4.80 5.62 ± 0.15 2.74 -6.4 5.98 ± 0.16 2.65 -0.4 109.6 ± 1.35 87.01 ± 4.80 92.36 ± 5.47 4 82.55 ± 1.55 3.78 ± 0.10 2.65 -5.51 3.81 ± 0.17 4.53 -4.79 89.64 ± 3.77 91.55 ± 1.55 88.98 ± 3.68 HP 22.4 93.62 ± 2.71 23.17 ± 1.65 7.11 3.45 23.72 ± 1.16 4.88 5.90 103.9 ± 3.53 99.62 ± 2.71 94.46 ± 4.85 127.68 86.40 ± 3.60 118.9 ± 1.04 0.87 -6.92 119.2 ± 2.11 1.77 -6.67 87.10 ± 3.73 86.40 ± 4.60 89.85 ± 4.15
TABLE IV - Extraction recovery, precision, accuracy and stability of the ive compounds in urine. (n = 5)
Added conc. (µg·mL-1)
Extraction recovery
Intra-day Inter-day Accuracy (%, mean ± SD)
Found conc. (µg·mL-1)
RSD (%)
RE (%)
Found conc. (µg·mL-1)
RSD (%)
RE (%)
Short-term stability
Long-term stability
Freeze-thaw stability
CA
0.375 86.41 ± 0.42 0.37 ± 0.01 0.60 -1.1 0.38 ± 0.01 0.72 0.3 100.9 ± 0.01 100.8 ± 0.02 98.78 ± 0.03 4.25 85.66 ± 1.22 4.30 ± 0.02 0.42 1.1 4.43 ± 0.21 4.75 4.2 104.3 ± 0.06 102.8 ± 0.17 100.8 ± 0.04 48 91.43 ± 1.54 49.12 ± 1.05 2.14 2.3 49.30 ± 0.36 0.74 2.7 103.9 ± 0.93 101.1 ± 1.10 110.1 ± 1.20
P-CA
0.625 88.36 ± 0.95 0.64 ± 0.02 3.15 2.4 0.65 ± 0.03 5.01 4.7 105.7 ± 0.04 105.5 ± 0.03 102.3 ± 0.02 7.07 89.48 ± 2.09 7.39 ± 0.07 0.91 4.6 7.62 ± 0.28 3.74 7.8 107.9 ± 0.02 106.4 ± 0.22 104.3 ± 0.04 80 92.35 ± 1.33 86.43 ± 1.82 2.11 8.0 82.73 ± 0.59 0.71 3.4 109.7 ± 1.60 106.7 ± 1.98 106.3 ± 2.16
FA
0.22 87.14 ± 1.53 0.22 ± 0.01 2.72 0.6 0.23 ± 0.01 2.55 2.9 103.9 ± 0.02 103.8 ± 0.01 100.4 ± 0.01 3.91 88.52 ± 2.07 3.76 ± 0.02 0.50 -3.8 3.88 ± 0.19 4.77 -0.8 99.31 ± 0.05 97.90 ± 0.15 95.99 ± 0.03 70.00 81.64 ± 2.48 72.56 ± 1.6 2.20 3.7 65.82 ± 0.61 0.92 -6.0 105.3 ± 1.27 102.4 ± 1.89 101.3 ± 1.62
QUER
0.47 82.39 ± 1.08 0.48 ± 0.04 8.26 1.6 0.50 ± 0.02 3.65 6.7 108.9 ± 0.04 108. 7 ± 0.03 101.3 ± 0.04 5.30 93.04 ± 3.45 5.28 ± 0.08 1.46 -0.5 4.94 ± 0.30 6.14 -6.8 103.2 ± 0.12 101. 6 ± 0.28 99.30 ± 0.10 60.00 89.01 ± 2.80 55.59 ± 1.88 3.39 -7.4 65.40 ± 0.50 0.76 9.0 94.16 ± 2.41 91.59 ± 3.24 99.96 ± 3.75
HP
3.13 85.55 ± 1.45 3.28 ± 0.12 3.53 4.8 3.35 ± 0.11 3.34 7.3 108.5 ± 0.19 108.3 ± 0.08 104.7 ± 0.1 13.69 93.62 ± 2.71 14.16 ± 0.13 0.92 3.5 14.63 ± 0.69 4.71 6.8 106.9 ± 0.16 105.4 ± 0.56 103.2 ± 0.14 60.00 84.40 ± 3.60 61.14 ± 1.30 2.12 1.9 59.94 ± 0.37 0.61 -0.1 103.5 ± 1.22 100.6 ± 1.32 109.9 ± 1.48
listed in Figure 3. Six hours after delivery, CA and FA all reached maximum excretion in the urine and feces, and were eliminated slowly after that. The cumulative ratios after 24 h were above 90% in the total excreta, indicating that they were completely eliminated within 24 h after oral administration. In the combined results
TABLE V - Extraction recovery, precision, accuracy and stability of the ive compounds in feces. (n = 5)
Added conc. (µg·mL-1)
Extraction recovery
Intra-day Inter-day Accuracy (%, mean ± SD)
Found conc. (µg·mL-1)
RSD (%)
RE (%)
Found conc. (µg·mL-1)
RSD (%)
RE (%)
Short-term stability
Long-term stability
Freeze-thaw stability
CA
0.375 87.41 ± 0.72 0.36 ± 0.02 4.97 -2.8 0.37 ± 0.02 4.86 -0.8 99.25 ± 0.02 97.30 ± 0.02 98.67 ± 0.02 4.25 89.96 ± 2.52 3.85 ± 0.05 1.35 -9.5 3.89 ± 0.13 3.35 -8.4 92.25 ± 0.17 90.68 ± 0.04 93.46 ± 0.20 48 91.43 ± 1.44 48.70 ± 0.90 1.84 1.5 44.69 ± 0.74 1.65 -6.9 93.11 ± 0.74 94.29 ± 1.15 85.54 ± 0.46
P-CA
0.625 83.36 ± 0.35 0.64 ± 0.02 2.37 1.7 0.66 ± 0.02 3.57 4.9 104.9 ± 0.02 101.8 ± 0.02 104.5 ± 0.03 7.07 88.48 ± 2.89 7.18 ± 0.11 1.59 1.6 7.32 ± 0.34 4.62 3.6 103.6 ± 0.34 101.8 ± 0.08 105.1 ± 0.41 80 91.35 ± 1.33 83.33 ± 2.46 2.95 4.2 76.45 ± 2.22 2.90 -4.4 95.57 ± 2.22 96.73 ± 1.1 87.75 ± 1.03
FA
0.22 85.14 ± 1.23 0.22 ± 0.01 4.46 1.8 0.23 ± 0.01 2.26 5.2 105.2 ± 0.01 101.9 ± 0.01 99.27± 0.01 3.91 89.52 ± 3.17 4.15 ± 0.04 1.07 6.1 4.23 ± 0.15 3.66 8.2 104.3 ± 0.18 106.3 ± 0.04 104.4 ± 0.23 70.00 88.64 ± 2.38 69.51 ± 2.32 3.34 -0.7 63.78 ± 1.78 2.78 -8.9 97.48 ± 4.91 92.23 ± 1.58 95.97 ± 1.52
QUER
0.47 84.33 ± 2.04 0.45 ± 0.02 3.46 -4.2 0.48 ± 0.03 5.27 3.1 103.1 ± 0.03 96.02 ± 0.01 101.1 ± 0.03 5.30 93.24 ± 3.43 4.96 ± 0.05 1.06 -6.5 5.07 ± 0.23 4.50 -4.4 95.63 ± 0.23 93.72 ± 0.03 97.10 ± 0.29 60.00 87.61 ± 4.85 63.97 ± 1.32 2.06 6.6 58.63 ± 1.23 2.09 -2.3 97.72 ± 1.23 98.97 ± 1.45 92.36 ± 0.27
HP
3.13 85.55 ± 1.53 3.23 ± 0.21 6.46 3.3 3.34 ± 0.23 7.00 6.9 106.9 ± 0.23 103.4 ± 0.23 105.9 ± 0.28 13.69 93.65 ± 2.41 12.56 ± 0.29 2.30 -8.2 12.82 ± 0.26 2.05 -6.4 93.60 ± 0.26 97.76 ± 0.26 94.89 ± 0.29 60.00 86.70 ± 3.31 64.21 ± 1.65 2.57 7.0 64.45 ± 2.30 3.56 7.4 98.09 ± 1.57 99.33 ± 1.37 97.14 ± 0.22
TABLE VI - Concentrations of CA, p-CA, FA, QUER and HP in diferent rat tissues after oral administration of POE (n = 5)
Time (min)
Concentration (µg·g-1)
Liver Intestine Stomach Muscle Heart Lung Brain Kidney Spleen
CA 10 - 1.18 ± 0.20 2.18 ± 0.23 0.290 ± 0.03 - - - -
-30 - 0.126 ± 0.04 0.613 ± 0.08 - - -
-60 - 0.628 ± 0.04 1.95 ± 0.20 - - -
-90 - 0.611 ± 0.02 1.64 ± 0.10 - - -
-150 - 0.202 ± 0.09 2.61 ± 0.10 - - -
-p-CA 10 0.0236 ± 0.003 0.367 ± 0.07 3.02 ± 0.10 0.0719 ± 0.03 0.0396 ± 0.003 0.0582 ± 0.003 - 0.0490 ± 0.001 0.0333 ± 0.007 30 0.00740 ± 0.0003 0.0236 ± 0.01 1.13 ± 0.03 0.0114 ± 0.003 0.0144 ± 0.003 0.0420 ± 0.003 - 0.0580 ± 0.03 0.0228 ± 0.001
60 0.00582 ± 0.0007 0.0351 ± 0.003 1.53 ± 0.03 - 0.0459 ± 0.007 0.0534 ± 0.02 - 0.0601 ± 0.007 0.0136 ± 0.03
90 0.0148 ± 0.003 0.0944 ± 0.03 1.99 ± 0.10 - 0.0364 ± 0.003 0.0490 ± 0.03 - 0.0396 ± 0.002 0.0142 ± 0.002
150 - 0.0320 ± 0.003 1.13 ± 0.04 0.0144 ± 0.003 0.0312 ± 0.003 0.0672 ± 0.001 - 0.0484 ± 0.02 0.0316 ± 0.0007
FA 10 0.178 ± 0.05 5.54 ± 0.40 32.7 ± 0.60 0.876 ± 0.30 0.297 ± 0.090 0.0592 ± 0.009 - 3.09 ± 0.42 0.314 ± 0.09
30 - 0.782 ± 0.02 11.5 ± 0.60 0.200 ± 0.04 0.286 ± 0.05 - - 2.00 ± 0.10 0.387 ± 0.10
60 - 2.87 ± 0.50 9.54 ± 0.40 0.0844 ± 0.009 0.250 ± 0.02 0.0148 ± 0.009 - 2.07 ± 0.40 0.268 ± 0.08
90 - 4.38 ± 0.80 16.5 ± 0.70 - - 0.0670 ± 0.008 - 0.0211 ± 0.009 0.584 ± 0.02
150 - 1.79 ± 0.07 10.0 ± 0.50 0.145 ± 0.09 - - 0.373 ± 0.09 0.822 ± 0.03 0.147 ± 0.02
QUER 10 0.0290 ± 0.01 0.146 ± 0.004 0.0279 ± 0.10 - - -
-30 0.0127 ± 0.001 - 0.213 ± 0.04 - - -
-60 0.0462 ± 0.004 - 0.772 ± 0.06 - - -
-90 - 0.580 ± 0.07 0.190 ± 0.04 - - -
-150 - 3.05 ± 0.04 0.253 ± 0.03 - - -
-HP 10 10.6 ± 2.0 9.59 ± 1.3 530.2 ± 4.00 - - -
-30 5.63 ± 1.0 - 182.7 ± 3.00 11.9 ± 0.23 - - - 6.00 ± 0.20
-60 13.9 ± 0.67 - 140.8 ± 4.13 - - - - 4.11 ± 0.08
-90 11.9 ± 0.33 - 291.2 ± 4.67 - - - - 16.4 ± 0.17
-cumulative ratios, indicating that extensive metabolism and excretion via other routes might occur, or a higher tissue distribution might occur.
CONCLUSIONS
A rapid, sensitive and specific UHPLC method with the internal standard was developed and validated for the determination of five components in POE. At the same time, the behavior of these five components of POE was also characterized in rat tissues after oral administration. Taken together, the study on tissue distributionsand excretion of these ive components of
POE is of signiicance for its clinic applications in the
future.
ACKNOWLEDGMENTS
This study was supported by the Project of
National Natural Science Foundation of China (Grant No.81573546).
REFERENCES
CHANG, Q.; ZUO, Z.; MOSES, S.S.C.; WALTER, K.K.H.
Difference in absorption of the two structurally similar
lavonoid glycosides, hyperoside and isoquercitrin, in rats.
Eur. J. Pharm. Biopharm. , v.59, n.3, p.549-555, 2005.
CHENG, Z.Z.; XIE, M.; ZHANG, W.J.; CHENG, L.; DU, Y.; WANG, Y.J.; YING, X.X.; KANG, T.G. HPLC method
for the simultaneous determination of four compounds in rat plasma after intravenous administration of Portulaca oleracea L. extract. Braz. J. Pharm. Sci., v.48, n.1, p.163-170, 2012.
FOOD AND DRUG ADMINISTRATION. FDA. Guidance for industry : bioanalytical method validation. Rockville, US : Department of Health and Human Services, Food and Drug Administration, Center for Drug Evaluation And Research
(CDER), 2001. Available at: <www.fda.gov/downloads/
Drugs/GuidanceComplianceRegulatoryInformation/ Guidances/UCM070107.pdf>. Accessed on May 05, 2001.
GONG, F.Y.; LI, F.L.; ZHANG L.L.; LI, J.; ZHANG, Z.; WANG, G. Hypoglycemic efects of crude polysaccharide
from purslane. Int. J. Mol. Sci.,v.10, n.3, p.880-888, 2009.
KONISHI, Y.; KOBAYASHI, S.; SHIMIZU, M. Transepithelial
transport of p-coumaric acid and gallic acid in Caco-2 cell monolayers. Biosci., Biotech. Biochem., v.67, n.11, p.2317-2324, 2003.
LIM, Y.Y.; KIM, H.M.; PARK, W.S.; KIM, J.H.; SHIN, H.J.; KIM, M.N. Anti-inflammatory and anti-pruritic effects of Portulaca oleracea L. Extract using in vitro and in
vivo inlammation model: LPS-treated raw264. 7 Cells, keratinocytes, NC/Nga mice and hairless SKH-1 mice.
Korean J. Asthma, Allergy and Clin. Immunol., v.31, p.199-206, 2011.
MOVAHEDIAN, A.; GHANNADI, A.; VASHIMIA, M. Hypocholesterolemic efects of purslane extract on serum
lipids in rabbits fed with high cholesterol levels. Int. J. Pharmacol., v.3, n.3, p.285-289, 2007.
The Pharmacopoeia of the People’s Republic of China. Beijing: China Medical Science and Technology Press, 2010. v.1, p.46. 3382 p.
XU, X.Q.; YU, L.S.; CHEN, G.N. Determination of lavonoids
in Portulaca oleracea L. by capillary electrophoresis with electrochemical detection. J. Pharm. Biomed. Anal., v.41, n.2, p.493-499, 2006.
Received for publicationon on 14th October 2014 Accepted for publicationon on 26th June 2015 0.0
1.0 2.0 3.0 4.0 5.0 6.0 7.0 8.0
mean CA mean p-CA mean FA mean QUER mean HP 0.0
1.0 2.0 3.0 4.0 5.0 6.0 7.0
2h
2h
4h
4h
8h
8h
12h
12h
24h
24h mean CA
mean p-CA
mean FA mean QUER
mean HP
(B) (A)
FIGURE 3 - (A) Urinary cumulative ratios of the ive analytes in rats (mean ± SD, n = 5) following oral administration of POE.
(B) Fecal cumulative ratios of the ive analytes in rats (mean ±