Artigo
*e-mail: [email protected]
ELECTROCHEMICAL STUDY ABOUT ZINC ELECTRODEPOSITION ONTO GCE AND HOPG SUBSTRATES
Madai Granados-Neri, Luis Humberto Mendoza Huizar* y Clara Hilda Rios-Reyes
Área Académica de Química, Universidad Autónoma del Estado de Hidalgo, Mineral de la Reforma, CP 42186, Hidalgo, México
Recebido em 1/6/10; aceito em 24/10/10; publicado na web em 26/1/11
We carried out an electrochemical study about zinc electrodeposition onto GCE and HOPG substrates from an electrolytic plating bath containing 0.01M ZnSO4 + 1M (NH4)2SO4 at pH 7. Under our experimental conditions the predominant chemical species was
the complex [ZnSO4(H2O)5]. The chronoamperometric study showed that zinc electrodeposition follows a typical 3D nucleation
mechanism in both substrates. The average ∆G calculated for the stable nucleus formation was 6.92 x 10⁻²¹ J nuclei−1 and 1.35 x 10⁻²⁰
J nuclei−1 for GCE and HOPG, respectively. The scanning electron microscopy (SEM) images showed different nucleation and growth
processes on GCE and HOPG substrates at same overpotential. Keywords: zinc; electrodeposition; carbon.
INTRODUCTION
Zinc electrodeposits are used in many applications to improve the corrosion resistance and several factors inluence their electrodepo-sition. It has been reported that different morphologies and textures of zinc electrodeposits may be obtained by changing electrochemical deposition parameters. These parameters are current density, tem-perature, pH, substrate surface preparation and bath composition.1-5 However, despite its great signiicance to the plating industry, often the nucleation and crystal growth process it is not well understood. Although, the zinc electrodeposition is well recognized, the kinetic parameters related to this are unclear yet. Some reports in the litera-ture propose that the zinc electrodeposition is fast, autocatalytic and controlled by electronic transfer charge2,6-8 other reports suggest a diffusion control.9-11 Only few works report the nucleation parameters associated with zinc electrodeposition, especially on carbon subs-trates.2,12-14 Probably, the main advantage of use carbon electrodes in the electrodeposition studies, is that it is an inert substrate, and it is possible to study nucleation and growth neglecting the metal-metal interaction.
Trejo et al. found that zinc electrodeposition onto glassy carbon electrode (GCE) changes from instantaneous to progressive increasing the zinc ions in the bath while the nucleation rate is controlled by transfer charge.15 Yu et al. reported a zinc instantaneous nucleation from acetate baths on GCE with a deviation to progressive nucleation when the potential applied is increased.16 Sonneveld et al. found an instantaneous nucleation with a hemiespherical 3D growth on GCE from zincate solutions.14 On the other hand, zinc electrodeposition on high oriented pyrolytic graphite (HOPG) electrodes has been few studied.17,18 Up to our knowledge, a comparison between the kinetic parameters of zinc electrodeposition from ammoniacal sulfate baths onto GCE and HOPG is missing. Thus, in this paper, a kinetical study of the zinc electrodeposition onto GCE and HOPG electro-des from ammoniacal sulfate baths is examined. Electrochemical techniques such as cyclic voltammetry, chronoamperometry were employed. Scanning electron microscopy was used to analyze the deposits obtained.
EXPERIMENTAL
Zinc electrodeposits onto GCE and HOPG electrodes were car-ried out from an aqueous solution containing 0.01M ZnSO4 + 1M (NH4)2SO4 at pH 7 (natural pH) at 25 °C. All solutions were prepared using analytic grade reagents with ultra pure water (Millipore-Q sys-tem) and were deoxygenated by bubbling N2 for 15 min before each experiment. Once the solution was deoxygenated a nitrogen atmos-phere was maintained over the solution. The bubbling was stopped to avoid the presence of additional diffusional variables caused by the nitrogen bubbles on the electrode surface. The working electrodes were a GCE tip provided by BAS™ with 0.071 cm2 and a freshly cleaved HOPG surfaces. In the case of GCE, the exposed surface was polished to a mirror inish with different grades of alumina down to 0.05 µm and ultrasonically cleaned before experiments. A graphite bar with an exposed area greater than the working electrode was used as counter electrode. A saturated calomel electrode (SCE) was used as reference electrode, with all measured potentials referred to this scale. The electrochemical experiments were carried out in a BAS potentiostat connected to a personal computer running the BAS100 W software to allow the control of experiments and data acquisition. In order to verify the electrochemical behavior of the electrode in the electrodeposition bath, a cyclic voltammetry study was performed in the 0.200 to -1.600 V potential interval at the scan rate range [10-300] mVs-1 (Figure 1S, supplementary material). The kinetic mechanism of zinc deposit onto GCE was studied under potentiostatic conditions by the analysis of the experimental current density transients obtained with the potential step technique. The perturbation of the potential electrode always started at 0.200 V. The potential step was imposed at different potentials detailed in this work. Microstructures of elec-trodeposits were examined by using a scanning electron microscope (SEM; JEOL6300).
RESULTS AND DISCUSSION
Voltammetric study
perfor-med a thermodynamic study by employing the multicomponent Pour-baix diagrams.19 The equilibrium constants of the different chemical processes associated to these species were obtained from literature.20 The speciation of Zn in solution was examined by constructing the distribution–pH diagrams. The results are shown in Figure 1. Note that under our experimental conditions the predominant chemical species is a zinc sulfate complex [ZnSO4(H2O)]5. From Pourbaix diagram, the potential of the [ZnSO4(H2O)]5/Zn couple was determined as -1.148 V vs SCE.
Figure 2 shows the typical voltammetric responses, at the scan rate of 140 mVs−1, obtained from GCE/10−2M of ZnSO
4 + 1 M (NH4)2SO4 (system I) and HOPG/10−2 M of ZnSO
4 + 1 M (NH4)2SO4 (system II) systems. For both systems, it was recorded at direct scan, the formation of peaks a and a′ at −1.355 and -1.405 V, respectively. During the inverse of the potential scan, it is possible to observe the crossovers, EC1, EC2 which are typical of the formation of a new phase involving a nucleation process.21 Others crossoverpotentials were detected at -1.161 and -1.143 V for system I and II respectively. Note that these potentials were recorded at a null current value, in where the equilibrium given by Equation 1 is expected.
(1)
Note that these values of Eeq and E’eq compare favorably with the equilibrium potential calculated from Pourbaix’s diagrams. Also, it is shown the zinc electrodeposition process starts at −1.240 V (Ecrist) and −1.316 V (Ecrist) for systems I and II, respectively. Last results suggest that, the energetic cost to perform the zinc electrodeposition is favored onto GCE in comparison with the HOPG substrate. In the anodic zone, it was possible to observe two principal peaks b and
b′ at −1.031 and -1.052 V, respectively. To determine the control limiting of the zinc electrodeposition process, the current density (jp) value associated with both peaks a and a’ was plotted as a function of ν1/2 (Figure 1S, supplementary material). A linear relationship was found for both cases, according to the Berzins-Delahay equation,22, 23 suggesting a diffusional control of the zinc electrodeposition process.
Choronoamperometric study
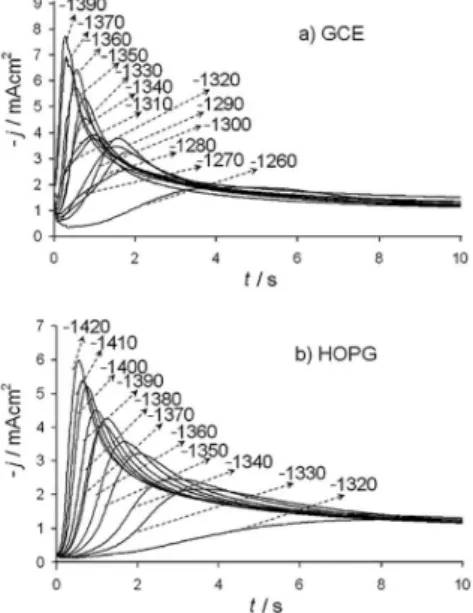
Formation of new phases occurs through nucleation and growth mechanisms in where information about the electrocrystallization process can be obtained from potentiostatic studies. Figure 3a-b shows a set of density current transients recorded at different potentials by potential step technique from systems I and II.
These transients were obtained by applying an initial potential of 0.200 V on the surface of the carbon electrode. At this potential value, the zinc deposition had not still begun (Figures 1 and 2). After the application of this initial potential, a step of negative potential (Ec) was varied on the surface of the electrode for 32 s. All transients showed a typical current maximum (jm) which is characteristic of a three-dimensional nucleation process with hemispherical diffusion control (3D-dc).10,11 A classiication of the nucleation as instantaneous or progressive from transients it is possible by following the criteria established by Sharifker et al.10 in where the experimental transients in a nondimensional form by plotting j2/j
m2 vs t/tm are compared to those theoretically generated from Equations 2 and 3 for instantaneous and progressive nucleation, respectively.
(2)
(3)
The comparison of the theoretical dimensionless transients, ge-nerated by Equations 2 and 3 with the experimental dimensionless current transients (Figure 2S, supplementary material), suggested that
Figure 1. Pourbaix-type diagrams of the Zn(II)/Zn(0) systems, pZn(II)’’=2.0,
pSO4’=0.0 and pNH3’=-0.3
Figure 2. A comparison of two cyclic voltammetric curves obtained in the
GCE (solid line) and HOPG (broken line) from an aqueous solution 10−2 M of ZnSO4 and 1 M (NH4)2SO4 (pH 7.0). The potential scan rate was started at 0.600 V toward the negative direction with a potential scan rate of 140 mV s−1
Figure 3. A set of current transients obtained from aqueous solution 10−2 M
the experimental curves closely follows the response predicted for a 3D progressive nucleation. This behavior may be expected because our system contains ammonium and sulfate ions. Thus, it has been reported that sulfate anion induces a competitive adsorption effect on the substrate complicating the electrodeposition process,24,25 which can induce a progressive nucleation mechanism. Moreover, NH4+ ions may preferentially adsorb on certain orientations too, delaying the nucleation rate.26
It has been proposed that the diffusion-limited 3D growth of metallic centers can be predicted by:27
(4)
where:
(5) (6)
(7) where N0 is the number of active nucleation sites, A is the nucle-ation rate. Here, it must be mentioned that N0 and A are potential dependent and an increasing of these quantities is expected with the decrease of the potential applied. D is the diffusion coeficient, F is the Faraday’s constant and all others parameters have their conventional meanings.
Figure 4 shows a typical comparison of the reduction experimen-tal current transients, with the theoretically generated by nonlinear itting of experimental data to Equation 4. It can be observed that the model expressed by this equation adequately accounted for the behavior of experimental transient.
The physical parameters obtained from the adjustments of Equa-tion 4 are reported in present work (Table 1). It can be seen that an increment of A and N0 is obtained when the overpotential applied is increased. Also, observe that the nucleation rate is bigger on GCE than on HOPG, the same behavior can be observed in the number of active nucleation sites. This situation can be explained due to the presence of more structural defects on GCE surface than the obtained on HOPG electrode.
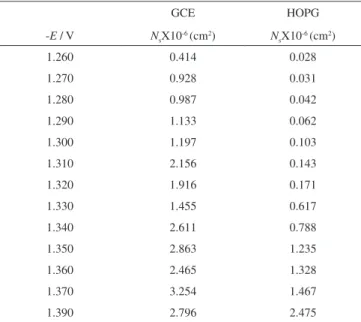
Through the physical constants reported, it was also possible to calculate the saturation number of nuclei (Ns) (Table 2). This esti-mation was made by using Equation 8:10
(8)
where
(9)
Table 1. Potential dependence for the nucleation parameters during Zn
electrodeposition onto GCE and HOPG electrodes from aqueous solution containing 10-2 M of ZnSO
4 + 1M (NH4)2SO4. The values were obtained from
best-it parameters found through the itting process of the experimental j-t plots using Equation 4
GCE HOPG
-E (V) A / s-1cm2
DX105
/ cm2 s-1
N0X10-6
/ cm2
A / / cm2 s-1
DX105
/ cm2 s-1
N0X10-6
/ cm2
1.26 0.568 1.112 0.489 0.019 0.769 0.030 1.27 0.681 1.094 0.905 0.022 0.919 0.039 1.28 0.785 1.140 1.066 0.028 0.919 0.056 1.29 0.795 1.108 1.508 0.031 0.919 0.115 1.30 1.085 1.125 1.545 0.035 0.916 0.267 1.31 1.303 1.036 4.621 0.046 0.987 0.421 1.32 1.237 1.076 3.790 0.241 1.290 0.151 1.33 1.709 0.919 11.013 0.647 1.082 0.612 1.34 1.894 1.019 2.624 0.754 1.061 0.838 1.35 3.506 1.365 2.264 1.179 1.073 1.333 1.36 3.050 1.413 2.426 1.249 1.099 1.488 1.37 4.128 0.992 21.966 0.141 0.793 11.595 1.39 4.853 1.230 18.285 0.207 0.843 10.765
Figure 4. Comparison between an experimental current density transients
(—) recorded during the zinc electrodeposition onto GCE (a) and HOPG (b) electrodes when a potential value of −1.320 V was applied with a theo-retical transient (◊, GCE ) and (O,HOPG ) generated by non-linear itting of Equation 4
Table 2. Potential dependence of the Ns from aqueous solution containing 10-2
M of ZnSO4 + 1 M (NH4)2SO4 calculated from physical constants reported
in Table 1 and Equation 8
GCE HOPG
-E / V NsX10-6 (cm2) NsX10-6 (cm2)
1.260 0.414 0.028
1.270 0.928 0.031
1.280 0.987 0.042
1.290 1.133 0.062
1.300 1.197 0.103
1.310 2.156 0.143
1.320 1.916 0.171
1.330 1.455 0.617
1.340 2.611 0.788
1.350 2.863 1.235
1.360 2.465 1.328
1.370 3.254 1.467
Observe the Ns values increased with the applied potential. It is important to mention that, due to the exclusion zones of the deposit, caused by the hemispherical diffusional gradients of 3D nucleus, the Ns will be always lower than the N0 values at the same applied potential, and both grow in accordance with a more negative poten-tial. Also, from the nucleation rate values reported (Table 1), it is possible to calculate the Gibbs free energy of nucleation employing the next equation:28
(10) with
(11) where ∆G is the Gibbs free energy of nucleation, J/nuclei; kB is the Boltzmann constant (1.38066 x 10⁻²³ J mol-1), T is the absolute temperature, K, η is the overpotential, z is the charge transferred during the zinc reduction process and e is the elementary charge of the electron. On the other hand, the critical nuclei can be calculated employing:28
(12)
It is important to mention that Equations 10 and 12 are valid in the case of a direct attachment mechanism. The plot ln(M3d
d) vs η-2 showed a linear tendency with a d(ln(M3d
d))/dη = 3.56 x 10⁻² and d(ln(M3d
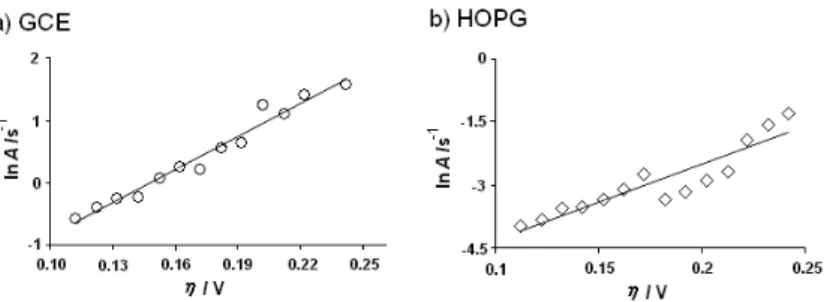
d))/dη = 6.92 x 10⁻² for GCE and HOPG respectively. Thus, the ∆G calculated for these systems was 6.92 x 10⁻²¹ J/nuclei for GCE substrate while the value calculated for HOPG was 1.35 x 10 -20 J/nuclei. These energies correspond to the ∆G value requirements for forming a stable nucleus, the average critical cluster´s size (nc) calculated employing Equation 10 was nc=0.326 and nc=0.634 which cannot be possible because a critical cluster´s size with a fractional number implies the atoms that build the critical nuclei may be divided in fractions. Thus, for example, a nc= 0.326 indicates that only 0.326 atoms are forming the critical nuclei. Thus, from a physical point of view it is not possible to separate an atom in fractions. This result is because of that in the classical nucleation theory are considered macroscopic parameters which are not adequate to determine atomic quantities without error.28 Thus, it is better to estimate the critical size of the zinc nucleus in the framework of the atomistic theory of electrolytic nucleation through the following equation:29
(13)
where α is the transfer coeficient for zinc reduction. The plots ln A vs. η showed a linear tendency (Figure 3S, supplementary material). The values of d(ln A)/dE were 24.01 and 50.36 for systems I and II, res-pectively. Thus, in both substrates, the critical cluster’s size calculated was nc=0. This value means that each active site is a critical nucleus. Morphological analysis
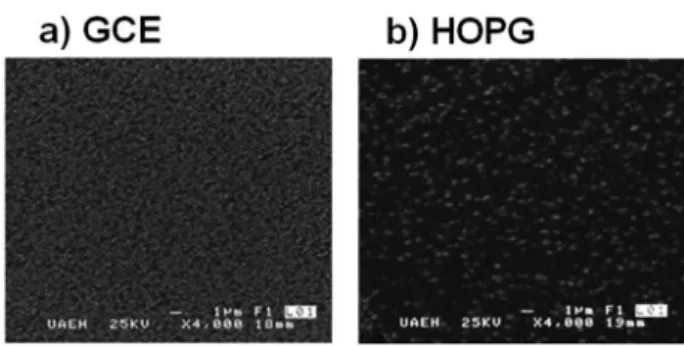
The morphology of the electrodeposits was studied by SEM. SEM micrographs of an electrodeposit formed potentiostatically at -1.3 V
is shown in Figure 5. Observe that the microstructure and surface morphology of the electrodeposits on GCE were more compact with a iner grain size (200 nm) than the obtained on HOPG; in where the deposits consisted of bigger dispersed particles (400 nm). In both cases, zinc clusters had a spherical microstructure.
Also, it is possible to observe that on GCE, Figure 5a, a major amount of nuclei was obtained with respect to HOPG substrate. The increase in the nuclei number on GCE probably is because of an in-crement of the active nucleation sites compared to those obtained on HOPG. These facts suggest that, at same overpotential, the zinc cluster and their number depend on the carbon substrate and the energetic conditions. Thus, the zinc cluster formation is more favorable on GCE than HOPG probably due to the presence of structural defects.
CONCLUSIONS
We carried out an electrochemical study about zinc electrodepo-sition onto GCE and HOPG substrates from an electrolytic plating bath containing 0.01M ZnSO4 + 1M (NH4)2SO4 at pH 7. The analysis of the density current transients showed that the zinc electrodepo-sition is a diffusion-controlled process with a typical 3D nucleation mechanism in GCE and HOPG. The average ∆G calculated for the stable nucleus formation was 6.92 x 10⁻²¹ J nuclei−1 and 1.35 x 10⁻²⁰ J nuclei−1 for GCE and HOPG, respectively. The SEM images showed the formation of bigger nuclei onto HOPG (400 nm) in comparison with those obtained onto GCE (200nm).
SUPPLEMENTARY MATERIAL
Available on http://quimicanova.sbq.org.br, in pdf ile, with free access.
ACKNOWLEDGEMENTS
M. G. Neri is grateful for a graduate student fellowship from CONACyT. L. H. M. Huizar gratefully acknowledges partial support from CONACYT through the projects APOY-COMPL-2008 No. 91261, FOMIX-CONACYT 97144 and to the Universidad Autónoma del Estado de Hidalgo. We are also grateful to the reviewers of the manuscript for valuable suggestions.
REFERENCES
1. Raeissi, K.; Saatchi, A.; Golozar, M. A.; Szpunar, J. A.; J. Appl. Electro-chem. 2004, 34, 1249.
2. Mendoza-Huizar, L. H.; Rios-Reyes, C. H.; Gómez-Villegas, M. G.; J. Mex. Chem. Soc. 2009, 53, 243.
Figure 5. SEM images of the deposits obtained at −1.300 V on a) GCE and
b) HOPG, from an aqueous solution 10−2 M of ZnSO
3. Younan, N. M.; J. Appl. Electrochem. 2000, 30, 55.
4. Millet, J. P.; Gravria, M.; Mazille, H.; Marchandise, D.; Cuntz, J. M.; Surf. Coat. Technol. 2000, 123, 164.
5. Lin, C. S.; Lee, H. B.; Hsieh, S. H.; Metall. Trans. A 2000, 31A, 475. 6. Vasilakopoulos, D. ; Bouroushian, M. ; Spyrellis, N. ; Electrochim. Acta
2009, 54, 2509.
7. Elpelboin, I.; Ksouri, M.; Wiart, R.; Faraday Disc. Chem Soc. 1978, 12, 115.
8. Weil, R.; Annu. Rev. Mater. Sci. 1989, 19, 165.
9. Sonneveld, P. J.; Visscher, W.; Barendrecht, E.; Electrochim Acta 1992, 37, 1199.
10. Scharifker, B. R.; Hills, G.; Electrochim. Acta 1983, 28, 879. 11. Scharifker, B. R.; Mostany, J.; J. Electroanal. Chem. 1984, 177, 13. 12. Raeissi, K.; Saatchi, A.; Golozar, M. A.; J. Appl. Electrochem. 2003, 33,
635.
13. Yu, J.; Yang, H.; Ai, X.; Chen, Y.; Russ. J. Electrochem. 2002, 38, 321. 14. Torrent-Burgue, J.; Guaus, E.; J. Appl. Electrochem. 2007, 37, 643. 15. Trejo, G.; Ortega, R.; Meas, Y.; Ozil, P.; Chainet, E.; Nguyen, B.; J.
Electrochem. Soc. 1998, 145, 4090.
16. Yu, J.; Cao, H.; Chen, Y.; Kang, L.; Yang, H.; J. Electroanal. Chem.
1999, 474, 69.
17. Kryshtop, I.; Yurchenko, N.; Troimenko, V.; ECS Transactions 2008, 13, 65.
18. Alvarez, A. E.; Salinas, D. R.; J. Electroanal. Chem. 2004, 566, 393. 19. Rojas-Hernández, A.; Ramírez, T. M.; Ibáñez, J. G.; González I.; J.
Electrochem. Soc. 1991, 138, 365.
20. Puigdomenech, I.; Hydra/Medusa Chemical Equilibrium Database and Plotting Software 2004, KTH Royal Institute of Technology, freely downloadable software at http://www.kemi.kth.se/medusa. accessed in March 2010.
21. Greef, R.; Peat, R.; Peter, L. M.; Pletcher, D.; Robinson, J.; Instrumental Methods in Electrochemistry, Ellis Horwood: Chichester, 1985, ch. 9. 22. Berzins, T.; Delahay, P.; J. Am. Chem. Soc. 1953, 75, 555.
23. Delahay, P.; New Instrumental Methods in Electrochemistry, Inter-science: New York, 1954, p. 122.
24. Wheeler, D. R.; Wang, J. X.; Adzic, R. R.; J. Electroanal. Chem. 1995, 387, 115.
25. Jia-Wei, Y.; Jian-Ming, W.; Wu, Q.; Zhao-Xiong, X.; Bing-Wei, M.; Langmuir 2003, 19, 7948.
26. Bertazzoli, R.; Sousa, A. D. F. B.; J. Braz. Chem. Soc. 1997, 8, 357. 27. Heerman, L.; Tarallo, A.; Electrochem. Commun. 2000, 2, 85. 28. Milchev, A.; Electrocrystallization: Fundamentals of nucleation and
Material Suplementar
*e-mail: [email protected]
ELECTROCHEMICAL STUDY ABOUT ZINC ELECTRODEPOSITION ONTO GCE AND HOPG SUBSTRATES
Madai Granados-Neri, Luis Humberto Mendoza Huizar* y Clara Hilda Rios-Reyes
Área Académica de Química, Universidad Autónoma del Estado de Hidalgo, Mineral de la Reforma, CP 42186, Hidalgo, México
Figure 3S. ln A vs. η plot, used to calculate the critical nuclei’s size according to Equation 13. The broken straight line corresponds to the linear it of the
experimental data
Figure 1S. jp vs. scan potential rate (ν1/2) for Peak a (◊, GCE) and a’(o,HOPG). The straight line corresponds to the linear it of the experimental data
Figure 2S.Comparison of experimental transients normalized through the coordinates of its respective local maximum (tm, jm), with the theoretical non-dimensional