0103 - 5053 $6.00+0.00
* e-mail: [email protected]
A Comparative Study of Electrochemical and Optical Properties of Rhenium Deposited
on Gold and Platinum
Jorge O. Zerbinoa, Ana M. Castro Lunaa, Carlos F. Zinolab, Eduardo Méndezb and M. E. Martins*,a
a
INIFTA, Universidad Nacional de La Plata, Sucursal 4, C.C. 16 (CP 1900), La Plata, Argentina b
Laboratorio de Electroquímica Fundamental, Facultad de Ciencias, Iguá 4225, Universidad de la República, Montevideo, CP 11400, Uruguay
Filmes de rênio e de óxido de rênio foram depositados sobre eletrodos de ouro e platina aplicando polarizações potenciostáticas e potenciodinâmicas numa região compreendida entre – 0,20 V e 0,70 V (vs rhe) em meio aquoso ácido contendo íons perrenato. As espessuras e as variáveis óticas dos filmes foram obtidas empregando perturbações triangulares de potencial e técnicas elipsométricas. Sobre eletrodos de ouro foi depositado rênio metálico na região de potencial de formação de hidrogênio molecular. Sobre eletrodos de platina foi formado óxido de rênio na região de adsorção de átomos de hidrogênio e rênio metálico juntamente com a formação de hidrogênio adsorvido e molecular sobre o mesmo metal.
Rhenium-containing films were grown on gold and platinum after different potentiostatic and potentiodynamic polarizations in the - 0.20 V to 0.70 V range (vs rhe) in aqueous acid perrhenate. Experimental data were obtained using cyclic voltammetry and ellipsometry, from which the thickness and optical indices of the electrodeposited rhenium layer were calculated. Metallic rhenium deposition on gold takes place at potentials within the hydrogen evolution reaction. Rhenium oxide on platinum is formed in the hydrogen adatom potential domain, whereas metallic rhenium is deposited concurrently with the hydrogen adsorption and evolution reactions on the same metal.
Keywords: rhenium, gold, platinum, voltammetry, ellipsometry
Introduction
The electrochemistry of rhenium has been the subject of different studies because of its catalytic properties in fuel cell electrodes and as a coordination compound in radiopharmacy.1-3 The electrodeposition of rhenium species
on gold from aqueous perrhenate solutions has been investigated by Horanyi et al.,4 concluding that metallic
rhenium is deposited at potentials within the hydrogen evolution region. By using an electrochemical quartz microbalance,5 it has been found that rhenium deposition
occurs through a mechanism of progressive nucleation, which changes from two-dimensional to three-dimensional growth, under diffusion control. However, the nature of the adsorbed layer has not been yet identified.5 On
platinum, on the other hand, some kind of oxygen-containing rhenium species has been detected, probably
ReO2.6 It has been suggested that prior to hydrogen
electroadsorption ReO2 adsorption takes place, and after the layer completion, bulk phases of ReO2 and ReO3 can be also observed.7
In the present work additional information obtained by spectroscopic in situ ellipsometry may contribute to solve the controversy still existing about the nature of the electrodeposited layer both on platinum and on gold.
Experimental
The electrochemical and ellipsometric studies were performed using a three-electrode optical cell as previously reported.8 Polycrystalline (pc) gold and platinum disks
(0.95 and 1.05 cm2 real area) were used as working
electrodes, which were mirror polished with fine grade alumina powders (0.3 and 0.05 mm). A large gold or platinum gauze was used as counter electrode and a reversible hydrogen electrode (rhe) as reference.
Aqueous 1 mol L-1 H
10-3 mol L-1 aqueous NH
4ReO4 (Aldrich, 99 + %) in 1 mol
L-1 H
2SO4 were used as supporting electrolyte and working
solution, respectively. Solutions were prepared from analytical quality chemicals reagent and Millipore-Milli-Q* water. All runs were performed under oxygen-free nitrogen gas saturation, at 298 K. Potentials in the text are given on the reversible hydrogen electrode (rhe) scale.
Cyclic voltammetry was performed with pc gold or platinum electrodes in the supporting electrolyte and in the working solution at a potential scan rate (v) = 0.1 V s-1.
Voltammetric runs included repetitive triangular potential scans and potential holdings in the - 0.20 V to 0.40 V range for a fixed time .
Ellipsometry was performed illuminating the electrode with monochromatic light in the visible wavelength range (400 nm l 700 nm) with an incident angle of 70 degrees. The ellipsometric parameters and were measured at
different , i.e. 405, 450, 492, 546 and 580 nm.
Different experimental procedures were applied for electrochemical and ellipsometric measurements depending on the nature of the electrode surface.
Gold electrodes
Procedure A. The electrode potential was held in the
- 0.20 V Ec 0.20 V range for a time . Later, a second
potential holding at Ec = 0.10 V was applied for = 10 min
under nitrogen bubbling, allowing the electrooxidation of molecular hydrogen previously formed. Finally, repetitive triangular potential scans were applied from
Ec = 0.10 V to Ea = 1.70 V.
Procedure B. First, a potential holding at Ea = 1.20 V for = 3 min was adjusted in the cell. Then, a potential
scan at a sweep rate v = 5x10⁻⁴ V s-1 from E
a to a cathodic
potential E located within the - 0.20 V E 0.20 V range was applied. After reaching E and holding the potential for = 10 min, an upscan from E to E
a was subsequently
performed. Ellipsometric parameters and were recorded
when applying the potential routine, as a function of potential E and time t.
Platinum electrodes
Procedure C. Ellipsometric parameters and were
recorded as a function of the potential E at v = 5x10⁻⁴ V s-1
from Ea = 0.70 V to Ec = 0.03 V and subsequently an upscan was applied from Ec to Ea.
Procedure D. The electrode potential was held in the
0.03V E 0.15V range for a time = 10 min. The
ellipsometric parameters and were recorded at the five
wavelenghts and at different selected potentials.
Results and Discussion
Electrochemical and optical behaviour of rhenium species on gold
Cyclic voltammograms of pc gold in the working solution run at v = 0.10 Vs-1 after holding the potential at
E = - 0.15 V and subsequently at E = 0.10 V for = 3 and
10 min are shown in Figure 1 (Procedure A). The first increasing potential scan covering a potential domain from 0.15 V to 1.70 V, exhibits a complex anodic profile, where two current peaks at 0.75 V and 0.88 V are observed. The current contribution at E > 1.30 V corresponds to the oxygen electrosorption. The second and the following cyclic potential scans run up to 1.70 V reveal that the anodic contributions within the 0.15 V to 1.20 V range, which are ascribed to adsorbed rhenium species, are no longer observed.
The evolution of the ellipsometric parameters and
, obtained applying a decreasing potential scan from Ea = 1.20 V to a cathodic potential limit Ec= - 0.20 V, is shown in Figures 2a an 2c, respectively (Procedure B). The and values remain nearly constant throughout
the decreasing potential scan (Figure 2a). Moreover, when
Ec is applied remains stable for times < 3 min, while for
longer , continuously decreases (Figure 2b). Afterwards,
during the following positive going potential sweep,
still decreases until achieving a constant value within
the region 0.10 V E 0.60 V. Finally, for E > 0.60 V,
Figure 1. Cyclic voltammogram of pc gold in aqueous 10-3 mol L-1
ReO4– + 1 mol L-1 H
2SO4 after holding the potential at Ec = - 0.15 V
and subsequently at E = 0.10 V for = 3 min (...) and for = 10
increases reaching the initial and values (Figures 2a
and 2c). At E = - 0.20 V, exhibits a decrease equal to 8.7
degrees while during the upscan remains almost constant (Figures 2c and 2d). The behaviour indicates that
rhenium-containing species are totally desorbed from the surface during the subsequent upscan.
The comparison between ellipsometric results and theoretical calculations considering the growth of an isotropic and homogeneous8 layer allows a quantitative description of
the electrodeposition process. For these interfaces the decrease in (remaining nearly constant) may be considered as a measure of the increase in the layer thickness, d.
Optical indices (n – i k) and the d values of the grown layer are evaluated using /pairs of data measured at five
i. This set of optical data allows the unequivocal
determination of d, n (refractive index) and k (light absorption coefficient). Furthermore, optical indices are calculated assuming the formation of a single homogeneous film of constant composition and different thicknesses according to literature.8 The program employed
for calculations uses the subroutine IBM-DFMCG9 that
finds the local minimum of a complex function of several variables by the conjugated gradients method. For each i
the experimental values corresponding to five film thicknesses di were fitted for a single pair of optical indices
ni and ki. Simultaneously, for each value of dj, the optical data measured at different
i must fit the same dj value.
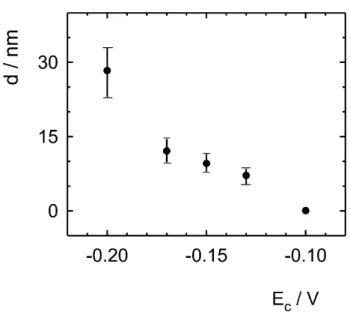
The calculated values of thickness d are plotted as a function of Ec (Figure 3). There is a general agreement that a metallic rhenium electrodeposit is obtained by applying
relatively high cathodic currents whereas rheniun oxide layers are possibly formed under milder reduction conditions.6
The optical indices of rhenium oxide have been reported10 resulting k values in the range 0.3 k 0.5 for
within 400 nm 546 nm. Taking into account that
these k values are lower than those experimentally obtained for the same region, 0.4 k 0.9, the possibility of
rhenium oxide layer formation on gold is excluded. Besides, this result suggests the growth of a porous metal layer or a composite metal/electrolyte layer which may have higher absorption k indices. Therefore, n and k values are compared with those obtained through the Bruggeman Effective Medium Theory (EMT) for an ideal mixture of metallic rhenium and water or metallic rhenium and hydrogen as a function of the volumetric fraction Q (metal/ electrolyte, metal/vacuum).11 These calculations are shown
in Figure 4 where it is assumed: i) the formation of a composite of rhenium and water, and ii) the formation of a composite of metallic rhenium and residual molecular hydrogen gas trapped in the grown layer on pc gold. On the other hand, the values of effective optical indices predicted by the Maxwell Garnet Theory (MGT) for either metallic grains dispersed in a hydrogen matrix or voids filled with molecular hydrogen embedded in a metallic matrix were also calculated12 (Table 1).
These data demonstrate a good agreement regarding the values of n and k predicted either by the EMT or the
MGT considering hydrogen voids immersed in the metallic
matrix. The calculated indices show a good agreement with the latter proposal resulting in a Q fraction of about 30 %. On the other hand, when metallic grains immersed Figure 2. Evolution of ellipsometric parameters and for the
following sequence: (a,c) down scan from Ea = 1.2 V to Ec = -0.20
V (), v = 2 10-3 Vs-1; (b,d) a potential holding for t = 10 min at E
c =
-0.20 V (); (a,c) upscan from Ec = -0.20 V to Ea = 1.2 V (o), v = 2
10-3 V s-1. Gold in aqueous 10-3 mol L-1 ReO 4
- + 1 mol L-1 H 2SO4.
= 546 nm. T = 298 K.
Figure 3. Thickness d of the adsorbed layer vs Ec calculated from
in a hydrogen matrix are taken into account, it results in a larger dispersion of the predicted Q values. This fact provides further evidence that the voids filled with hydrogen embedded in a metallic matrix suit an appropriated theory. In spite of the small differences between the predicted Q values by the EMT and the MGT for the different
i values, the comparison of data leads to
an estimate of Q value between 20% and 30%, corresponding to a composite formed by metallic rhenium with occluded hydrogen.
Electrochemical and optical behaviour of rhenium species on platinum
Cyclic voltammograms of smooth pc platinum in the working solution run at v = 0.10 V s-1 from
0.05 V Ec0.50 V up to Ea = 1.40 V are shown in Figure 5. They exhibit a complex anodic current peak at 0.57 V (Ia) and a broad cathodic current peak extending from 0.60 V to 0.05 V (Ic). Furthermore, a total blockage of hydrogen electrodesorption and a distorted profile of oxygen electroadsorption are observed, probably due to rhenium species competing for platinum surface sites. The gradual decrease of Ec from 0.50 V to 0.05 V results in a corresponding gradual growth of the anodic charge related to peak Ia, confirming that the broad cathodic current extending from 0.05 V to 0.60 V is related to the electrodeposition of rhenium species. Hence, these species are probably responsible of the hindrance of the hydrogen electrosorption reaction, as revealed through the feeble hydrogen electrodesorption current peaks (Figure 5).
The evolution of and during a negative going
potential scan from 0.70 V to 0.03 V (Procedure C) is shown in Figure 6. In the same figure and values measured at
Ec = 0.20, 0.10, 0.03, 0.45 and 0.70 V, either after = 1 min
or = 10 min, are also shown (Procedure D). The optical
parameters in the supporting electrolyte, remain practically constant both in the double layer and hydrogen adatom potential domains (0.03 V < E < 0.70 V)15,16 and in the
working solution a decrease in for E < 0.20 V is observed.
Besides, values remain constant during the early steps
of the positive potential scan, but increase for E > 0.25 V reaching at E = 0.70 V similar values to those observed on the freshly polished electrode. A decrease of about 0.1 degrees in is observed at 0.70 V after a potential cycle
(Figure 6).
Figure 5. Cyclic voltammograms of smooth pc platinum in aqueous
10-3 mol L-1 ReO 4
- + 1 mol L-1 H
2SO4 (——) and in aqueous 1 mol L -1
H2SO4 (- - - -) with a gradual change of Ec. v = 0.10 Vs
-1. T= 298 K.
Figure 4. (a) n and (b) k values predicted by the Bruggeman
Effec-tive Medium Theory for the case of (1) the composite metallic rhenium and electrolyte vs the volumetric fraction Q, (——); =
(l) 580 nm, (u) 546 nm, (s) 492 nm, (t) 450 nm, (n) 405 nm; and for (2) the composite metallic rhenium and occluded hydrogen
vs the volumetric fraction Q, (...), = () 580 nm, () 546 nm, () 492 nm, () 450 nm, (£) 405 nm. Symbols correspond to the experimental n and k obtained after data analysis. Gold in aqueous 10-3 mol L-1 ReO
4
- + 1 mol L-1 H
2SO4. T = 298 K.
a)
Furthermore, and values were also obtained after
holding the potential at different Ec for t = 10 min according to Procedure D (Figure 7). The values of (d) and (n – i k) of the grown layer were evaluated using and data measured
at the five wavelengths. Similarly to the methodology used for rhenium deposition on gold, the optical indices for platinum were calculated assuming the formation of a single homogeneous film of constant composition and different thicknesses. The program employed for the calculation also uses the subroutine IBM-DFMCG.9
In Figure 7 the calculated values of and for metallic
rhenium, rhenium oxide and platinum oxide layers are plotted as a function of different volume fractions, namely,
Qox, oxide/ electrolyte, and Qmet, metal/ electrolyte, using
the effective optical indices predicted by the EMT. Table 1 shows the optical indices and the literature value13-16 used
for the calculations. The optical indices for ReO2 are similar to those of ReO3 but exhibit lower k values.10,14
The optical measurements agree with the formation of a layer of about 0.5 Å for ReO3 (Qox = 0.76, n – i k= 0.89 –
i 0.56) at E = 0.20 V, 3 Å for metallic rhenium (Qmet = 0.88, n – i k= 3.47 – i 2.13) at E = 0.03 V and 1.40 Å for ReO3
(Qox= 0.82, n – i k= 0.85 – i 0.6 ) at E = 0.45 V. The decrease of about 0.05 degrees observed at 0.70 V probably indicates that a small quantity of rhenium oxide remains on the Figure 7. and measured at = 580 nm according to Procedure
D, t = 10 min, and the following sequence: a) (t) E= 1.4 V; b) (s)
E= 1.5 V; c) (l) E= 0.70 V; d) (u) E= 0.20 V; f) (£) E= 0.10 V; g)
(o) E= 0.03 V; h) (n) E= 0.45 V; j) (à) E= 0.70 V; k) (Ñ) E= 1.4 V; l) () E= 1.5 V. Plots include theoretical values predicted for the
different layers, increasing d on each 0.5 Å: metallic rhenium, Q = 1.00, 0.94, 0.88, 0.82; rhenium oxide, Q = 1.00, 0.94, 0.88, 0.82, 0.76; platinum oxide: (s, t) n - i k = 3.38 – i 1.26; (Ñ, ) n - i k =
2.80 – i 2.14.
Table 1. Optical indices, n and k, for metallic rhenium, rhenium oxide and platinum oxide for different values of wavelengths. nwater = (1.332 - i 0.0),
nhydrogen= (1.0 - i 0.0)
/nm 4 0 5 4 5 0 4 9 2 5 4 6 5 8 0 Ref.
n k n k n k n K n k
Re 3.55 2.74 3.64 2.91 3.99 2.74 3.90 2.42 3.78 2.39 1 3
ReO3 2.46 0.507 2.22 0.338 1.57 0.285 0.850 0.471 0.707 0.700 1 4
PtO2 2.10 2.20 2.30 2.30 2.40 2.50 2.50 2.70 2.40 2.80 1 5
3.10 1.50 3.20 1.45 3.30 1.42 3.40 1.41 3.50 1.40 1 6
Figure 6. Evolution of ellipsometric parameters and for the
following sequence: () down scan from Ea = 0.70 V to Ec = 0.03 V;
(o) upscan from Ec = 0.03 V to Ea = 0.70 V, v = 5 10
-4 Vs-1, (Procedure
C). Full marks corresponds to measurements according to Procedure D, (l) = 1 min, (t) = 10 min. Platinum in aqueous 10-3 mol L-1 ReO
4
– + 1 mol L-1 H
platinum electrode after the potential cycling. Figure 7 also shows the fitting of and values corresponding to
PtO2 layers at E = 1.40 and 1.50 V.
Conclusions
For gold electrodes rhenium deposition occurs simultaneously with hydrogen evolution reaction. A composite of metallic rhenium and occluded hydrogen is obtained with a rhenium volumetric fraction of about 30%. For platinum electrodes, rhenium oxide grows at potentials lower than 0.20 V, whereas metallic rhenium is observed at potentials lower than 0.10 V, simultaneously with the hydrogen adatom electrosorption reaction. Multilayer growth of metallic rhenium with thickness from 50 Å to 300 Å is observed at potentials lower than - 0.10 V, while a monolayer growth of metallic rhenium occurs within the hydrogen adatom potential domain with thickness from 1.5 Å to 3.0 Å.
These results clearly indicate the strong influence of the electric potential on the behaviour of rhenium deposition. Moreover, it is also noticeable the nature of the metal electrode, taking into account that different adsorption and /or catalytic reactions are probably involved.
Acknowledgements
This research project was financially supported by the “Comisión de Investigaciones Científicas de la Provincia de Buenos Aires”, CIC, the “Consejo Nacional de Investigaciones Científicas y Técnicas”, CONICET, Argentina, and the “Programa para el Desarrollo de las Ciencias Básicas”, PEDECIBA, Uruguay. M. E. M. is a researcher at CONICET. A. M. C. L. and J. O. Z. are researchers at CIC.
References
1. Karasikov, V. L.; Elektrokhimiya 1981, 17, 1518.
2. Gómez, J.; Gardiazábal, J. I.; Schrebler, R.; Gómez, H.; Córdova, R.; J. Electroanal. Chem. 1989, 260, 113. 3. Horanyi, G.; Bakos, I.; Szabó, S.; Rizmayer, E. M.; J.
Electroanal. Chem. 1992, 337, 365.
4. Bakos, I.; Horanyi, G.; Szabó, S.; Rizmayer, E. M.; J.
Electroanal. Chem. 1993, 359, 241.
5. Schrebler, R.; Cury, P.; Orellana, M.; Gómez, H.; Córdova, R.; Dalchiele, E.; Electrochim. Acta 2001 46 4309.
6. Szabó, S.; Bakos, I.; J. Electroanal. Chem. 2000, 492, 103. 7. Szabó, S.; Bakos, I. In Preparation of Catalysts VII. Studies in
Surface Science and Catalysis; Delmon, E. B.; Jacobs, P.A. et
al. eds. 1998, 118, 269.
8. Zerbino, J. O.; Florit, M. I.; Maltz, A.; Electrochim. Acta.
1999, 44, 1973.
9. Fletcher, R.; Reeves, C. M.; Computer J. 1964, 7, 149. 10. Krishna, M. G.; Bhattacharrya, A. K.; Solid. State Commun.
2000, 116, 637.
11. Aspnes, D. E. In Handbook of Optical Constants of Solids; Palik, E. D. ed., Acad. Press: New York, ch. 5, p. 89. 12. Zerbino, J.; Castro Luna, A. M.; Zinola, C. F.; Méndez, E.;
Martins, M. E.; J. Electroanal. Chem. 2002, 521, 168. 13. CRC Handbook of Chem. and Phys., 73rd ed., CRC Press: D. R.
Lide 1993.
14. Feinleib, J.; Scouler, W. J.; Ferretti, A.; Phys. Rev. 1968, 165, 765.
15. Gottesfeld, S.; Maia, G.; Floriano, J. B.; Tremiliosi Filho, G.; Ticianelli, E. A.; Gonzalez, E. R.; J. Electrochem. Soc. 1991,
138, 3219.
16. Horkans, J.; Cahan, B. D.; Yeager, E.; Surf. Sci. 1974, 46, 1.
Received: January 18, 2002