0103 - 5053 $6.00+0.00
* e-mail: [email protected]
#Present address: Instituto de Química, Universidade de São Paulo
Direct Evidence of Redox Mediation Between a Poly(aniline-
co
-N-propanesulfonic acid
aniline) and 2,5-dimercapto-1,3,4-thiadiazole by UV-Visible Reflectance Spectroscopy
Daniel A. Buttrya, Susana I. Córdoba de Torresi *,b and Roberto M. Torresi#,c
a
Department of Chemistry, University of Wyoming (UW), Laramie, Wyoming 82071-3838, USA
b
Instituto de Química, Universidade de São Paulo, CP 26077, 05513-970 São Paulo - SP, Brazil
c
Instituto de Química de São Carlos, Universidade de São Paulo, CP 780, 13560-970 São Carlos - SP, Brazil
Neste trabalho é apresentado um estudo espectroeletroquímico do comportamento redox de filmes finos de um derivado de polianilina sulfonada, poli(anilina-co-N- ácido propanosulfônico anilina), (PAPSAH) e uma mistura do mesmo derivado com 2,5-dimercapto-1,3,4-tiodiazol (DMcT) por reflectância e transmissão no UV- visível. O estudo mostra as mudanças diferenciais espectrais que acompanham a oxidação da PAPSAH e consistem no incremento da banda polarônica a 400 nm e o crescimento de uma banda a 600 nm. No processo de redução da PAPSAH, a diminuição das mesmas duas bandas é observado, mostrando que estas mudanças com o potencial são reversíveis. No caso do filme misto PAPSAH/DMcT, os dados também revelam mudanças espectrais características da oxidação do DMcT para produzir um polímero de disulfeto durante a oxidação da PAPSAH. Estas mudanças são também reversíveis com o potencial. Estes dados são a primeira evidencia espectroscópica direta da mediação redox entre um derivado de poli(anilina) e o DMcT.
A UV-visible reflectance and transmission spectroelectrochemical study of the redox behavior of thin films of a sulfonated polyaniline derivative, poly(aniline-co-N-propanesulfonic acid aniline) (PAPSAH) and of a mixture of this same derivative and 2,5-dimercapto-1,3,4-thiadiazole (DMcT) is reported. The study shows the differential spectral changes that accompany the oxidation of PAPSAH, which comprise increases in the polaron band at 400 nm and a band at 600 nm. The reduction process of PAPSAH, comprises decreases in these same spectral bands. These changes are shown to be reversible with potential. For the case of the PAPSAH/DMcT mixed film, the data also reveal spectral changes that are characteristic of oxidation of DMcT to produce a disulfide polymer during PAPSAH oxidation. These changes are also reversible with potential. These data represent the first direct, spectroscopic observation of the redox mediation between a polyaniline derivative and DMcT.
Keywords: sulfonated polyaniline, redox mediation, DMcT, lithium batteries
Introduction
Several recent papers have described the electro-chemical cycling of thin films of mixtures of polyaniline (PANI) and 2,5-dimercapto-1,3,4-thiadiazole (DMcT).1-5
The interest in this system arises from its possible use as a cathode material for Li secondary batteries,5 and is related
to theoretical calculations suggesting that PANI/DMcT cathodes may have a very high energy density under the appropriate conditions.5 As part of a concerted effort to
characterize the redox properties of this system, there has
been a detailed study of the spectroscopic and micro-gravimetric changes that accompany the electrochemical polymerization and depolymerization of DMcT.6 There
have also been studies of the redox behavior of DMcT and its derivatives in various solvent systems and of the spectroscopic changes that accompany the redox transformations of DMcT and its disulfide dimmer.7-10
speculated, based on the pKa values of DMcT and PANI, that DMcT probably exists as the monoanion under the conditions that prevail during redox cycling of PANI/ DMcT films in non-aqueous solvents.7, 10 Because of this
uncertainty, the issue of the protonation state of DMcT is not addressed in the present contribution.
Despite the reports of high energy density and good charge-discharge behavior of thin films of PANI/DMcT,5 a
significantly unattractive feature of this system arises from the fact that PANI is a p-doped conducting polymer. Thus, under the conditions of its use in Li battery cathode the material is most likely to be neutral in its reduced (discharged) state and cationic in its oxidized (charged) state, a situation that will predominantly result in anion transport during redox cycling.11,12 Since it is desirable that
cathode materials be capable both of charge storage and of accommodating Li+ produced by discharge of the anode,
an investigation of the behavior of sulfonated derivatives of PANI in mixtures with DMcT was initiated. The motivation was to use a PANI derivative for which cation transport would be the dominant mode of achieving electroneutrality during redox cycling. Extensive previous work with “self-doped” conducting polymers suggested that sulfonated PANI derivatives would be suitable for this purpose.13 There also
have been other reports of sulfonated derivatives of PANI.14
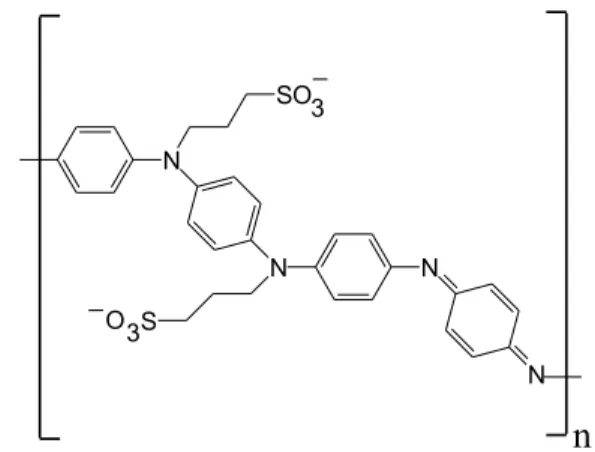
A particularly attractive system is poly(aniline-co -N-propanesulfonic acid aniline) (PAPSAH, Figure 3 shows the partially oxidized, deprotonated form), which has been produced in pure form, is easily dissolved in aqueous media, and has been thoroughly characterized.15-17
The redox and spectroscopic properties of PANI have been widely studied.18-20 The redox and spectroscopic
behavior of the DMcT system and a few of its derivatives have also been thoroughly investigated.7,10 However, while
there have been several studies of thin films of PANI/DMcT mixtures, to date there has not been a definitive spectros-copic demonstration of the mediation of DMcT redox
chemistry by PANI or any of its derivatives. This report describes a comparison between the electrochemistry and UV-vis spectroscopy of PAPSAH and PAPSAH/DMcT thin films. As will be seen below, the reflectance and transmission spectroscopic results on PAPSAH/DMcT thin films demonstrate mediation of the redox process of DMcT by PAPSAH.
Experimental
Materials
PAPSAH was synthesized, isolated and purified following a literature procedure15 using the emeraldine
salt of PANI (Aldrich) and propane sultone (Aldrich) as starting materials. Elemental analysis (C – 44.8%, H – 4.13%, N – 5.83%, S – 7.40%) revealed a molar ratio of N/ S of 1.80, consistent with the formulation of the polymeric structure shown in Scheme 3 and reported previously.15,16
The oxidized polymer of DMcT was synthesized as previously described7 using
2,5-dimercapto-1,3,4-thiadiazole dipotassium salt (K2DMcT) (Aldrich) as starting material. All other materials were reagent grade or better and were used as received.
Electrochemical measurements
Electrochemical measurements were made using conventional potentiostatic instrumentation. A Ag/AgCl reference electrode was used and all potentials are reported
vs. this reference. For transmission spectroelectrochemistry, indium-doped tin oxide (ITO) electrodes were used (Delta Technologies, < 20). For reflectance
spectroelectrochemistry, a locally designed and built (at USP) specularly reflective Au electrode was used. This electrode was cleaned by cycling between the solvent limits in aqueous 0.5 mol L-1 H
2SO4 prior to use. Observation of
Figure 3. Structure of PAPSAH.
Figure 2. Scheme of the acid-base equilibrium of DMcT.
a reproducible gold oxide electrochemical response was taken as indicative of cleanliness. Locally designed and built spectroelectrochemical cells were used for both transmission (at UW) and reflectance measurements (at USP). In the case of the reflectance experiments, a quartz window was used. The supporting electrolyte for all experiments was 1.0 mol L-1 LiClO
4 dissolved in propylene
carbonate (PC).
Film preparation
Thin films of PAPSAH and PAPSAH/DMcT mixtures were prepared by solvent casting followed by air-drying. For the transmission and electrochemical quartz crystal microbalance (EQCM) experiments with PAPSAH, the films were cast onto ITO and gold, respectively, from 0.38% (w/v) aqueous solutions of the polymer in pure deionized water. For transmission experiments with PAPSAH/DMcT mixtures, films were cast onto ITO. For these PAPSAH/ DMcT films, the casting solution was prepared by adding 10 mg of PAPSAH and 20 mg of K2DMcT to 5 mL of pure deionized water. For the reflectance experiments with PAPSAH, the films were prepared as above. For reflectance experiments with PAPSAH/DMcT, the films were prepared as above except that the solvent was 50/50 methanol/water rather than pure water. This change was made to aid in obtaining films of uniform thickness during air-drying. Note that these films are not soluble in PC, so that extended spectroelectrochemical studies in this solvent can be done without film dissolution. Because film casting is not completely reproducible, there is some scatter in the film thicknesses used in the two types of spectroscopic experiments. Thus, we emphasize qualitative, rather than quantitative, spectral changes in this study.
Spectroscopic measurements
A HP 8452 diode array spectrometer was used for transmission measurements, and a Hitachi U-3501 scanning spectrometer was used for reflectance measurements. The reference for the transmission measurements was a single beam spectrum of ITO in the spectroelectrochemical cell with 1.0 mol L-1 LiClO
4 dissolved in PC. For the specular
reflectance experiments (5 degree angle between incident and reflected beam, Specular Reflectance Attachment), all spectra are reported as differences of reflectance spectra taken under different conditions, as indicated in the text and figure captions. Unpolarized light was used in all experiments. Diffuse reflectance spectra of DMcT and the oxidized, disulfide polymer of DMcT were obtained using a Integrating Sphere Accessory 60 mm Diameter
(UV-vis-NIR) attachment with a BaSO4 reference provided by Hitachi.
Results and Discussion
Transmission spectroscopic and cyclic voltammetric experiments
The transmission UV-vis spectra of PAPSAH at different applied potentials in aqueous 1 mol L-1 HCl have been
previously described.13 A salient feature of those spectra is
a strong NIR band that appears at ca. 800 nm after oxidation of the film. As will be seen below, similar spectral behavior is observed in PC (i.e. the appearance of a NIR band at ca.
800 nm after oxidation, as well as other features). A discussion of the spectral features in PC will be presented below. However, for purposes of evaluating the reversibility of the spectral changes, we first describe observations of the spectral intensity at 760 nm (near the maximum of the NIR band) as a function of the applied potential using transmission spectroelectrochemical measurements. This wavelength was chosen because in this region there are no DMcT transitions, as was pointed out by Tatsuma et al.,6
so it is possible to study the PAPSAH spectroelectro-chemical behavior with no DMcT interference.
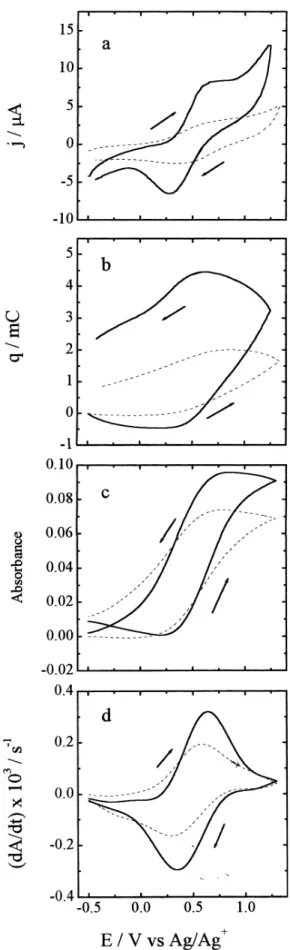
Figure 4a shows the cyclic voltammetry of thin films of PAPSAH (full line) and PAPSAH/DMcT (dotted line) in PC. The redox responses of PAPSAH and the PAPSAH/ DMcT system are clearly observed at ca. 0.5 V. This voltammetry is quite similar to that observed previously by others for PANI and its derivatives in neutral aqueous solutions.14 Figure 4b shows the charges for these two
samples. The charge consumption is not quite reversible for each material, a fact that we attribute to a relatively large contribution of parasitic solvent oxidation (probably of water impurity) to the voltammetric response during the positive scan for both films (water decomposition can occur due to the fairly positive potential at which the scan is reversed). Figure 4c shows the absorbance changes at 760 nm obtained simultaneously with the electrochemical data. In both cases, the absorbance changes are very nearly reversible, with the absorbance values returning to within 15% of their initial values after each scan. The fact that these spectral changes are nearly reversible supports the comments presented above regarding the contributions of solvent oxidation to the observed charge consumption.
this is due to a somewhat greater electrochemical reversibility (i.e. faster overall kinetics) of the PAPSAH/ DMcT system compared to PAPSAH, a finding that is consistent with the previously reported voltammetry of PANI/DMcT films in comparison to pure PANI films.5
Figure 4d shows the derivative of absorbance versus time (or, equivalently, potential) for these two absorbance versus potential curves. The enhanced electrochemical reversibility of the PAPSAH/DMcT system in comparison to the PAPSAH film is also demonstrated here by the sharper peaks of the former compared to the latter.
Reflectance experiments
The use of ITO, which is not transparent in the ultraviolet spectrum region, in the transmission experiments makes it impossible to observe the spectral changes due to DMcT oxidation, which are expected to occur in the range from 200 nm to 400 nm.7 To avoid this
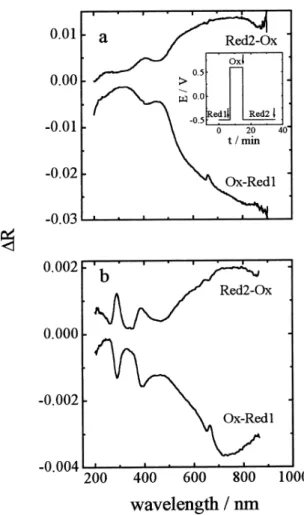
problem, reflectance experiments were conducted using a specularly reflective Au electrode in a cell with a quartz window. For comparative purposes, these experiments were done with both PAPSAH and the PAPSAH/DMcT system. Figure 5a shows the results of reflectance experiments with a thin film of PAPSAH. In this case, the spectra shown are subtraction spectra. For these experiments, the sequence of applied potentials was: a) application of –0.5 V for 7 min to ensure a fully reduced film prior to acquiring the initial spectrum, b) application of +0.6 V for 15 min to produce the oxidized form, and c) application of –0.5 V for 20 min to regenerate the reduced form. The first subtraction spectrum, labeled as Ox-Red1, is the difference between the reflectance spectrum for the oxidized form (taken 15 min after applying a potential of +0.6 V) and that for the initial reduced form (the initial spectrum, taken after 7 min of applying a potential of –0.5 V). This difference spectrum clearly shows the appearance during oxidation of a very broad absorption with an onset near 500 nm and decreasing reflectance (increasing absorption) continuing to 900 nm (the instrument cutoff). An additional, well-defined band with
max of 420 nm also
appears as the result of oxidation. By analogy to previous spectroscopic assignments for PANI18,19 and PAPSAH,15,16
these bands can be attributed to the production of polarons (radical cation sites) during oxidation of PAPSAH. One also observes a weak difference band at ca. 250 nm, which is probably due to small changes in the -* transitions
between the reduced and oxidized states of PAPSAH.15,16
The spectrum labeled Red2-Ox in Figure 5a is the difference spectrum between the spectrum of the final reduced form (first oxidized at +0.6 V for 15 minutes as
above, then reduced at –0.5 V for 20 min) and that of the oxidized form (taken 15 min after applying a potential of +0.6 V as above). This difference spectrum shows three discernible positive-going bands, two smaller relatively narrow ones at 250 nm and 420 nm and a very broad band centered near 750 nm, demonstrating that the polaron bands that appear during oxidation are removed during the subsequent reduction of the film. This clearly demonstrates that the redox transition for the PAPSAH thin film in PC is reversible.
Figure 5b shows the results of an identical experiment with a film of the PAPSAH/DMcT system. The protocol for changes in the applied potential was the same as that described above for the PAPSAH film, and the labels have the same meanings. The upper spectrum in Figure 5b shows the result of oxidation of the PAPSAH/DMcT thin film (i.e. Ox-Red1). In this case, the
max of the NIR band that
appears during oxidation is shifted to ca. 700 nm.
Appearance of the polaron band at 420 nm is not as easily observed due to the presence of two new negative-going bands at 285 nm and at 385 nm. These are in the spectral region in which one would expect contributions from DMcT and the DMcT polymer.7 We return to a discussion
of these below. As can be seen in the lower curve in Figure 5b, application of a negative potential (-0.5 V) after the initial oxidation results in the disappearance of the spectral bands discussed above, demonstrating reduction of the film. This shows that the redox processes for the PAPSAH/ DMcT thin film are reversible, just as for the PAPSAH thin film alone.
In order to corroborate the origin of the difference bands at 285 nm and 385 nm in Figure 5b, the spectra of DMcT and of the DMcT polymer were obtained. Because of extremely low solubility of the DMcT polymer, these two spectra were obtained using diffuse reflectance of these two materials as solids diluted in solid KBr and are shown in Figure 6. Consistent with previous observations for DMcT,7 a negative-going reflectance band with l
max of ca.
320 nm is observed, as well as a band at shorter wavelength (near 220 nm). The spectrum of the DMcT polymer shows significant spectral intensity near 290 nm, with a long wavelength tail extending out to ca. 500 nm. Note that if PAPSAH does, in fact, mediate charge transfer to and from the DMcT redox couple, when comparing these spectral features to those in Figure 5, one expects to observe bands that result from the difference between the spectra of DMcT and the oxidized DMcT polymer.
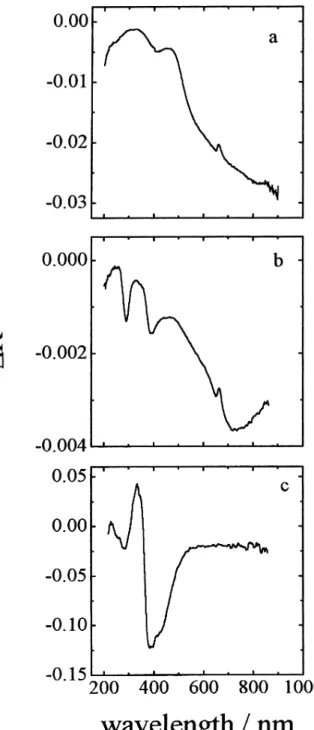
To facilitate the comparisons, the difference spectra for PAPSAH (i.e. Ox-Red1, curve a), for PAPSAH/DMcT (i.e. Ox-Red1, curve b) and for DMcT (i.e. the spectrum of the oxidized DMcT polymer minus that of DMcT in its
Figure 5. Difference reflectance spectra of (a) PAPSAH film and (b) PAPSAH/DMcT film. Supporting electrolyte: 1mol L-1 LiClO
4 in
PC. The insert diagram shows the potential vs time program used for obtaining the spectra. Arrows indicate the times where reflectance spectra were taken.
reduced form, curve c) are collected together in Figure 7. As can be seen in curve c, the difference bands at 285 and 385 nm agree both in shape and position with those in curve b. This very strongly suggests that these bands result from the disappearance of DMcT and the simultaneous appearance of the oxidized DMcT polymer during
oxidation of the PAPSAH/DMcT film. Thus, these bands are assigned to changes in the oxidation state of DMcT that occur during the redox processes for PAPSAH.
It is significant that one does not observe an independent, unique redox response for DMcT (Figure 4). Further, given that the self-exchange rate constant for DMcT must be very low, these results strongly suggest that the spectrally observed redox state changes of DMcT must be due to mediation of charge to and from DMcT by the PAPSAH. While this mediation has been discussed in several previous electrochemical investigations of DMcT and PANI/DMcT thin films,1-5 the present results represent
its first unambiguous spectroscopic demonstration.
Conclusion
These results demonstrate that thin films of PAPSAH exhibit nearly reversible voltammetric and spectroscopic behavior in PC that is similar to that observed in aqueous HCl solutions.13 The only significant difference is the blue
shift of the 800 nm band, which is due to the unavailability of sufficient numbers of protons to generate a highly conductive material in PC. The results also reveal that composite mixtures of PAPSAH and DMcT can be produced, exhibit similarly reversible electrochemical and spectroscopic behavior comparable to the observed for PANI/DMcT system.1-5 Significantly, the results
demonstrate that PAPSAH mediates charge to the DMcT redox couple in these composite films.
Acknowledgements
We are grateful to the Office of Naval Research and the National Science Foundation (INT-9724792) for support of the work at UW and to CNPq (910043/97-3) and FAPESP (Brazilian agencies) for support of the work at USP.
References
1. Sotomura, T.; Uemachi, H.; Takeyama, K.; Naoi, K.; Oyama, N.; Electrochim. Acta1992, 37, 1851.
2. Sotomura, T.; Uemachi, H.; Miyamoto, Y; Kaminaga, A.; Oyama, N.; Denki Kagaku1993, 61, 1366.
3. Kaminga, A.; Tatsuma, T.; Sotomura, T.; Oyama, N.; J. Electrochem. Soc. 1995, 142, 47.
4. Tatsuma, T, Sotomura, T.; Sato, T.; Buttry, D. A.; Oyama, N.; J. Electrochem. Soc. 1995, 142, L182.
5. Oyama, N.; Tatsuma, T.; Sato, T.; Sotomura, T.; Nature1995, 373, 598.
6. Tatsuma, T.; Yokoyama, Y.; Buttry, D. A.; Oyama, N.; J. Phys. Chem. B1997, 101, 7556.
7. Shouji, E.; Buttry, D. A.; J. Phys. Chem.B1998, 102, 1444. 8. Tatsuma, T.; Mitsui, H.; Shouji, E.; Oyama, N.; J. Phys. Chem.
1996, 100, 14016.
9. Shouji, E.; Matsui, H.; Oyama, N.; J. Electroanal. Chem. 1996, 417, 17.
10. Shouji, E.; Yokoyama,Y.; Pope, J. M.; Oyama, N.; Buttry, D. A.; J. Phys. Chem. B1997, 101, 2861.
11. Orata, D.; Buttry, D. A.; J. Am. Chem. Soc.1987, 109, 3574. 12. Torresi, R. M.; Córdoba de Torresi, S. I.; Gabrielli, C.; Keddam,
M.; Takenouti, H.; Synth. Met.1993, 61, 291.
13. Kim, E.; Lee, M.-H.; Moon, B. S.; Lee, C.; Rhee, S. B.; J. Electrochem. Soc.1994, 141, L26.
14. Malinauskas, A.; Holze, R.; Electrochim. Acta1998, 43, 521. 15. Chen, S.A.; Hwang, G. W.; J. Am. Chem. Soc. 1995, 117,
10055.
16. Varela, H.; Torresi, R. M.; Buttry, D. A.; J. Braz. Chem. Soc.
2000, 11, 32.
17. Varela, H.; Torresi, R. M.; Buttry, D. A.; J. Electrochem. Soc.
2000, 147, 32.
18. Lee, K; Heeger, A. J.; Cao, Y.; Synth. Met.1995, 72, 25. 19. Mac Diarmid, A. G.; Epstein, A. J.; Synth. Met. 1995, 69, 179. 20. Córdoba de Torresi, S. I.; Bassetto, A. N.; Transferetti, B. C.; J.
Solid State Electrochem. 1998, 2, 24.
Received: November 26, 2001 Published on the web: June 12, 2002