Printed in Brazil - ©2002 Sociedade Brasileira de Química 0103 - 5053 $6.00+0.00
* e-mail: [email protected]
Electrochemical Biosensor-Based Devices for Continuous Phenols Monitoring in
Environmental Matrices
Renato S. Freirea, Nelson Durána,b and Lauro T. Kubota*,a
a
Instituto de Química, Universidade Estadual de Campinas, CP 6154, 13083-970 Campinas - SP, Brazil
b
Núcleo de Ciências Ambientais - Universidade de Mogi das Cruzes, Mogi das Cruzes - SP, Brazil
Desenvolveu-se um método de análise em fluxo para a determinação contínua de compostos fenólicos em matrizes ambientais, usando-se uma membrana de diálise para amostragem e biossensores a base de lacase e tirosinase para a detecção destes compostos. A resposta dos biossensores frente a diferentes compostos fenólicos foi investigada. O biossensor a base de lacase mostrou uma alta sensibilidade para guaiacol e cloroguaiacol, enquanto que o biossensor de tirosinase foi mais sensível para fenol e clorofenol. Ambos os biossensores apresentaram respostas seletivas para concentrações destes compostos em níveis micromolares. Limites de detecção de 1,1 x 10⁻⁷ mol
L-1 para guaiacol e de 1,9 x 10⁻⁷ mol L-1 para cloroguaiacol foram obtidos usando-se o biossensor a
base de lacase. Empregando-se o biossensor a base de tirosinase obteve-se limites de detecção de 1,5 x 10⁻⁷ mol L-1 para fenol e de 9,0 x 10⁻⁸ mol L-1 para clorofenol. O método de análise em fluxo
proposto apresentou um faixa linear de trabalho entre 1,0 mol L-1 e 100,0 mol L-1, nas condições
operacionais otimizadas dos biossensores (biossensor a base de lacase: pH 5,0 e potencial de trabalho 0 mV vs Ag/AgCl; biossensor a base de tirosinase: pH 5,0 e potencial de trabalho 50 mV vs
Ag/AgCl). Uma amostra real de efluente papeleiro foi analisada pelo sistema proposto e pelo método colorimétrico de referência e os resultados discutidos.
A flow system method for continuous determination of phenolic compounds in environmental matrices was employed using a dialysis membrane sampler and laccase- and tyrosinase-based biosensors as detector. The biosensors response to different phenolic compounds was investigated. The laccase-based biosensor showed high sensitivity to guaiacol and chloroguaiacol, while the tyrosinase-based biosensor was more sensitive to phenol and chlorophenol. Both of the biosensors presented highly selective measurements of micromolar concentration of these compounds. Detection limits around 1.1 x 10⁻⁷ mol L-1 for guaiacol and 1.9 x 10⁻⁷ mol L-1 for chloroguaiacol could be
estimated for the laccase-based biosensor. Using the tyrosinase-based biosensor detection limits of 1.5 x 10⁻⁷ mol L-1 for phenol and 9.0 x 10⁻⁸ mol L-1 for chlorophenol were observed. The proposed
flow method presented a linear response range between 1.0 mol L-1 and 100.0 mol L-1, in the
optimized operational conditions (laccase-based biosensor: pH 5.0 and 0 mV vs Ag/AgCl as working potential; tyrosinase-based biosensor: pH 5.5 and 50 mV vs Ag/AgCl as working potential). Real paper mill effluent sample was analyzed by this system and by the reference colorimetric method and the results were discussed.
Keywords: amperometric biosensors, continuous monitoring, environmental samples, phenolic
compounds
Introduction
The release of phenol and its chlorinated derivatives into the environmental is of great concern. A considerable number of organic pollutants, widely distributed throughout the environment, have a phenolic structure.
Thus, there is a continuously increasing demand for selective and sensitive detection of phenols since these toxic compounds are widely used in the manufacture of various industrial products1,2 and they are known to be
widespread as components of industrial waste.3,4 Phenolic
great variety of organs and tissues, primarily lungs, liver, kidneys and genito-urinary system.5,6 Many phenols,
especially chlorophenols, are known for their persistency in the environment and propensity for bioconcentration and biomagnification.7
Several procedures have been developed for the determination of phenolic compounds, such as chromoto-graphic techniques, fluorimetric and spectrophotometric methods.6,8 However, these techniques do not easily allow
continuous monitoring in real samples. They are expensive, time-consuming, need skilled operators, and sometimes require preconcentration and extraction steps that increase the risk of samples loss.9,10
Biosensors represent promising tools to supplement already existing techniques, due to their intrinsic characteristics such as selectivity, low cost, potential for miniaturization/automation, and for the construction of simple flow devices for fast continuous monitoring.11
Laccase and tyrosinase are copper containing enzymes that catalyse the reduction of molecular oxygen by different electron donors, e.g. phenolic compounds. In these reactions oxygen is reduced directly to water without the intermediate formation of hydrogen peroxide; on the other hand, phenols are converted into quinones and/or radical species.12 These
liberated species can be electrochemically reduced to allow convenient low-potential detection of the phenolic analytes. Reagentless devices based on the immobilization of laccase or tyrosinase onto various carbon or platinum transducers have been developed.4,13 Such devices rely on monitoring
the liberation of the enzymatic products or the consumption of the oxygen. These two enzymes display different substrate selectivity and mechanisms, and thus the use of laccase and tyrosinase-based biosensors on the analysis of environmental samples allows the detection of different phenolic compounds.12,14
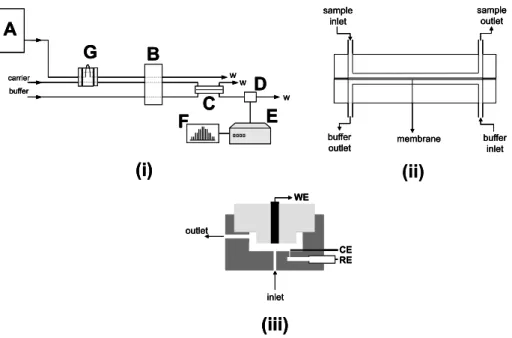
In this paper different electrochemical biosensors were evaluated for on-line monitoring of phenolic compounds. The sensitivity and selectivity capabilities of laccase and tyrosinase-based biosensors were coupled to the advantages of an integrated flow injection/analyte collector system. Operational conditions and performance of this device are reported for monitoring guaiacol, chloroguaiacol, phenol and chlorophenol.
Experimental
Reagents
All solutions were prepared with deionized water. Laccase (from Coriolus hirsutus, E.C. 1.10.3.2, 416 U mg-1)
was received from SynectiQ Corp. (Dover, New Jersey,
USA). Tyrosinase (2000 U mg-1, EC 1.14.18.1) was
purchased fromICN (USA). Bovine serum albumin was
received from Sigma, 1-cyclohexyl-3-(2-morpholinoethyl) carbodiimide metho-p-toluenosulfonate, glutaraldehyde (50% (m/v), water solution, reagent grade), p-chlorophenol, phenol and guaiacol were purchased from Aldrich, and chloroguaiacol, from Research Chemical. Tests were carried out using a phosphate buffer solution (pH 5.0, 10 mmol L-1)
and the Kraft E1 (alkaline extraction) effluent was obtained from a paper mill industry in the Campinas city region (São Paulo State, Brazil) which processes Eucalyptus
grandis wood. The effluent was stored at 4 0C in glass
flasks and used without previous filtration or any other treatment.
Apparatus and procedure
Experiments were performed with the Amperometric Biosensor Detector (Universal Sensors, Inc.; New Orleans/ USA) model 3001 ABD amperometric analyzer, connected to a X-Y-t recorder model RB 101 from ECB (São Paulo/ Brazil). Amperometric experiments were carried out applying a potential step (of 0 mV and 50 mV vs Ag/AgCl, for laccase and tyrosinase-based biosensors, respectively) and recording the current transient. All experiments were carried out at room temperature.
Electrode pre-treatment and enzyme immobilization
The glassy carbon electrodes were pre-treated at a potential of +2.00 V vs Ag/AgCl for 5 minutes in 0.1 mol L-1
phosphate buffer (pH 7.2), using a platinum wire as the counter electrode. After this process, the electrodes were allowed to react for 2 h with a solution of
1-cyclohexyl-3-(2-morpholinoethyl)carbodiimide metho-p
-tolueno-sulfonate in 0.05 mol L-1 acetate buffer at pH 4.8 (with
continuous stirring).17 Then, the electrodes were dipped,
during 30 minutes, into a solution of glutaraldehyde (10 mg mL-1), bovine serum albumin (6 mg mL-1) and
enzyme (300 U mL-1 laccase or 900 U mL-1 tyrosinase).
Flow injection system
in deionized water for 10 minutes was placed between the two blocks, which were tightly clamped with six bolts. The flow rates employed, for both internal and external solution, were 1.6 mL min-1, previously optimized.
Colorimetric analysis
The total phenols concentration was determinated by Folin-Ciocalteu’s reaction according to APHA.15,16 In this
analysis, 1 mL of sample was mixed with 250 L of
0.1 mol L-1 tartarate-carbonate buffer at pH 12 and 25 L of Folin-Ciacalteu’s reagent.15 The mixture was kept in
reaction during 30 minutes at 20 °C, then the absorbance of the solution was monitored at 700 nm, using a Hitachi spectrophotometer Model U-2000.
Results and Discussion
Detection of phenols using the enzyme electrodes shows several advantages over both soluble enzyme assay methods and direct electrochemical oxidation.4,17 The
signal amplification through cycling of the quinone product has been shown to increase the sensitivity of the enzyme electrode assay response.18,19 Compared with the
electrochemical oxidation of phenols, the biosensors tend to be more stable, selective, and better suited to potential environmental applications. These favorable characte-ristics result from the reduction of quinones species that
avoids its polymerization over the electrode surface. In addition, the biosensors require a lower potential (around 0.0 V) than direct oxidation (around + 1.0 V), becoming less expose to interferences.17,18
An enzyme electrode configuration relies on the biochemical recognition and the electrochemical trans-duction. The effectiveness of the biosensor is determined by the manufacture procedure, mainly in the bioactive component immobilization procedure.13 In order to obtain
a highly sensitive sensing surface, a substrate molecule needs to be able to interact without steric restrictions. One approach to this is the covalent protein immobilization, ideally at a site that does not affect the active site of the enzyme. In this study, the immobilization of laccase or tyrosinase over the glassy carbon electrode surface was promoted using carbodiimide and glutaraldehyde
simultaneously. As described previously,13 this
immobilization procedure has produced laccase-based biosensors with better stability and sensitivity, and these characteristics are desired for detector in flow systems.
The behavior of these biosensors in a flow system was investigated in terms of working potential, pH, stability and sensitivity to different phenolic compounds.
Effect of working potential
The variation of biosensors response with the applied potential was investigated using 200 L injections of
50 mol L-1 guaiacol and 50 mol L-1 phenol for laccase and tyrosinase-based biosensor, respectively. The flow rate employed was 1.60 mL min-1 and a 0.1 mol L-1 phosphate
buffer solution at pH 5.0, used as the carrier. As shown in Figure 2 (a), laccase-based biosensor redutive detection of the liberated enzymatic products starts at 250 mV vs Ag/ AgCl, with a maximum response around 0 mV, keeping this plateau until –300 mV. A very similar behavior was observed for the tyrosinase-based biosensor, which starts its response at 300 mV, and signal rises sharply up to 150 mV and decreases above 0 mV.
Thus, further experiments were carried out at 0 mV for laccase-based biosensor and at 50 mV for tyrosinase-based biosensor. This working potential range is very favorable, since few contaminants expected to be present in environmental samples are reduced at low potentials (between 0.1 and 0.0 V vs Ag/AgCl). In addition, in these potentials low noise level and low background currents were observed.
Effect of pH
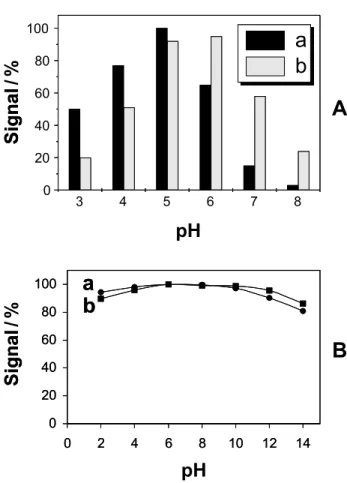
Figure 3 (A) presents the influence of pH upon the laccase (a) and tyrosinase-based (b) biosensors response, both of the biosensors showed a good sensitivity over a broad range (between 4.0 and 7.0). It is observed that the tyrosinase-based biosensor has a broader range than the laccase-based, remaining at 50% of its signal in pH 7.5 against only 7% for the laccase biosensor. Despite these
observed pH range being relevant for some natural water samples, several industrial effluents are strongly alkalines, with pH between 10 and 12.16 A dialysis sampler can be
used for collection of phenolic compounds and their internal deliver to be amperometricaly detected by the biosensor avoiding this drawback, since the internal solution will give optimal conditions.9,20 Figure 3 (B)
shows the influence of the sample pH upon the laccase- (a) and tyrosinase-based (b) biosensors response when the dialysis system was employed. Such profiles were obtained using a 10 mmol L-1 phosphate buffer solution at pH 5.0
(for laccase-based biosensor) or pH 5.5 (for tyrosinase-based biosensor), flow-rate of 1.6 mL min-1 and 0 mV (laccase
biosensor) or 50 mV (tyrosinase biosensor) vs Ag/AgCl. It can be observed that, using this dialysis system, the responses of the biosensors are almost independent on the sample pH, over the range between 2 and 14, improving the monitoring applications.
0 20 40 60 80 100
0 2 4 6 8 10 12 14
pH
b
a
0 20 40 60 80 100
0 2 4 6 8 10 12 14
S
igna
l/
S
igna
l
%
S
igna
l/
S
igna
l
%
b
a
B
a
b
A
3 4 5 6 7 8
0 20 40 60 80 100
pH
a
b
Figure 3. Variation of the current intensity with pH for the system without (A) and with membrane (B); laccase-based (a) and tyrosi-nase-based (b) biosensors. Potential step to 0.0 V and 0.05 vs Ag/ AgCl; for laccase- and tyrosinase-based biosensors, respectively. Other conditions, as in Figure 2.
Figure 2. Hydrodynamic voltammogram for laccase-based biosen-sor (a) and tyrosinase-based biosenbiosen-sor (b) inserted in a flow injec-tion system (flow-rate: 1.6 mL min-1). Injected volume: 220 L of
50 mol L-1 guaiacol (for laccase biosensor) and 220 L of
50 mol L-1 phenol (for tyrosinase biosensor); carrier solution:
phos-phate buffer (10 mmol L-1, pH 5.0); and internal solution:
phos-phate buffer (10 mmol L-1, pH 5.0 and 5.5; for laccase- and
Stability
The laccase (a) and tyrosinase-based (b) biosensors showed a good long-term stability, as verfied by data from repetitive analysis recorded at 10 minutes intervals over a prolonged period (presented in Figure 4). The laccase-based biosensor showed a relative standard deviation of 2.8% for a series of 24 successive measurements of 50 mol L-1 guaiacol. A similar stability, RSD = 3.9%, was observed for the tyrosinase-based biosensor using 50 mol L-1 phenol. In addition, the bioactivity was maintained over a long period, 90% for laccase- and 73% for tyrosinase-based biosensor after 300 determinations.
Analytical curves for phenolic compounds
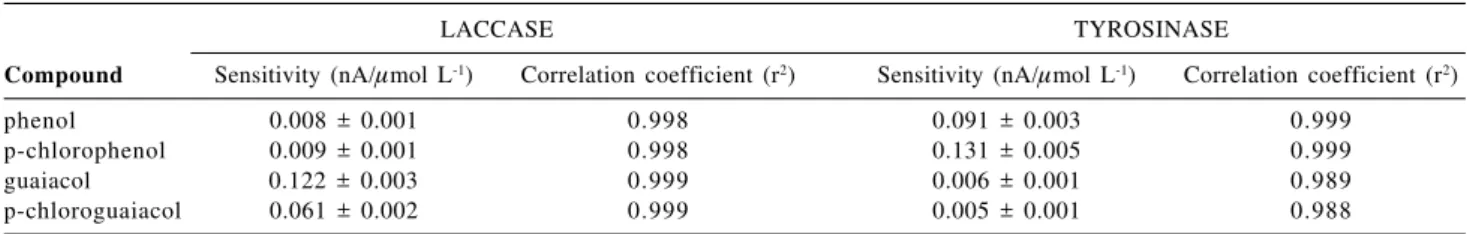
The laccase and tyrosinase biosensors offer different selectivity for different phenolic compounds. Table 1 shows the sensitivity of these two enzymatic biosensors for different phenolic compounds: phenol, p-chlorophenol, guaiacol and p-chloroguaiacol. The laccase-based sensor displays high sensitivity to p-chloroguaiacol and guaiacol.
However, this biosensor showed a low response for phenol and p-chlorophenol. On the other hand, the tyrosinase-based biosensor was effective in detecting p-chlorophenol and phenol, but ineffective for p-cloroguaiacol and guaiacol.
Strictly linear calibration curves were obtained from
1.0 mol L-1 to 10.0 mol L-1 for guaiacol and
chloroguaiacol, using the laccase-based biosensor; as well as for phenol and chlorophenol, using the tyrosinase-based biosensor. These analytical curves were adjusted by the equations: i(nA) = 0.122 ± 0.003 (nA/mol L-1) [guaiacol],
r2 = 0.999; i(nA) = 0.061 ± 0.002 (nA/
mol L-1) [chloroguaiacol], r2 = 0.999; i(nA) = 0.091 ± 0.003 (nA/ mol L-1) [phenol], r2 = 0.999 and i(nA) = 0.131 ± 0.005 (nA/mol L-1) [chlorophenol], r2 = 0.999 .
Detection limits around 1.1 x 10⁻⁷ mol L-1 for guaiacol
and 1.9 x 10⁻⁷ mol L-1 for chloroguaiacol could be estimated
for the laccase-based biosensor considering 3B. Using the tyrosinase-based biosensor detection limits of 1.5 x 10⁻⁷
mol L-1 for phenol and 9.0 x 10⁻⁸ mol L-1 for chlorophenol
were obtained. The responses of both biosensors were linear in the concentration range up to 100 mol L-1.
Analysis of paper mill effluent
The selectivity and sensitivity of the biosensors allow a convenient quantification of phenolic compounds in relevant environmental samples. Figure 5 displays the response of the tyrosinase-based biosensor to phosphate buffer (A) and untreated Kraft E1 paper mill effluent (B) samples containing increasing levels of phenol. A favorable response is observed in both media up to 10 mol L-1 concentration changes (a-e).These results show that this biosensor can be used successfully to performe a selective analysis of phenols in complex environmental samples with high sensitivity and low interference.
A similar behavior was also observed for the laccase-based biosensor upon the response for guaiacol/ chloroguaiacol in the same kind of sample (data not shown). Table 2 shows the phenolic content in a Kraft E1 paper mill effluent sample, detected using the laccase,
tyrosinase-Table 1. Laccase- and tyrosinase-based biosensor sensitivity for different phenolic compounds, obtained from the analytical curves with n= 10. Flow injection conditions and potential, as in Figure 2
LACCASE TYROSINASE
Compound Sensitivity (nA/mol L-1) Correlation coefficient (r2) Sensitivity (nA/mol L-1) Correlation coefficient (r2)
phenol 0.008 ± 0.001 0.998 0.091 ± 0.003 0.999
p-chlorophenol 0.009 ± 0.001 0.998 0.131 ± 0.005 0.999
guaiacol 0.122 ± 0.003 0.999 0.006 ± 0.001 0.989
p-chloroguaiacol 0.061 ± 0.002 0.999 0.005 ± 0.001 0.988
Figure 4. Stability experiments for laccase-based (a) and tyrosi-nase-based (b) biosensors. Injected volume: 220 L of 50 mol L-1
guaiacol (for laccase biosensor) and 220 L of 50 mol L-1 phenol
based biosensors and the Folin-Ciocalteu colorimetric method. The phenolic concentrations found are completely different from each other. The difference between the colorimetric method and the biosensors can be explained due to the low selectivity presented by the colorimetric method. This method shows a positive response to a broad range of compounds, such as phenols, tannins and lignins. In addition, lignin fragments are abundant in this kind of effluent since lignin is one of the components of wood, which is the raw material of pulp and paper. On the other hand, the biocatalytic recognition of the biosensors offers highly selective measurements of the studied phenolic compounds. Thus, these biosensors do not allow the total phenol quantification as a consequence of their inherent selectivity. Another analytical method should be used to estimate the total phenolic content in the paper mill effluent. However, this is not a simple task, since this kind
of effluent presents more than 300 different organic compounds,16 a high pH value, suspense solids and others
extreme conditions, which difficult the continuous analysis of the target compounds. Therefore, using biosensors designed to monitor compounds that are really important in the environmental aspects, may provide more accurate information about the effluent.
The difference between the biosensors concentrations, once again is because these biosensors have distinct sensitivity for different phenolic compounds, as showed in Table 1. A careful analysis of data in Table 2 suggests that both biosensors responded basically to phenol, and this is an indication that guaiacols concentration, in the studied effluent, is very low. Although these biosensors showed different selectivity for different phenolic compounds, they cannot distinguish between each individual analyte. Thus, the combination of these two or more biosensors can improve the accuracy and reliability of phenols determination. Moreover, coupling different selective biosensors is an alternative to promote an efficient screening of a broad range of phenolic compounds, which will give a more useful chemical information than the total phenol content in the effluent.
Conclusion
The experiments described in this work illustrate the ability to employ a flow system with a dialysis sampler and a bio-electrochemical detector for continuous monitoring phenolic compounds in environmental samples. The laccase and tyrosinase-based biosensor showed good sensitivity and stability. In addition, the selectivity of these enzymes allowed the detection and quantification of some phenolic compounds in samples of environmental interest. Continuous measurement of phenolic compounds in the affected natural environment can provide an appropriate feedback during the characterization or remediation of contaminated sites. Thus, the proposed flow system can increase the quality of monitoring activities.
Finally, the proposed device can be readily adapted
for accommodating similar enzyme-based probes (e.g.
peroxidase-based) for other phenolic compounds, which will allow a selective monitoring of several compounds in complex environmental matrices.
Acknowledgments
Financial support from FAPESP, PRONEX.
Figure 5. Tyrosinase-based biosensor response to phosphate buffer at pH 5.5 (A) and untreated Kraft E1 paper mill effluent under natural pH and ionic strength (B) samples containing increasing levels of phenol 10 mol L-1 (from a to e). Potential step to 0.0 V and
0.05 vs Ag/AgCl; for laccase- and tyrosinase-based biosensors, re-spectively. Flow injection conditions, as in Figure 2.
Table 2. Results obtained by the standard addition method for the phenolic content determination in Kraft E1 paper mill effluent, employing different biosensors (laccase and tyrosinase), as well as the colorimetric method
Method Phenolic content (mg L-1)
Laccase biosensor 0.19 ± 0.01
Tyrosinase biosensor 2.74 ± 0.10
References
1. Ortega, F.; Domínguez, E.; Burestedt, E.; Emneus, J.; Gorton, L.; Marko-Varga, G.; J. Chromatogr., A1994, 675, 65. 2. Rogers, K.M.; Becker, J.Y.; Cembrana, J.; Chough, S.H.;
Talanta2001, 54, 1059.
3. Russell, I.M.; Burton, S.G.; Anal. Chim. Acta1999, 389, 161. 4. Rossato, S.S.; Freire, R.S.; Durán, N.; Kubota, L.T.; Quim.
Nova2001, 24, 77.
5. Canofeni, S.; DiSario, S.; Mela, J.; Pilloton, R.; Anal. Lett. 1994, 27, 1659.
6. Nistor, C.; Emneus, J.; Gorton L.; Ciucu, A.; Anal. Chim. Acta 1999, 387, 309.
7. Gundersen, J.L.; Macintyre, W.G.; Hall, R.C.; Environ. Sci. Technol.1997, 31, 188.
8. Wang, J.; Trends Anal. Chem.1997, 16, 84.
9. Wang, J.; Lu, J.; Ly, S.Y.; Tian, B.; Adeniyi, W.K.; Armendariz, R.A.; Anal. Chem.2000, 72, 2659.
10. Wang, J.; Chen, Q.; Anal. Chim. Acta1995, 312, 39. 11. Cosnier, S.; Fombon, J.J.; Labbe, P.; Limosin, D.; Sens.
Ac-tuators, B1999, 59, 134.
12. Yaropolov, A.I.; Kharybin, A.N.; Emnéus, J.; Marko-Varga, G.; Gorton, L.; Anal. Chim. Acta1995, 308, 137.
13. Freire, R.S.; Durán, N.; Kubota, L.T.; Talanta2001, 54, 681. 14. Freire, R.S.; Thongngamdee, S; Durán, N.; Wang, J.; Kubota,
L.T.; Analyst2001, 127, 258.
15. APHA, Standard Methods for Examination of Water and Waste-water, 17th ed., Amer. Publ. Health Ass. N0 5550: New York
1989.
16. Freire, R.S.; Kubota, L.T.; Durán, N.; Environ. Technol.2001,
22, 897.
17. Burestedt, E.; Narvaez, A.; Ruzgas, T.; Gorton, L.; Emneus, J.; Dominguez, E.; Marko-Varga, G.; Anal. Chem. 1996, 68, 1605.
18. Rogers, K.R.; Becker, J.Y.; Cembrano, J.; Electrochim. Acta 2000, 45, 4373.
19. Marko-Varga, G.; Emneus, J.; Gorton, L.; Ruzgas, T.; Trends Anal. Chem.1995, 14, 319.
20. Freire, R.S.; Duran, N.; Kubota, L.T.; Anal. Chim. Acta2002, in press.
Received: December 19, 2001 Published on the web: June 12, 2002