Printed in Brazil - ©2003 Sociedade Brasileira de Química 0103 - 5053 $6.00+0.00
A
r
ti
c
le
*E-mail: [email protected]
# Present address: Departamento de Química, Faculdade de Ciências,
Universidade Estadual Paulista, 17033-360 Bauru - SP, Brazil
Spectrophotometric Flow-Injection Determination of Sulphite in White Wines Involving
Gas Diffusion through a Concentric Tubular Membrane
Denise Melo, Elias A. G. Zagatto*, Ivanildo L. Mattos# and Nelson Maniasso
Centro de Energia Nuclear na Agricultura, Universidade de São Paulo, CP 96, 13400-970 Piracicaba - SP, Brazil
Um sistema de análises por injeção em fluxo é proposto para a determinação espectrofotométrica de sulfito em vinhos brancos. O método envolve conversão do analito a SO2, difusão gasosa através de uma membrana semi-permeável de Teflon®, coleta em um fluxo alcalino (pH 8), reação com verde de Malaquita (VM) e monitorização a 620 nm. O projeto do sistema foi simplificado empregando-se uma membrana tubular concêntrica. Foram investigados: concentrações dos reagentes, pH dos fluxos doador e receptor, intensidade iônica, temperatura, temporização, adição de agentes tensoativos e presença de interferentes em potencial presentes na matriz vinho. A sensibilidade analítica melhorou (ca. 100%) adicionando-se cloreto de cetil piridinio (CPC). O sistema proposto é robusto e deriva em linha base não é observada durante períodos de até 4 horas de operação. São requeridos apenas 400 µL de amostra e 0.32 mg VM por determinação. O sistema processa 30 amostras por hora, fornecendo resultados precisos (d.p.r. < 0.015 para 1.0 - 20.0 mg L-1 SO
2) e concordantes com os obtidos por um procedimento alternativo.
A flow-injection system is proposed for the spectrophotometric determination of sulphite in white wines. The method involves analyte conversion to SO2, gas diffusion through a Teflon® semi-permeable membrane, collection into an alkaline stream (pH 8), reaction with Malachite green (MG) and monitoring at 620 nm. With a concentric tubular membrane, the system design was simplified. Influence of reagent concentrations, pH of donor and acceptor streams, temperature, timing, surfactant addition and presence of potential interfering species of the wine matrix were investigated. A pronounced (ca. 100%) enhancement in sensitivity was noted by adding cetylpyridinium chloride (CPC). The proposed system is robust and baseline drift is not observed during 4 h operating periods. Only 400 µL of sample and 0.32 mg MG are required per determination. The system handles 30 samples per hour, yielding precise results (r.s.d. < 0.015 for 1.0 - 20.0 mg L-1 SO
2) in agreement with those obtained by an alternative procedure.
Keywords: concentric tubular membrane, sulfite, spectrophotometric flow analysis, micellar medium, gas diffusion
Introduction
Gas diffusion is a very effective means to enhance selectivity in analytical chemistry, and was implemented in a flow-injection system in the pioneer work dealing with the development of an improved procedure for determination of total CO2 in plasma.1 Since then, the
strategy has been often exploited, as it is efficiently accomplished in flow systems.2,3 Generally, a
gas-permeable membrane is placed between two liquid streams,
one of them - the donor stream - containing the sample under processing. The analyte is converted to a volatile chemical species that is removed from the sample matrix and collected by other stream - the acceptor stream.
Sulphite is an important preservative in the food and beverage industry, especially with regard to wine production4-8 and its content should be strictly controlled
in view of its potential toxicity.6-8 The maximum allowable
concentrations of the sulphite species in foodstuffs are defined in specific legislation, in accordance to the type of wine and the sugar contents.8
and the released SO2 is collected by an alkaline solution.9-11
In flow-injection analysis, the step of gas separation takes place only at a defined site of the manifold whereas the other involved processes take place in a continuous manner along the entire analytical path.
The drawback can be circumvented by taking advantage of the concentric tubular reactor,12,13 whose
potentialities and limitations were recently discussed.14
With this tube-in-tube configuration, the gas diffuses through the wall of the inner tube towards the external tube, and the process becomes continuous. The approach was applied to the determination of free chlorine in natural waters,12 dissolved inorganic carbon in river waters13 and
ethanol in spirits.14 Its usefulness for monitoring purposes
was also demonstrated.15
The aim of this work was then to develop a flow-injection system for the spectrophotometric determination of sulphite in white wines, using a tubular membrane for in-line gas diffusion. The method is based on AOAC and Malachite green is the main reagent.9 Considering that a
micellar medium is interesting for modifying the analyte/ reagent interactions, thus improving sensitivity and/or selectivity,16,17 the establishment of an organised medium
was also investigated.
Experimental
Reagents, standards, samples
All solutions were prepared with analytical-reagent quality chemicals and freshly distilled/deionised water.
The 1000 mg L-1 sulphite stock solution was weekly
prepared by dissolving 0.197 g Na2SO3 in 100 mL of water. Working standard solutions (0.0 - 20.0 mg L-1 SO
2) were
freshly prepared by diluting the above stock with a solution containing the chemical species commonly present as macro-constituents of most of the commercially available wines (wine matrix solution): 0.7 % m/v citric acid, 0.3 % m/v sucrose, 0.2 % m/v glycerol, 0.4 % m/v tartaric acid, 2.2 x 10⁻³ mol L-l phosphoric acid and 10 % (v/v) ethanol.18
The sample carrier stream (R1 - Figure 1) was a 0.5 mol L-1
citric acid solution. Reagent R2 was a 0.3 mol L-1 phosphate
plus 1.0 x 10⁻³ mol L-1 cetylpyridine chloride (CPC)
solution that was prepared by dissolving 26.1 g K2HPO4 plus 1.8 g CPC in about 450 mL of water, adjusting the pH to 8.0 ± 0.1 with 0.3 mol L-1 phosphoric acid, and filling
the volume up to 500 mL with water. The reagent R2 was stored under 5 °C and equilibrated to room temperature immediately before use.
The Malachite green (MG) stock reagent was prepared by dissolving 20 mg of the dye [oxalate form,
C48H50N4O4.2C
2H2O4, M = 927.02 g mol L
-1] plus 0.85 g
KH2PO4 in 100 mL of water, letting it to stand overnight and filtering through a 0.45 µm cellulose membrane.9 This
stock reagent was stable for at least one month if stored at 5 °C. For preparation of the MG working reagent (R3 -Figure 1), a 30-fold water dilution of the above stock was performed.
White wine samples were purchased from a local supermarket and analysed without any prior treatment.
Apparatus
The flow system comprised a model 432 Femto spectrophotometer with a tubular flow cell (ca. 18-mm optical path, 200 µL illuminated volume) connected to a model 111 Kipp & Zonen strip-chart recorder, a model IPC-8 Ismatec peristaltic pump, a model 100 Fanem thermostatic water-bath and accessories. The injector was similar to that used in earlier work.14
The sampling loop, reactors and transmission lines were build-up with i.d. 0.7 mm polyethylene tubing of the non-collapsible wall type. For transferring the gaseous species from the donor to the acceptor stream, a concentric tubing reactor similar to the model TB-21-05 Sumitome Electric was used. It comprised an inner tubular Teflon membrane (i.d. = 1.0 mm, wall thickness = 0.5 mm) inside a polyethylene tube (i.d. = 4.0 mm, wall thickness = 1.0 mm). Connection was done as in earlier work.14
Flow diagram
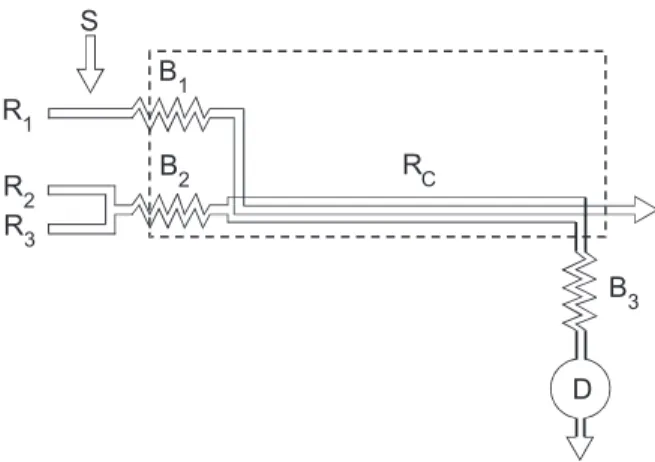
The flow system for sulphite determination in white Figure 1. Flow diagram. S = sample injected by means of a 80 cm (ca.. 400 µL) sampling loop; R1 = 0.5 mol L-1 citric acid (0.8 mL
min-1); R
2 = 0.3 mol L
-1 phosphate buffer, pH 8.0 (0.8 mL min-1); R 3
= 6.67 mg L-1 MG (1.6 mL min-1); R
C = concentric tubing reactor (15
wines is outlined in Figure 1 that indicates the injector in the sampling position. The sample is aspirated to fill the 80 cm sampling loop, and the selected volume (400 µL) is further intercalated into the sample carrier stream (R1 0.8 mL min-1 citric acid). With this design, the sample
plug is not inserted into a chemically inert carrier stream, and the Schlieren effect does not manifest itself because the stream is not directed towards detection. Moreover, citric acid is in large excess and sample/carrier mixing is not critical. Thereafter, the processed sample flows through the inner tube of the concentric tubing reactor RC towards waste. During passage through RC, the released SO2 diffuses through the semi-permeable tubular Teflon® membrane and
is collected into the acceptor stream that flows through the external tube of the concentric tubing reactor. The acceptor stream is continuously formed by the confluence of R2 (0.8 mL min-1) and R
3 (1.6 mL min
-1) reagents. The
SO2 collection induces the MG discolouring reaction8,10
to proceed inside RC. Thereafter, the sample zone is directed towards the flow cell and its passage through it results in a transient absorbance lowering recorded as an inverted peak with height proportional to the sulphite concentration in the injectate.
The concentric tubing reactor was immersed into the thermostatic water-bath, and the transmission lines B1 and B2 were selected as short as possible (30 cm). Reactor B3 was kept under ambient conditions and its length (50 cm) was enough to provide good cooling conditions.
Procedure
Conditions for MG discoloration were investigated by injecting 0.0 - 20.0 mg L-1 SO
2 solutions into the
flow-injection system shown in Figure 1. System optimisation was based on the univariate approach and the figure of merit was the recorded peak height after adjusting baseline absorbance to about 0.9. Repeatability was always checked after triplicate injections.
Influence of acidity of the donor stream was studied by varying the citric acid concentration (0.3 - 0.8 mol L-1) in
the sample carrier stream, and the pH of the acceptor stream was studied within 6.0 and 12.0 by adjusting the amounts of the buffer constituents.
Flow rates were individually studied within 0.4 and 1.8 mL min-1. Direct and reverse flows for the donor and
acceptor streams were tested. In these experiments, different RC lengths (7.5, 15.0 and 30.0 cm) were used. In addition, the rotation speed of the peristaltic pump was varied within 50 and 200% of the nominal speed (corresponding to flow rates in Figure 1).
Influence of temperature was verified by varying the
temperature of the water bath into which RC, B1 and B2 were immersed (20 - 60 °C).
The feasibility of sensitivity enhancement through the establishment of a micellar medium was investigated by adding the cetylpyridinium chloride (CPC), or dodecyl-trimethyl ammonium bromide (DTAB) surfactants at different concentrations (1.0 x 10⁻⁴ - 1.0 x 10⁻¹ mol L-1) to
reagent R2.
After system dimensioning, the main analytical characteristics were evaluated. Repeatability was estimated in terms of relative standard deviations of results obtained after ten-fold processing of typical white wine samples, and accuracy was checked by running samples already analysed by an alternative flow-injection procedure.9
Results and Discussion
Concentration of citric acid in the sample carrier stream is of paramount relevance as it influences the acidity for sulphite liberation. Loss of sensitivity was observed for concentrations within 0.1 and 0.3 mol L-1, and no analytical
signal was recorded in the extreme situations of citric acid concentrations < 0.1 mol L-1. A pH value of about 2 is
recommended,10 and this was attained inside R C with
0.5 mol L-1 citric acid in R
1.
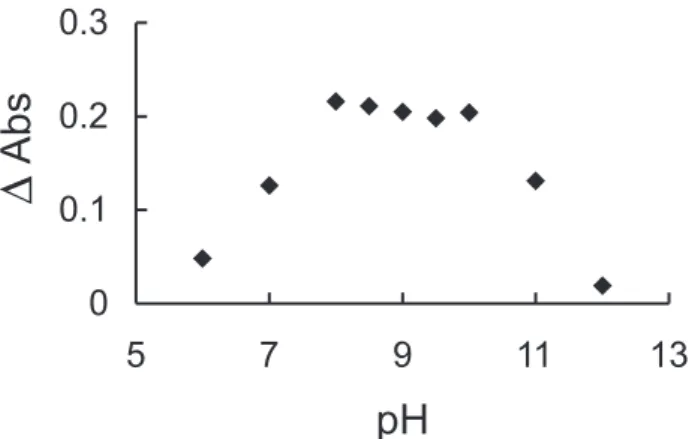
Regarding alkalinity of the acceptor stream, R2 + R3, experiments were carried out under different conditions (6 < pH < 12) and the results are shown in Figure 2. Analysis of this figure reveals that this was also a very important parameter in the system design and that better SO2 collection was accomplished under pH 8. This matches the pH value of 8.8 recommended by Sullivan10 and was
attained with 0.3 mol L-1 K
2HPO4 in the acceptor stream.
The Malachite green concentration also manifested itself as a very important parameter, as it defines the
Figure 2. Influence of alkalinity of the acceptor stream. Figure refers to 8.0 mg l-1 SO
2 injected into the system of Figure 1. The pH
baseline. Improved measurement conditions were attained for 6.67 µg L-1 MG that means a 30-fold water dilution of
the MG reagent stock. The corresponding baseline absorbance was then about 0.9.
Regarding the concentric tubing reactor, similar results were obtained for tube lengths of 15 and 30 cm, although a 20% deterioration in sampling rate was noted when using the longer reactor. Increasing the reactor length only slightly increased the recorded peak height because of the simultaneous modifications in available time for development of the physicochemical processes and in sample dilution. As losses in sensitivity (40 - 50%) were noted for a too short (7.5 cm) reactor, the length of the concentric tubing reactor was set as 15 cm.
Individual variations in flow rates of the donor and acceptor stream showed a tendency similar to that theoretically expected.19 In addition, increasing the
rotation speed of the peristaltic pump led to a lowering in analytical signal due to the reduction of the mean sample resident time inside RC. The increase in sensitivity with the decrease in rotation speed followed an asynthotic behaviour. The rotation speed however could not be reduced indefinitely in view of the compromise between sampling rate and sensitivity. Moreover, the sample processing time could not be increased at will, because only the determination of the labile form of the sulfite is aimed. The flow rates specified in Figure 1 were then selected to provide a sample resident time inside the main reactor similar to that recommended by AOAC.9 With these
selected flow rates, the linear speed of donor and acceptor streams were about the same. Finally, it should be reported that only slight modifications in sensitivity were noted when the direction of the acceptor stream was inverted.
Temperature of the water bath should also be taken into account for system design, as a 30% enhancement in sensitivity was verified when it was raised from 20 to 35 °C (Table 1). For T > 45 °C, air bubbles in the analytical path were eventually noted, leading to a deterioration in repeatability and to a baseline drift. The temperature was then set as 35 °C.
The establishment of a micellar medium proved to be relevant to enhance sensitivity (Table 2). Best results were obtained when the cationic surfactants dodecylttrimethyl-ammoniumbromide (DTAB) or CPC were added with enhancements in analytical signal of up to 100%. Although any of these surfactants could be used, CPC was selected in view of the more pronounced influence in sensitivity. When it was added to all reagents, problems with base line were observed. Therefore, CPC was added only to R2 reagent and a stable baseline was noted. With the selected concentration of 0.01 mol L-1 CPC, there as a guarantee
that the critical micellar concentration inside the inner tube of the concentric reactor was surpassed. At this point, it should be stressed that addition of anionic or non-ionic surfactants could not be recommended. In fact, when the anionic surfactant sodium dodecylsulphate, SDS, was added (0.001 mol L-1), losses in analytical signal of about
90% were noted whereas concentrations beyond 0.01 mol L-1 led to a suppression of the analytical signal. The
non-ionic surfactant Triton X-100 presented similar characteristics as the SDS, yet less pronounced. With Triton X-100 at concentrations > 1.0 % air bubbles were formed inside the analytical path, impairing the measurement.
The macro constituents usually present in matrix wine plays an important role in system performance. When the matrix concentration18 was halved or doubled, positive or
negative variations in peak height (about 20%) were observed. It is interesting to report that these variations were not caused by modifications in the ethanol content. Therefore, it was decided to add the wine matrix to all working standard solutions. With this strategy, variations in sample matrix did not interfere when the concentration of the main components were modified by + 50 or - 50%. This confidence interval is compatible with the natural variation expected in the white wine samples.
Table 2. Influence of surfactant concentration. Concentration refers to reagent R2 (Figure 1) and expressed in % v/v (Triton X-100) or mol L-1 (DTAB and CPC). Variations in analytical signal expressed in
% of the signal obtained without surfactant
Surfactant Concentration Variation in analytical signal
Triton X-100 0.02 - 95
0.2 - 77
2.0 0
DTAB 0.001 100
0.01 115
0.1 8 0
CPC 0.001 9 0
0.01 150
0.1 6 0
= loss in repeatability (r.s.d. > 0.2).
Table 1. Influence of temperature. Table refers to the temperature of the water bath into which RC is immersed. Values expressed in absorbance related to either baseline or peak minimum
Temperature/°C Baseline 6.0 mg L-1 20.0 mg L-1
2 0 0.730 0.629 0.512
2 5 0.711 0.625 0.408
3 0 0.640 0.539 0.271
4 0 0.602 0.549 0.248
5 0 0.562 0.470 0.231
Conclusions
The proposed system is very robust and stable and yields precise results, the relative standard deviations of results being usually < 0.03. For a typical white wine with 12.3 mg L-1, it was estimated as 0.015 after eleven
successive replications. With the concentric tube reactor, measurement repeatability was superior in relation to the system with a planar membrane. Also, an important characteristic of the cylindrical membrane separator when compared with the laminar membrane is that the cylindrical shape improves mixing conditions, thus avoiding the need for a long mixing coil between the diffusion unit and the detector. After using the system for several weeks, it was realised that variations in hydrodynamic pressure affects the tubular Teflon® membrane in a lesser extent that it
does in relation to the planar Teflon® membrane. Moreover,
the probability of leaking is lower relatively to other alternatives already proposed for gas diffusion in flow analysis19 that usually require several screws and include
an inner chamber that should be eventually opened and closed. The approach is then attractive to be used in combination with distillation, pervaporation and related techniques.
With an organised reaction medium, sensitivity is improved without deteriorating the analytical characte-ristics of the flow-based procedure.
The analytical curve is linear within the 1.0 – 20 mg L-1
SO2 range (r > 0.999; n = 6). About 30 samples are run per hour meaning 0.32 mg MG per determination. Detection limit was estimated as 0.4 based on the 3σB above the mean level for a field blank (σB = estimated standard deviation of the field blanks).20
The proposed flow system is not directly applicable to red wines.8 Analysis of Table 3 permits one to conclude
that fairly accurate results are obtained. Finally, it should be stressed that the system has been applied to routine analysis during the last four weeks, and no major troubles (or impregnation of the inner tube walls) has been noted
Table 3. Comparative results. Sulfite contents in white wines as determined with the reference, AOAC9 and proposed procedures.
Data in mg L-1 SO 2
Sample AOAC This work
1 15.290 ± 0.550 15.310 ± 0.310
2 1.720 ± 0.070 1.740 ± 0.020
3 0.398 ± 0.013 0.399 ± 0.010
4 17.030 ± 0.250 17.580 ± 0.300
Acknowledgements
Partial support from FAPESP and a CNPq grant to one of the authors (D.M.) is appreciated. F.L. Mendes is thanked for her participation in the initial stages of development of this project.
References
1. Baadenhuijsen, H.; Seuren-Jacobs, H.E.H.; Clin. Chem. 1979, 25,443.
2. Trojanowicz, M.; Flow Injection Analysis: Instrumentation and Applications, World Scientific Publishing Co: Singapore, 2000. 3. Teshima, N.; Sakai, T.; J. Flow Injection Anal. 2000, 17, 219. 4. Azevedo, C.M.N.; Araki, K. Toma, H.E. Agnes, L.; Anal. Chim.
Acta 1999, 387, 175.
5. Su, X.; Wei, W.; Nie, L.; Yao, S.; Analyst 1998, 123, 221. 6. Decnop-Weever, L.G.; Kraak, J.C.; Anal. Chim. Acta1997,
337, 125.
7. Zhi, Z.; Rios, A.; Valcarcel, M.; Analyst 1995, 120, 2013. 8. Curvello-Garcia, A.S.; Controlo de Qualidade dos Vinhos.
Química Enológica e Métodos Analíticos, Instituto de Vinha e do Vinho: Lisbon, 1988.
9. Cunniff, P. ed.; Official Methods of Analysis of AOAC Interna-tional, AOAC International: Arlington, 1995, ch. 47, p.33. 10. Sullivan, J.J.; Hollingworth, T.A.; Wekell, M.M.; Meo, V.A.;
Etemad-Moghadam A.; Phillips J.G.; Gump, B.H.; J. Assoc.
Off. Anal. Chem. 1990, 73, 223.
11. Ferreira, A.M.R.; Lima, J.L.F.C.; Lopes, T.I.M.S.; Rangel, A.O.S.S.; J. Int. Sci. Vigne Vin 1993, 27, 67.
12. Aoki, T.; Munemori, M.; Anal. Chem.1983, 55, 209. 13. Motomizu, S.; Toei, K.; Kuwaki, T.; Oshima, M.; Anal. Chem.
1987, 59, 2930.
14. Mattos, I.L.; Sartini, R.P.; Zagatto, E.A.G.; Reis, B.F.; Gine, M.F.; Anal. Sci. 1998, 14, 1005.
15. Mattos, I.L.; Zagatto, E.A.G.; Anal. Sci. 1999, 15, 63. 16. Hinze, W.L.; Colloid and Interface Science, M. Kerker: New
York, 1976.
17. Prieto, A.M.G.; Pavon, J.L.P.; Cordero, B.M.; Analyst 1994,
119, 2447.
18. Luca, G.C.; Reis, B.F.; Zagatto, E.A.G.; Montenegro, M.C.B.S.M.; Araújo, A.N.; Lima, J.L.F.C.; Anal. Chim. Acta 1998, 366, 193.
19. Karlberg, B.; Pacey, G.; Flow Injection Analysis. A Practical Guide, Elsevier: Amsterdam, 1989.
20. Thompson, M.; Anal. Proc. 1987, 24, 355.
Received: November 19, 2001
Published on the web: March 14, 2003