*e-mail: [email protected]
1. Introduction
Lignocellulosic material is one of the most promising natural, abundant and renewable feedstock for application in several areas such as bio-fuels, animal feeding, ine chemicals and composites1-3. Large amounts of lignocellulosic wastes are generated through agro-based processes such as biofuels and food productions are often disposed improperly in municipal landills causing social, economic and technological harms. Thus, the use of lignocellulosic waste as reinforcement in polymer composites is an alternative to add value to the production process and to minimize these residues in the landills. The agroindustrial residues were studied in this work in order to compare their properties as ibers and to verify if these ibers could be used as reinforcement in polymer composites. Three agroibers wastes were studied: pineapple crown’s iber, rice husks and residual textile ibers. These wastes were chosen because i) Brazil is the third largest producer of pineapple (Ananas comosus) with around 7% of the world production what represents the world’s ifth tropical fruit in harvested area. In the pineapple fruit, the crown corresponds to about 25 wt % and it is disposed as waste4-6; ii) rice is the third largest cereal crop of the world and the major staple diet which supplies 77.90 kg / capita / year of Asia population in 2007[7]. The rice husk is a by-product generated abundantly from rice milling industries and corresponds to about 20 wt % of the total rice production7,8. Most of these wastes of rice husk are disposed in a landill and causes serious environmental pollution because of its dificult decomposition in the soil due to the high level of lignin and silica7,9; iii) Textile industry generates a great amount of cotton waste which is mainly composed of cellulose
(about 90 wt %)10. In the cotton spinning process, wastes are generated by taking a large volume in landills. In this work, ibers of pineapple crown’s iber (PCF), rice husks (RH) and cotton residue textile ibers (RTF) were characterized and evaluated for the use in polymeric composites.
2. Experimental
2.1. Materials
Textiles residues of cotton ibers were supplied by industries of Itupeva city, SP, Brazil. Perola cultivars (Ananas comosus) pineapples, were used to extract the pineapple crown and were obtained from popular markets of São Paulo-SP, Brazil. Rice husks were supplied by Industries in the South of Brazil.
2.2. Preparation of ibers
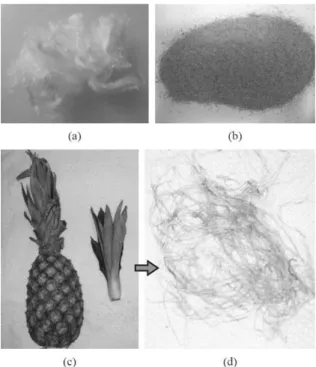
PCF were manually extracted and washed with distilled water at 80 °C for 1h, and after they were dried in a conventional oven at 100 °C for 3 h[11]. RH was ground in mills knives (Model SL-31, Solab) and sifted with a 7 mm sieve. RTF was used as received. Figure 1 shows picture of RTF, RH and PCF.
2.3. Characterization
The morphology of the ibers was analyzed by SEM (Jeol, Model JSM-6010 LA) with the samples coated with gold prior to the measurement (Bal-Tec, Multi Coating System MED020).
The diameter of about 100 ibers (for PCF and RTF) was determined using a micrometer calliper (Mitutoyo, ± 0.001 mm). The diameter was measured at 3 points placed in three random locations along the length of ibers.
Characterization of Fibers from Pineapple’s Crown, Rice Husks and
Cotton Textile Residues
Karen de Souza do Pradoa, Márcia Aparecida da Silva Spinacéa*
aCentro de Ciências Naturais e Humanas – CCNH, Universidade Federal do ABC,
Av. dos Estados, 5001, Bangu, CEP 09210-580, Santo André, SP, Brazil
Received: July 23, 2014; Revised: May 17, 2015
Fibers from pineapple’s crown (PCF), rice husks (RH) and cotton textile residues (RTF) were characterized by SEM, X-ray diffraction, FTIR and thermogravimetric analysis. Moisture content, water absorption, density and the distribution of the diameter of the ibers were also evaluated. RTF showed cylindrical microstructure with smooth surface, PCF showed cellular structure and the microstructure of RH is globular, showing cell pattern of the outer surface epidermis which is well organized and has a corrugate structure. PCF and RH showed crystallographic planes of cellulose I and RTF showed a mixture of cellulose I and cellulose II. RTF showed the highest degree of crystallinity and the lower moisture content and water absorption. These results occur because the RTF has no hemicellulose, as veriied by FTIR. Comparing the three ibers, the RTF presented the lowest density and diameter. Furthermore, the onset degradation temperature of RTF was 40 °C higher than the PCF and the RH.
The density of the ibers was determined in triplicate at 23 °C using a picnometer. The moisture content was evaluated in triplicate at room humidity of 55 (± 7) % and a temperature of 25 (± 3) °C. For this purpose, about 1 g of RH and RTF and about 0.2 g PCF were maintained in a conventional oven at 100 (± 5) °C and the weight of the specimens were measured until constant weight.
The water absorption was determined in triplicate using about 1 g of RH and RTF and about 0.2 g PCF. The ibers were dried at 100 (± 2) °C for 2 h and maintained at 24 (± 6) °C in a desiccator containing a saturated solution of calcium chloride to maintain the relative humidity at 54 (± 7) %. The weight of the samples was measured until constant weight, which occurred at about 600 h. The percentage of moisture content and water absorption were calculated using Equation 1 where WI and WF are initial and inal weight of specimens.
W = (WI-WF) / WI*100 (1)
X-ray diffraction (XRD, Rigaku, model MinilexII) patterns were measured with CuKα radiation (λ = 1.541 nm) at 30 kV and 15 mA. Scattered radiation was detected in the range of (2θ) angle from 5 to 40° at a speed of 2°/min. The resulting diffractograms were deconvoluted using Magic Plot Pro 1.5 software® and the crystallinity index (CI) of the ibers was calculated by the Equation 2.
CI(%)=(1-Aa/AT)*100 (2)
Where Aa is the value of area under the curve related to the amorphous phase and At is the total area of the diffractogram5,12.
FTIR (Perkin Elmer Frontier) measurements were made using KBr pellets in the range of 450-4000 cm–1, with 4 cm–1 resolution and 64 scans. The mixture of KBr
and ibers was dried (100 °C, 1 h) and the samples were prepared immediately before measurement.
Thermogravimetric analysis (TGA Q500 V20.8 TA Instruments) was made in the temperature range from 25 °C to 800 °C, at a heating rate of 10 °C.min–1 in N
2 atmosphere, with a low rate of 50 mL.min–1 using about 10 mg for each sample.
3. Results and Discussion
3.1. SEM of the ibers
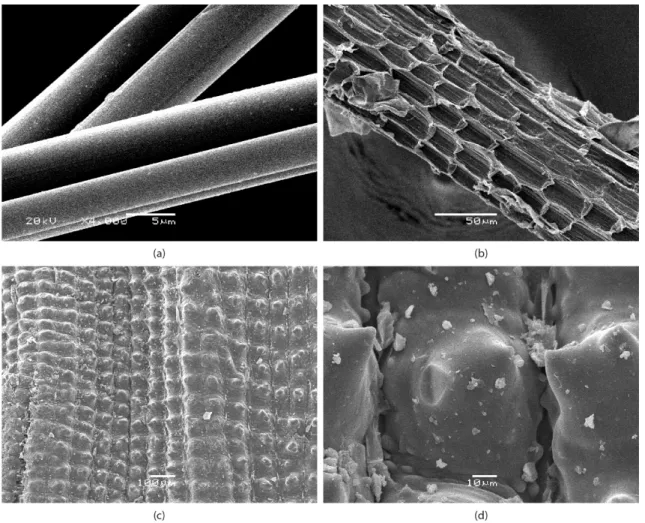
RTF shows cylindrical microstructure with smooth surface and low diameter variation along the iber (Figure 2a). This morphology is the result of pretreatment of the iber during textile process. Nevertheless, the microstructure of PCF (Figure 2b) shows cellular structure and these cells together form ibrils with tissues connected with each other at several locations along the length to form ibers. Similar to most lignocelulosic ibers, PCF shows irregular cross section and diameter variations13. Furthermore, it can be seen traces of waxy materials and some damage in the iber surface due to manual extraction process.
The microstructure of RH is globular showing cell pattern of the outer surface epidermis which is well organized and has a corrugate structure. The regular spherical platelets of almost equal sizes (40-50 μm) appearing in parallel rows, (Figure 2c and d). Silica probable is present all over the iber, but it is particularly abundant in the protuberances and ibers of the outer epidermis and somewhat less abundant in the inner epidermis adjacent to the rice kernel13-15.
Mechanical interlocking due RH and PCF ibers surface roughness can promote adhesion interaction, mainly of the van der Waals type, between iber and polymeric matrix16,17.
3.2. X-ray diffraction (XRD)
In the lignocellulosic ibers, cellulose is the main component and it has crystalline structure, while other components such as hemicellulose and lignin are amorphous18. Cellulose has a crystalline structure due to hydrogen bonding interaction and van der Waals forces between adjacent molecules19.
Native cellulose consists of two polymorphs, triclinic designated as Iα and monoclinic polymorph designated as Iβ. According to the Sugiyana system20 the peaks at 2 θ = 14.7, 16.1 and 22.5° correspond to polymorph of cellulose I and can be designated as (1 10), (110) and (200) crystallographic planes; while in the Meyer-Mark-Misch system the planes have indices (101), (10 1) and (002), respectively20.
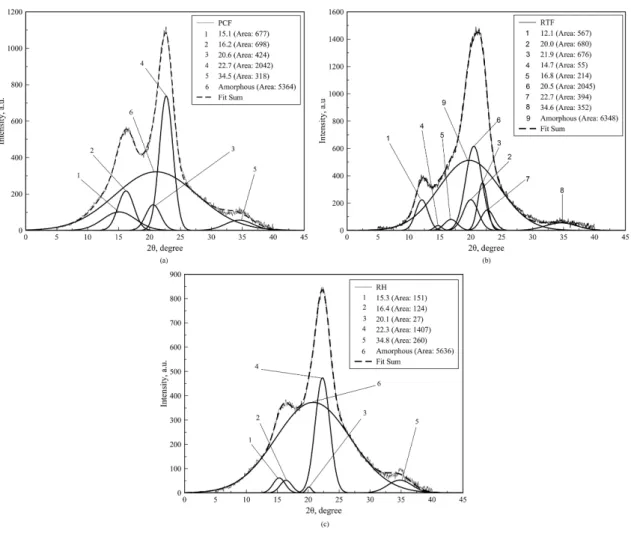
Figure 3 shows RTF, PCF and RH diffractograms and the deconvolution was done in order to examine the intensities of the diffraction bands and to establish the crystalline and the amorphous areas more precisely.
The deconvolution of the X-ray diffraction proiles showed the presence of ive peaks and an amorphous phase (Figure 3). For RH ibers, it was observed peaks at 2θ = 15.3, 16.4, 20.1, 22.3 and 34.8° and for PCF ibers were observed peaks at 2θ = 15.1, 16.2, 20.6, 22.7 and 34.5°, which were assigned to the (101), (10 1), (012), (002) or (200) and (040) crystallographic planes of cellulose I21.
assigned to the (1 10), (101) and (200) crystallographic planes of cellulose II22,23, besides the peaks of cellulose I, (Figure 3). Cotton iber was mercerized during the pre-treatment in the textile industry and this could change the crystalline structure of the cellulose contained in the resulting RTF ibers. On the other hand, PCF and RH were not pretreated and show polymorphic form, characteristic of native cellulose.
The crystallinity index (CI) calculated for PCF, RTF and RH ibers were 43.7, 44.0, and 25.9%, respectively. Higher crystallinity could leads to higher tensile strength of the ibers24 and thereby improves the reinforcement of the polymeric composites.
3.3. Fourier-Transform infrared spectroscopy
(FTIR)
FTIR spectra of the PCF, RTF and RH ibers (Figure 4) showed the typical bands of lignocellulosic ibers.
The strong bands at 3390, 3440 and 3432 cm–1 of PCF, RTF and RH, respectively, are attributed to stretching of hydroxyl groups. For RTF these bands were broader than the ones observed for PCF and RH ibers. This could be explained since RTF ibers contain cellulose II and its structure is able to form more hydrogen bonds than cellulose I, resulting in a major broadening of these bands25.
For all samples, the bands around 2910 to 2930 cm–1 are attributed to C-Hn asymmetric stretching present mainly in cellulose, which was the major component of the lignocellulosic ibers21,26.
The band near 1735 cm–1 assigned to unconjugated stretching vibrations of the C=O of the carbonyl and acetyl groups in the xylan component of hemicellulose was clearly seen on PCF ibers and it was observed as a shoulder for RH ibers27-30. Absence of the peak at 1735 cm–1 leads to the hypothesis that RTF has undergone to alkaline scouring so most of the hemicelluloe were removed. The three ibers show a peak at about 1640 cm-1 related to absorbed water21,31-33
The bands at the region from 1000 to 1500 cm–1 are assigned to the aromatic region related to the lignin: the bands at 1460, 1425 and 1220 cm–1 are characteristic of C-H and C-O deformation, bending or stretching vibrations of many groups in lignin and other carbohydrates28,29,34.
Cellulose show bands characteristics at 1055 and 1162 cm–1 attributed to C-OR stretching and antisymetric bridge C-OR-C stretching of cellulose, respectively28. The peak at 1320 cm–1 is attributed to the O-H of alcohol groups and the band at 1420-1430 cm–1 is assigned to aromatic skeletal vibrations associated to C-H in plane deformation of cellulose. The band at 1375 cm–1 is related to C-H bending in cellulose and hemicellulose29.
The band at around 1420-1430 cm–1 is related to crystalline structure and the band at 898 cm-1 is attributed to CH deformation in the amorphous region of the cellulose35.
For RH ibers, the intense band at 1047 cm−1 is related to the stretching vibrations of silicon-oxygen tetrahedrons and the relatively weak absorption band at 795 cm−1 is most
likely linked to the symmetric and asymmetric vibrations of the Si−O bonds in the silicon-oxygen network36.
FTIR of the lignocellulosic materials identiies the presence of components such as hemicellulose which giving them a hydrophilic character. This hydrophilic character could reduce the compatibility of the ibers with polymer matrices.
Figure 3. Deconvoluted X-ray diffractograms of PCF, RTF and RH ibers.
3.4. Density and diameter distribution of the
ibers
The values of density RTF, RH and PCF ibers (Table 1) are comparable with other ibers density, such as sisal (1500 kg/m³), banana iber (1350 kg/m³) and the not-treated cotton, whose density varies between 1500-1600 kg/m³, and all of them have densities smaller than the glass iber (2500 kg/m³)1,37. This result is interesting because the use of these ibers can reduce the weight of the polymeric composites.
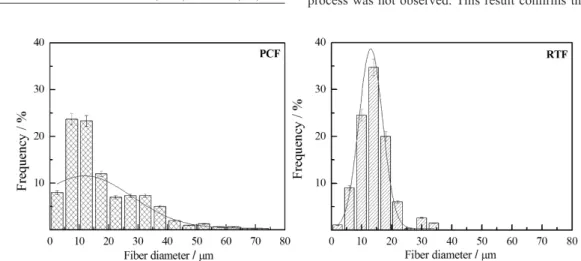
The average diameter of RTF and PCF ibers are 14 (± 5) and 18 (± 12) µm, respectively; these values are lower than other ibers such as curaua and sisal38. The average diameter of RH was not determinate due this material was milled resulting in particle morphology whose dimensions depend on milling conditions.
The ibers diameter distributions were shown in Figure 5. RTF ibers presented smaller diameter dispersion than PCF ibers. This result can be due to the extraction method of PCF ibers that causes fails in the iber surface resulting in irregularity of the diameters. On the other hand, RTF ibers showed homogeneous diameter along the iber due chemical treatment that extracted part of lignin, hemicellulose and particles on the iber surface during textile process39.
Diameter distribution can be used to determine the aspect ratio (length/diameter) of the iber. Aspect ratio (ratio between the length and the iber diameter) is an important parameter to be taken into account in the improvement of iber-matrix adhesion40.
3.5. Moisture content and water absorption
The lignocellulosic ibers moisture content depends on a lot of factors, such as composition, age and climatic conditions for development of the original plant37. Furthermore, it may
also depend on the storage conditions and the time between the extraction and the use of the iber residue. Moisture content in lignocellulosic affects physical and mechanical properties of the composite because cause a decrease in the iber matrix-adhesion.
Table 1 show results of density, moisture content and iber diameter of PCF, RH and RTF
The moisture content of the ibers, dependent on the content of non-crystalline parts and void content of the iber, amounts up to 10 wt % under standard conditions and were normally described in the literature1.
Hemicellulose present in amorphous phase of the ibers have large amount of hydroxyl groups, which interact strongly with water by interactions of hydrogen. Thus, the higher hemicellulose content of the iber increases the afinity with water. Therefore, the PCF ibers have the highest moisture content as can be veriied by FTIR spectrum, which showed a peak at 1735 cm–1 corresponding to hemicellulose. RH ibers present a shoulder at 1735 cm–1 on FTIR spectrum indicating that the hemicellulose content was lower than PCF ibers. The low moisture content of the RTF ibers was related to the treatment of this iber that was subjected to the spinning process, which removes the hemicellulose.
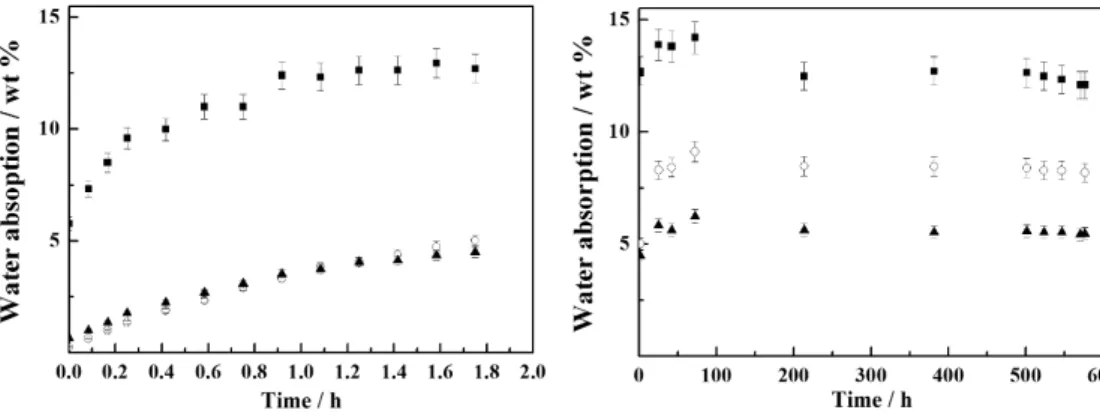
The time required for the ibers to reabsorb moisture is important to evaluate the mechanical properties of the composites during their useful life2. Figure 6 shows water absorption until 600 h of the PCF, RH and RTF.
For all ibers, the major part of water absorption occurred in the irst 2 h and after 600 h PCF, RTF and RH ibers reabsorb 12.5, 5.5 and 8.2% of their total weight, respectively. However, all ibers absorbed less water than their original moisture content until 600 h.
3.6. Thermal properties
TGA and DTG curves of PCF, RH and RTF ibers are shown in Figure 7.
The hemicelluloses degradation process of RH and PCF ibers started at 200 and 207 °C and the temperatures of the maximum rate of degradation were observed at 290 and 291 °C with DTG of 0.35 and 0.25 wt % / °C, respectively; (Figure 7). For RTF ibers, the hemicelluloses degradation process was not observed. This result conirms the result Table 1. Density, moisture content and iber diameter of PCF, RH
and RTF.
Samples Density (kg/m3)
Moisture (wt %)
Fiber diameter
(μm)
PCF 1273 18.0 (± 0.6) 18 (± 12)
RH 1405 10.7 (± 0.5)
-RTF 1492 7.00 (± 0.4) 14 (± 5)
of FTIR that showed the absence of the characteristic peak of hemicelluloses.
The cellulose degradation process for PCF, RH and RTF ibers occurred in the range from 257 to 390 °C and the temperatures of maximum rate of degradation were observed at 366, 350 and 353 °C with DTG of 1.6, 0.8 and 1.8 wt % / °C, respectively. The end of thermal degradation of cellulose was observed above 390 °C (Figure 7).
The solid residue was observed for PCF and RTF ibers above 500 °C and the value was approximately 8.8 wt %, while for RH ibers the solid residue was already observed at a lower temperature (370 °C) and its value (33%) was greater than the one observed for the other ibers. This residual mass may be associated with the presence of silicon15.
The amount of solid residue can also be related to the carbonization of lignin which is slow, and carbon could be the main product. Lignin is composed of three kinds of benzene-propane and is heavily cross-linked; this structure is different of cellulose and hemicellulose, which are composed of polysaccharides. Then, due to this structure the thermal stability of lignin is very high41.
RTF ibers do not contain hemicelluloses and its onset degradation temperature was about 40 °C higher than the PCF and RH ibers. This result is interesting because it allows the use of this iber with polymer matrices having greater thermal stability.
4. Conclusions
The ibers studied showed differences in chemical and physical structures. RTF shows cylindrical microstructure with smooth surface, PCF shows cellular structure and the microstructure of RH is globular showing cell pattern of the outer surface epidermis which is well organized and has a corrugate structure. PCF and RH show crystallographic planes of cellulose I and RTF shows a mixture of cellulose I and cellulose II. RTF showed the major crystallinity degree because it does not have hemicellulose as it was seen by FTIR analysis. Besides, moisture content and water absorption are in accord to this result. Comparing the three ibers, the RTF presented the lowest density (1273 kg/m³) and diameter (14 (± 5) µm). On the other hand, onset degradation temperature of RTF was about 40 °C higher than the PCF and RH ibers. Then, RTF showed the better properties for using in the polymeric composites. Concluding, these ibers of agroindustrial wastes showed properties comparable to commercial lignocelulosic ibers, so they are potentially able to act effectively as the dispersed phase in polymer composites, besides avoiding the deposition of this waste in landills.
Acknowledgements
The authors are grateful for the inancial support provided by the FAPESP (grant No. 2010/17804-7 and 2011/00156-5) and the CNPq (161853/2011-0, 310410/2010-0).
Figure 6. Water absorption: a) irst 2 h and b) full time of the test for (▪) PCF; (°) RH; (▲) RTF.
References
1. Bledzki AK and Gassan J. Composites reinforced with cellulose
based fibers. Progress in Polymer Science. 1999; 24(2):221-274. http://dx.doi.org/10.1016/S0079-6700(98)00018-5.
2. Spinacé MAS, Lambert CS, Fermoselli KKG and De Paoli MA. Characterization of lignocellulosic curaua fibers. Carbohydrate
Polymers. 2009; 77(1):47-53. http://dx.doi.org/10.1016/j.
carbpol.2008.12.005.
3. Iqbal HMN, Kyazze G and Keshavarz T. Advances in the
valorization of lignocellulosic materials by biotechnology: an over view. BioResources. 2013; 8(2):3157-3176. http://dx.doi. org/10.15376/biores.8.2.3157-3176.
4. Cordenunsi B, Saura-Calixto F, Diaz-Rubio ME, Zuleta A, Tiné MA, Buckeridge MS, et al. Carbohydrate composition of ripe
pineapple (cv. perola)and the glycemic response in humans.
Food Science and Technology (Campinas). 2010;
30(1):282-288. http://dx.doi.org/10.1590/S0101-20612010000100041.
5. Sena AR No, Araujo MAM, Souza FVD, Mattoso LHC and Marconcini JM. Characterization and comparative evaluation
of thermal, structural, chemical, mechanical and morphological properties of six pineapple leaf fiber varieties for use in composites. Industrial Crops and Products. 2013; 43:529-537. http://dx.doi.org/10.1016/j.indcrop.2012.08.001.
6. Granada GG, Zambiazi RC, Mendonça CRB. Abacaxi: produção,
mercado e subprodutos. Boletim do Centro de Pesquisa de
Processamento de Alimentos. 2004; 22(2):405-422.
7. Kuan CY, Yuen KH and Liong M-T. Physical, chemical
and physicochemical characterization of rice husk. British
Food Journal. 2012; 114(6):853-867. http://dx.doi.
org/10.1108/00070701211234372.
8. Pauleski DT, Haselein CR, Santini JE and Rizzatti E. Características
de compósitos laminados manufaturados com polietileno de alta
densidade (PEAD) e diferentes proporções de casca de arroz e partículas de madeira. Ciência Florestal. 2007; 17(2):157-170.
9. Chandrasekhar S, Satyanarayana KG, Pramada PN, Raghavan P and Gupta TN. Processing, properties and applications
of reactive silica from rice husk - an overview. Journal of
Materials Science. 2003; 38(15):3159-3168. http://dx.doi.
org/10.1023/A:1025157114800.
10. Satyanarayana KG, Guimarães JL and Wypych F. Studies on lignocellulosic fibers of Brazil. Part I: Source, production,
morphology, properties and applications. Composites Part A:
Applied Science and Manufacturing. 2007; 38(7):1694-1709.
http://dx.doi.org/10.1016/j.compositesa.2007.02.006.
11. Martins MA. Fibra de sisal: mercerização, acetilação e
aplicação em compósitos de borracha de pneu triturado [Thesis].
Campinas: Universidade Estadual de Campinas; 2001. 12. Teodoro KBR, Teixeira EM, Corrêa AC, Campos A, Marconcini
JM and Mattoso LHC. Whiskers de fibra de sisal obtidos sob diferentes condições de hidrólise ácida: efeito do tempo e da temperatura de extração. Polímeros. 2011; 21(4):280-285. http://dx.doi.org/10.1590/S0104-14282011005000048.
13. Luo S and Netravali AN. Interfacial and mechanical properties of environment-friendly “green” composites made from pineapple fibers and poly(hydroxybutyrate-co-valerate) resin. Journal
of Materials Science. 1999; 34(15):3709-3719. http://dx.doi.
org/10.1023/A:1004659507231.
14. de Lhoneux B, Gerlache L, Clemente A, Roda-Santos ML, Menaia JAG and Fernandes TH. Ultrastructural Characterization of Rice Husk Submitted to Different Pretreatments to Optimize its Fermentation. Biological Wastes. 1988; 23(3):163-180. http:// dx.doi.org/10.1016/0269-7483(88)90032-8.
15. Genieva SD, Turmanova SC, Dimitrova AS and Vlaev LT. Characterization of rice husks and the products of its thermal
degradation in air or nitrogen atmosphere. Journal of Thermal
Analysis and Calorimetry. 2008; 93(2):387-396. http://dx.doi.
org/10.1007/s10973-007-8429-5.
16. Eichenlaub S, Gelb A and Beaudoin S. Roughness models for
particle adhesion. Journal of Colloid and Interface Science. 2004; 280(2):289-298. http://dx.doi.org/10.1016/j.jcis.2004.08.017.
PMid:15533399.
17. Persson BNJ and Tosatti E. The effect of surface roughness on
the adhesion of elastic solids. The Journal of Chemical Physics. 2001; 115(12):5597-5610. http://dx.doi.org/10.1063/1.1398300.
18. Johar N, Ahmad I and Dufresne A. Extraction, preparation
and characterization of cellulose fibers and nanocrystals from rice husk. Industrial Crops and Products. 2012; 37(1):93-99. http://dx.doi.org/10.1016/j.indcrop.2011.12.016.
19. Zhang YH and Lynd LR. Toward an aggregated understanding
of enzymatic hydrolysis of cellulose: noncomplexed cellulase systems. Biotechnology and Bioengineering. 2004; 88(7):797-824. http://dx.doi.org/10.1002/bit.20282. PMid:15538721.
20. Mansikkamaki P, Lahtinen M and Rissanen K. The conversion from cellulose I to cellulose II in NaOH mercerization performed in alcohol–water systems: An X-ray powder diffraction study.
Carbohydrate Polymers. 2007; 68(1):35-43. http://dx.doi. org/10.1016/j.carbpol.2006.07.010.
21. Popescu C-M, Singurel G, Popescu M-C, Vasile C, Argyropoulos DS and Willför S. Vibrational spectroscopy and X-ray diffraction
methods to establish the differences between hardwood and softwood. Carbohydrate Polymers. 2009; 77(4):851-857. http:// dx.doi.org/10.1016/j.carbpol.2009.03.011.
22. Gonzales D, Lambert CS and Spinacé MAS. Nanocrystalline
cellulose II extracted from cotton textile. In: Proceedings of the 7th International Symposium on Natural Polymers and
Composites; 2010 September 7-10; Gramado, Brasil. Gramado:
UFGRS; 2010. p. 1827-1830.
23. Cheng Q, Wang S and Han Q. Novel process for isolating fibrils from cellulose fibers by high-intensity ultrasonication. II. Fibril
characterization. Journal of Applied Polymer Science. 2010; 115(5):2756-2762. http://dx.doi.org/10.1002/app.30160.
24. Joonobi M, Harun J, Shakeri A, Misra M and Oksman K. Chemical composition, crystallinity, and thermal degradation
of bleached and unbleached kenaf bast (Hibiscus Cannabinus) pulp and nanofibers. BioResources. 2009; 4:626-639.
25. Bastidas J, Venditti R, Pawlak J, Gilbert R, Zauscher S and Kadla J. Chemical force microscopy of cellulosic fibers.
Carbohydrate Polymers. 2005; 62(4):369-378. http://dx.doi. org/10.1016/j.carbpol.2005.08.058.
26. Adel AM, Abb El-Wahab ZH, Ibrahim AA and Al-Shemy MT. Characterization of microcrystalline cellulose prepared from lignocellulosic materials. Part II: physicochemical properties.
Carbohydrate Polymers. 2011; 83(2):676-687. http://dx.doi. org/10.1016/j.carbpol.2010.08.039.
27. Popescu C-M, Popescu M-C and Vasile C. Structural changes
in biodegradable lime wood. Carbohydrate Polymers. 2010; 79(2):362-372. http://dx.doi.org/10.1016/j.carbpol.2009.08.015.
28. Tanobe VOA, Sydenstricker THD, Munaro M and Amico SC. A comprehensive characterization of chemically treated
Brazilian sponge- gourds (Luffa cylindrica). Polymer
Testing. 2005; 24(4):474-482. http://dx.doi.org/10.1016/j.
polymertesting.2004.12.004.
29. Poletto M, Zattera AJ and Santana RMC. Structural differences
between wood species: evidence from chemical composition,
of Applied Polymer Science. 2012; 126(S1):E337-E344. http:// dx.doi.org/10.1002/app.36991.
30. Siqueira G, Bras J and Dufresne A. Luffa cylindrica as a
lignocellulosic source of fiber, microfibrillated celulose, and cellulose nanocrystall. BioResources. 2010; 5(2):727-740.
31. Liang CY and Marchessault RH. Infrared spectra of crystalline polysaccharides I: Hydrogen bonds in native celulose. Journal
of Polymer Science. 1959; 37(132):385-395.
32. Liang CY and Marchessault RH. Infrared spectra of crystalline
polysaccharides II: Native celluloses in the region from 640 to 1700cm-1. Journal of Polymer Science. 1959; 39:269-278.
33. Schwanninger M, Rodrigues JC, Pereira H and Hinterstoisser B. Effects of short-time vibratory ball milling on the shape of FT-IR
spectra of wood and cellulose. Vibrational Spectroscopy. 2004; 36(1):23-40. http://dx.doi.org/10.1016/j.vibspec.2004.02.003.
34. Silva MC, Lopes OR, Colodette JL, Porto AO, Rieumont J, Chaussy D, et al. Characterization of three non-product
materials from a bleached eucalyptus kraft pulp mill, in view of valorizing them as a source of cellulose fibers. Industrial Crops and Products. 2008; 27(3):288-295. http://dx.doi.org/10.1016/j. indcrop.2007.11.005.
35. Åkerholm M, Hinterstoisser B and Salmén L. Characterization
of the crystalline structure of cellulose using static and
dynamic FT-IR spectroscopy. Carbohydrate Research. 2004; 339(3):569-578. http://dx.doi.org/10.1016/j.carres.2003.11.012.
PMid:15013393.
36. He D, Ikeda-Ohno A, Boland DD and Waite TD. Synthesis and
characterization of antibacterial silver nanoparticle-impregnated rice husks and rice husk ash. Environmental Science & Technology. 2013; 47(10):5276-5284. http://dx.doi.org/10.1021/es303890y.
PMid:23614704.
37. Aquino EMF, Sarmento LPS, Oliveira W and Silva RV. Moisture
effect on degradation of jute/glass hybrid composites. Journal
of Reinforced Plastics and Composites. 2007; 26(2):219-233.
http://dx.doi.org/10.1177/0731684407070030.
38. Spinacé MAS, Janeiro LG, Bernardino FC, Grossi TA and De Paoli M-AD. Poliolefinas Reforçadas com Fibras Vegetais Curtas: Sisal vs. Curauá. Polímeros. 2011; 21(3):168-174. http://dx.doi.org/10.1590/S0104-14282011005000036.
39. Klemm D, Heublein B, Fink HP and Bohn A. Cellulose: fascinating
biopolymer and sustainable raw material. Angewandte Chemie
International Edition. 2005; 44(22):3358-3393. http://dx.doi.
org/10.1002/anie.200460587. PMid:15861454.
40. Puglia D, Terenzi A, Barbosa SE and Kenny JM.
Polypropylene-natural fibre composites. Analysis of fibre structure modification during compounding and its influence on the final properties.
Composite Interfaces. 2008; 15(2-3):111-129. http://dx.doi.
org/10.1163/156855408783810849.
41. Yang H, Yan H, Chen H, Zheng C, Lee DH and Liang DT.