*e-mail: [email protected]
Crack Propagation under Variable Amplitude Loading
Miloudi Abdelkadera, Zemri Mokhtara, Benguediab Mohameda*,
Mazari Mohameda, Amrouche Abdelwahebb
aLaboratory and Reactive Systems, Department of Mechanical Engineering, Djillali Liabes University of Sidi Bel Abbes, Sidi Bel Abbes, Algeria
bLaboratory of Civil Engineering and Geo-Environment LGCgE, Faculty of Applied Sciences, Artois University, Béthune, France
Received: May 29, 2012; Revised: April 26, 2013
Experience shows that a damage induced by a given cycle is dependent on the loading history. In this regard, the objective of this paper is to study and describe the phenomenology of the loading history on crack propagation. Different loading configuration has been considered for fatigue crack propagation of XC38 steel; overload cycles followed by underload and vice versa were considered during propagation. Measure of crack opening has been made using compliance method. It is shown that the main parameters which cause retardation are the residual compressive stresses and the crack closure. The finite element modeling is used to calculate the evolution of residual stress profiles before and after application of the overload-underload cycle. It corroborates the hypotheses on the mechanisms behind, including those proposed on the residual stresses at the crack tip.
Keywords: crack, overload, underload, plastic zone, residual stress
1. Introduction
Maintenance service in aeronautics, transports, machines and installations often face the existence and appearance of cracks in metal components of their structures subjected to a cyclic loading with variable amplitude. In fatigue, loading history is one of the main factors for calculating the number of cycle to rupture Nr of cracked element. The interaction of the loading level influences the crack growth rate. The understanding of the effect of loading history under the spectrum necessitated to consider a simple loading with respect to real spectrum.
It is obvious that the application of an overload during crack propagation leads to a crack growth rate decreasing and in certain cases to arrest. This effect increases the life time of the structure.
The effect of an underload cycle after overloading cycle has not been a topic of many works1-10. It is clear that an
underload cycle modifies the retardation characteristics. The present paper is a continuation to this works. Many authors11-18 have shown that the retardation does not depend
exclusively on microstructure changes due to overload or on the plastic zone geometry, but rather it depends on residual stress associated with plastic deformation currently, it is believed that residual stress and crack closure with the change of plastic due to overload are the main causes of retardation from this point crack point opening measurements are made to put into evidence the beneficial effect of residual stresses. This work presents a study of the influence of an overload cycle followed by an underload and vice-versa during fatigue crack growth for the case of XC38.
2. Experimental Procedure
The material used for this study is an XC38 steel used in molding, transmission shifts and tooling components.
The chemical and mechanical characteristics are given in Table 1 and Table 2.
All tests were conducted on CT75 specimens with a thickness B=4 mm and width W = 75 mm.
All the cracking tests were carried out under air and at room temperature on a servo-hydraulic machine type, INSTRON 8516 with static capacity of ± 50KN and dynamic of ± 100 KN.
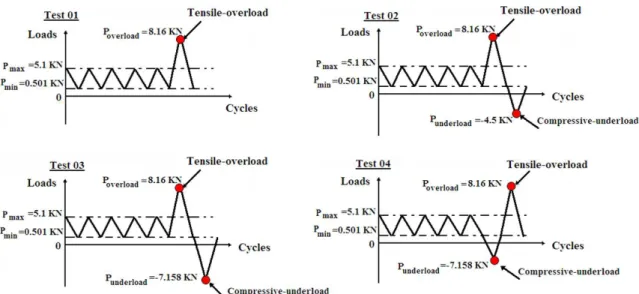
To quantify the overload and underload effect on crack propagation four types of loadings have been applied (Figure 1). All tests whose results were used in this study are shown in Table 3.
The rate of overload τ
ouv and rate underload τund can be
defined by the following equations respectively:
−
τ =
−
min max min
ouv ouv
K K
K K (1)
−
τ =
−
min max min
und und
K K
K K (2)
3. Analysis of Results
3.1.
Evolution of crack length with the number of
cycle N
Table 1. Chemical composition of XC 38.
Element C Mn Si P S
% 0.38 0.65 0.25 0.01 0.02
Table 2. Mechanical properties of CX 38.
E GPa
Re0.2 %
Mpa Rm MPa
A %
Hv Y
212 315 580 20 210 0.3
Table 3. Different types of loadings.
Material Type of tests
Ratio R Overload ratio
Underload ratio
XC38 Single
overload 0.1 1.7 1
XC38 Overload/ underload
0,1 1.70 –1.11
XC38 0,1 1.70 –1.70
XC38 Underload/
overload 0,1 1.70 –1.70
Figure 1. different types of loadings.
For a simple overload it is observed three different domains:
In stage one the crack advance with increasing number of cycle N. The second stage corresponds on the application of overload, the crack shows down for a certain number of cycle Nd called number of delay cycles. After the end of the overloads effect, the crack advances normally.
In the case of an overloads followed by underload when Punder = Pmax for an overload ratio τ = 1.7 it is observed a decrease in retardation effect.
For a good comprehension of underload effect, we decided to make tests by varying the peak of underload as a function of the load when Punder = Ppeak. It is noticed that the application of a high underload following an overload decreases significantly the number of delay cycles Nd.
Furthermore, in the case of a high underload in compression applied before an overload (Puneder = Ppeak) attenuates the delay of crack propagation.
3.2.
Evolution of crack growth rate da/dN as a
function of stress intensity factor amplitude
∆
K
In Figure 3, we propose to study the phases of crack growth. It illustrates the evolution of the crack growth rate da/dN as a function of the amplitude of the stress intensity factor ∆K. we note that after the application of an overload, there is a crack arrest for a certain number of cycles corresponding to retardation cycles Nd.
In terms of growth rate, this phenomenon results in instantaneous appearance of a “hook” putting into evidence deceleration, which corresponds to an immediate delay.
The crack growth rate after an overload can be described by two stages:
• Whenthegrowthratedecreasesrapidlytoreacha
minimum value noted (da/dN)min this zone highly perturbed by the overload corresponds to a crack length amin;
• The crack progresses in the plastic zone until it
reaches its initial value (da/dN)base.
It should be noted here, that the low value of crack growth rate reached in the case of an overload for a ration τ = 1.7, the minimum growth rate is about de2.16 10-5 mm/cycle while its value 1.2 e-4 mm/cycle in the case of an overload following by an underload where Punder = Ppeak. The growth rate increases when the ration of underload increases its value becomes 1.36 e-4 mm/cycle.
In this case, this high-intensity underload applied after an overload (Punder = Ppeak) two important phenomena re produced:
• Aftertheapplicationofanoverloadfollowedbyan
underload the crack growth rate decreases slightly;
• Itreachesagrowthratehigherthanitsinitialgrowth
Figure 2. Evolution of crack length (a) with cycle number (N).
Figure 3. Evolution of growth rate da/dN as a function of SIF amplitude ∆K.
This can be explained by the residual tensile stresses induced by high applied underload.
With a high underload applied before an overload (when Punder = Ppeak) eliminates the retardation of crack propagation. Table 4 summarizes the different results for different loading type to show the difference in behavior betweens thesis loadings.
3.3.
Analysis in terms of crack closure
To measure the opening load Po a strip sensor has been used. The principle is to measure the deformation of the ligament of a specimen, in effect; this deformation is linked to its rigidity. The latter is weakened when the crack
Figure 4. Evolution of hysteresis cycle P-δ load-strain.
Figure 5. Evolution of hysteresis cycle P-δ load-strain (test 02).
Figure 6. Evolution of hysteresis cycle P-δ load-strain (test 03).
progresses. Moreover, when the phenomenon of crack closure occurs, the load-strain curve P-δ shows a change in slope Figure 4.
During the crack propagation, there is the appearance of two distinct bridges on diagrams (P-δ), corresponding apparently to double opening Figures 5, 6 and 7.
This double opening point was obtained regardless of the position relative to the overload of underload.
Table 4. Results for different types of loadings.
Types of loading Nd (cycles)
ad
(mm)
(da/dN)min (mm/cycles)
Single overload 94000 7,49 2,16 E-5
Overload/underload (Punder=Pmax)
25000 6,34 1,2 E-4
Overload/underlod
(Punder=Ppeak) 22000 6,09 1,36E-4
Underload/overload (Punder=Pmax)
The existence of this second opening point on the diagram (P-δ) does have the measures in question the first point of opening. This first point is the notion of opening point according to Elber.
On the diagrams (P-δ), we determine following displacements:
• Thetotaldisplacementoftheδ
t crack tip; • Displacementcreatedbytheunderloadδ
c; • The residual displacementδ
r remaining after the
sequence overload.
It is observed that the residual displacement of the sequence-underload-overload is greater than the residual displacement of the sequence of overload-underload.
We also note that when the rate of underload increases, the value of the distance from the crack tip residual decreases. This effect tends to give back to the initial crack acuity, resulting in a decrease in life time.
3.4.
Evolution of tensile opening
In this study, changes in opening tress distribution have been taken into account in the calculation of the stress intensity factor for each loading case. We observe that after applying an overload the tensile opening stress increase rapidly and reach a greater value than that of the base load then slowly decrease (Figure 8a).
An overload applied before underload, causing a decrease of the stress of opening, which is less than the maximum stress followed by a slow decrease to a level below the previous case (Figure 8b).
In Figure 8c it is observed that after the application of an underload be a decrease in tensile opening load is high with a higher underload ratio.
Figure 9 shows the plot of the variation of the opening stress intensity factor Kop with respect to crack length a, the results show that there are distinct stages:
• Effectofsingleoverload
In stage one where the loading is of constant amplitude represents an increasing effective stress intensity factor ∆Keff due to a constant opening load P.
The second stage corresponds to the application of a first overload cycle where the crack progresses in a plastic zone Figure 7. Evolution of hysteresis cycle P-δ load-strain (test 04).
layer than that associated to the highest load (overload). The required opening stress increases and causes a diminution of ∆Keff. The reduction of the effective stress intensity factor explains the decrease after the application of overload, which gives an immediate delay.
The third stage, the opening stress decreases gradually with a growth that follows until a new equilibrium value is reached.
• Effectofanoverloadfollowedbyanunderload
followed by underload. This takes place at a distance of 4 mm, which may be comparable to the overage values of crack length associated which the minimum distance of propagation after overload/underload. The increase of underload amplitude lowers the opening stress intensity factor.
• Effectofanunderloadfollowedbyoverload
In the case of high underload applied before an overload (Punder = Ppic) the opening stress intensity factor is low. This can be explained by the residual tensile stress due to the applied underload.
We find that if the tensile overload is followed by a compressive overload, the material at the crack tip may undergo reverse plastic deformation and this reduces the residual stresses.
Figure 10 shows the evolution of crack closure (U) as a function of crack length (a). The value of this ration U permit to deduce the amplitude of the effective stress intensity factor ∆Keff and this predict the crack growth rate using Elber’s relation.
The opening ratio U can be expressed by the following equation:
∆ =
∆
eff
K U
K (3)
The effective stress intensity factor range is given by the equation:
∆ = max− = .∆
eff ouv
K K K U K (4)
3.5.
Evolution of the micro-hardness
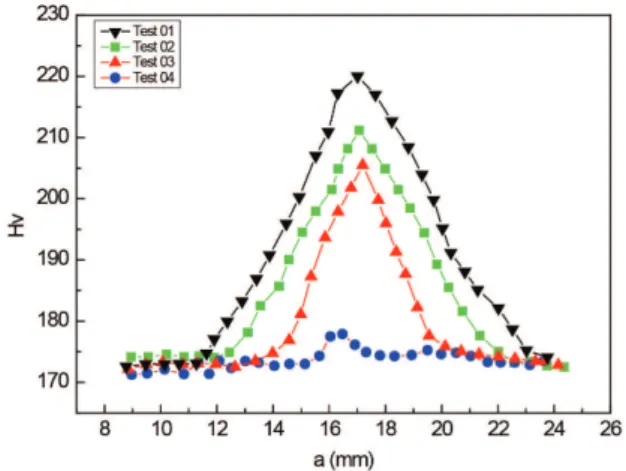
Micro-hardness measurements were performed using an indenter type ZWICK ZHV1 (a diamond in the form of a square-based pyramid whose opposite faces form an angle of 136°), Around 30 indentations near fatigue crack growth path were made. The distance between the centers of two adjacent indentations is about 0.9 mm. All the hardness readings were obtained using 2 kg-force load, and the full load was held for 15 s. the positions of the measuring points of hardness are given in Figure 11.
Figure 12 shows the micro-hardness profile measured on the surface of specimens from the figure on can state that:
The cyclic hardening more important results in a significant increase of micro hardness just after the application of an overload cycle. This reduces the growth rates in this zone perturbed by the overload resulting in retardation.
The hardening rate looks very important in the case of overload which provokes a consequential retardation. If the
Figure 9. Evolution of the opening stress intensity Kop factor with crack length a.
Figure 10. Evolution of closure relation with crack length (a).
Figure 11. Micro-hardness measuring positions.
tensile overload is followed by a compressive overload, the hardening intensity is less with respect to a single overload.
For the same case, the intensity decreases with the hardening ration overload. Contrary to the behavior observed tensile overload followed by a compression load, the intensity of curing is less important.
4. Numerical Simulation
It is believed that residual stresses and crack closure which one both related to plastic zone development due to overload are most of the time the cause of the retardations. These two phenomena will be affected by monotonic and cyclic hardening in the crack tip zone. It is worth introducing residual stress and crack closure concepts.
Residual stresses have an important role in the retardation mechanism after overload cycle, overload / underload and underload/overload.
4.1.
Conditions modeling
The aim of this section is to perform a numerical simulation of crack propagation advance. This has been conducted using ANSYS. The geometric dimension are similar to those of the specimen used in the experimental study (w=75 mm, B=4 mm). In the simulation, the properties and behavior of the material determined by experimental monotonic tests were used. For symmetry reason only one-half of the specimen has been meshed Figure 13.
We used triangular elements with 3 nodes; the size of elements in the path of the crack is 0.1 mm. The advance of the crack for 0.1 mm is performed represented 10 increments for a crack length for 0-25 mm.
The boundary conditions are:
• Theloadisappliedontheupperpactofthehole; • Thenodedisplacement(Uy) locates en front of the
crack are blocked;
• The crack advance, simulated by kill-element
technique, the number indicates “increment” required to reach this point 0.1 mm crack advance is made every five increments.
4.2.
Evolution of the stress field
In this part, we represent the stress distribution for the different cases studied. It is noticed the common profile
Figure 13. Mesh of the half specimen CT.
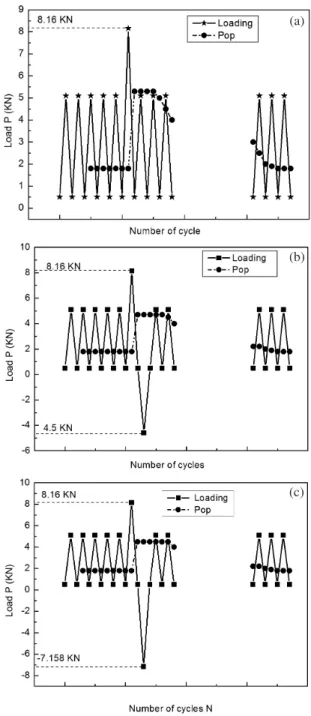
Figure 14. Steps of loading applied to the numerical modeling (single overload).
Figure 15. Evolution of stress field during the overload.
Figure 16. Steps of loading applied to the numerical modeling (overload/underload).
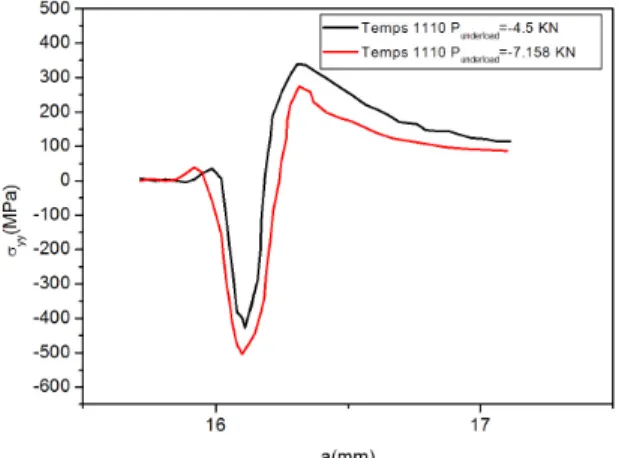
that the higher the overload the lower is the values of compressive stresses this leads to the acceleration of the crack propagation.
The effect of high underload has also been investigated Figure 19. It is noticed the application of high underload provokes a relaxation of compressive residuals stresses at the crack tip, if the applied compressive stress during underload is higher, when underload the residual stress become a tensile this will accelerates the crack propagation and eliminates the retardation Figure 20.
5. Conclusion
The study presented in this paper aims to characterize the crack propagation under variable loading. In this case, all the cycles are either an overload/underload or underload/ overload type.
The study has focused primarily on the influence of both the overload underload ratios. Four types of loading configurations were experimentally tested for the case of XC 38 steel. Through the experimental investigation, we find that for simple overload applied during constant amplitude loading causes a delay in crack propagation. Crack closure is important in the case of single overload.
If the tensile overload is followed by a compressive overload decreases the number of delay cycles, the material at the crack tip may undergo reverse plastic deformation and this reduces the residual stresses.
The application of a high underload following an overload decreases significantly the number of delay cycles Nd. In this case the Crack closure is less important for the case of overload/underload than that of single overload.
We can conclude that the life time caused by a sequence of overload-underload and lower than that caused by simple overload.
The measurements show that the residual compressive stresses and the crack closure are the major’s causes of delay. Figure 18. Evolution of stress field during overload-underload
(Time 1115).
Figure 19. Steps of loading applied to the numerical modelling (underload/overload).
Figure 20. Evolution of stress field during underload/ Overload.
of σyy during overload cycle and overload/underload followed by underload and vice-versa. During overload cycle Figure 14 it is observed an increase compressive stresses (the increment 1105 that represents the propagation cycle at the time of application of the overload), which are added to opening stresses resulting from unloading this delaying the opening of the crack Figure 15.
If an underload cycle followed by an overload cycle Figure 16 (the increment 1110 that represents the propagation cycle at the time of application of the underload) residual stresses exist at crack tip but are less important with respect to a single overload. It is noticed that for an undreload applied after an overload decreases considerably residual stresses Figure 17.
References
1. Decoopman X. Influence des conditions de chargement sur le retard à la propagation d’une fissure de fatigue après l’application d’une surcharge. [Thèse]. Lille: Lille University of Science and Technology; 1999.
2. Fonte M, Romeiro F and Freitas M. Environment effects and surface roughness on fatigue crack growth at negative R-ratios.
International Journal of Fatigue. 2007; 29:1971-1977. http://
dx.doi.org/10.1016/j.ijfatigue.2007.02.027
3. Beden SM and Abdullah S. Fatigue crack growth simulation of aluminium alloy under spectrum loadings. Materials and
Design. 2010; 31: 3449-3456. http://dx.doi.org/10.1016/j.
matdes.2010.01.039
4. Pommier S. A study on the relationships between variable amplitude fatigue crack growth and the cyclic constitutive behavior of an alloy. International Journal of
Fatigue. 2001; 23:111-118.
http://dx.doi.org/10.1016/S0142-1123(01)00165-7
5. Romeiro F, Freitas M and Pommier S. Effect of overloads and underloads on fatigue crack growth and interaction effects.
International Journal of Fatigue. 2009; 31:1189-1894. http://
dx.doi.org/10.1016/j.ijfatigue.2009.01.001
6. Dabayeh A and Topper T. Changes in crack-opening stress after underloads and overloads in 2024-T351 aluminium alloy.
International Journal of Fatigue. 1995; 17:261-269. http://
dx.doi.org/10.1016/0142-1123(95)00010-Q
7. Rui B and Xiang Z. Fatigue crack growth behaviour and life prediction for 2324-T39 and 7050-T7451 aluminium alloys under truncated load spectra. International Journal
of Fatigue. 2010; 32:1180-1189. http://dx.doi.org/10.1016/j.
ijfatigue.2009.12.010
8. Makabe C, Purnowidodo A and McEvily AJ. Effects of surface deformation and crack closure on fatigue crack propagation after overloading and underloading. International Journal
of Fatigue. 2004; 26:1341-1348. http://dx.doi.org/10.1016/j.
ijfatigue.2004.03.017
9. Silva FS. Fatigue crack propagation after overloading and underloading at negative stress ratios. International Journal
of Fatigue. 2007; 29:1757-1771. http://dx.doi.org/10.1016/j.
ijfatigue.2007.03.012
10. Skorupa M. Load interaction effects during fatigue crack growth under variable amplitude loading. Fatigue & Fracture of Engineering Materials & Structures. 1999; 22:905-926. http:// dx.doi.org/10.1046/j.1460-2695.1999.00158.x
11. Bacila A. Influence des effets de surcharges et souscharges sur la propagation d’une fissure de fatigue. Modélisation et estimation de la durée de vie des éléments de construction
mécanique. [Thèse]. Lille: Lille University of Science and
Technology; 2007.
12. Fleck NA, Shin CS and Smith RA. Fatigue crack growth under compressive loading. Engineering Fracture
Mechanics. 1985; 21:173-85.
http://dx.doi.org/10.1016/0013-7944(85)90063-3
13. Johnson P, Zhang XP and Pluvinage, G. Crack growth rate in impact fatigue and in programmed variable amplitude loading fatigue. Engineering Fracture Mechanics. 1990; 37:519-525. http://dx.doi.org/10.1016/0013-7944(90)90377-S
14. Sadananda K, Vasudevan AK, Holtz RL and Lee EU. Analysis of overload effects and related phenomena.
International Journal of Fatigue. 1999; 21:233-246. http://
dx.doi.org/10.1016/S0142-1123(99)00094-8
15. Wahab M, Rohrsheim G and Park J. Experimental study on the influence of overload induced residual stress field on fatigue crack growth in aluminium alloy. International Journal of
Fatigue. 2007; 153: 945-951.
16. Xiaoping H, Moan T and Weicheng C. An engineering model of fatigue crack growth under variable amplitude loading.
International Journal of Fatigue. 2008; 30:2-10. http://dx.doi. org/10.1016/j.ijfatigue.2007.03.004
17. Mohanty J, Verma B and Ray P. Prediction of fatigue crack growth and residual life using an exponential model: Part II (mode-I overload induced retardation). International Journal
of Fatigue. 2009; 31:425-432. http://dx.doi.org/10.1016/j.
ijfatigue.2008.07.018
18. Shin C and Hsu S. On the mechanisms and behaviour of overload retardation in AISI 304 stainless steel. International Journal
of Fatigue. 1993; 15:181-192.