Analytical determination of the critical impact location for wing
leading edge under birdstrike
Zeliang Yua*
Pu Xuea
Peilun Yaoa
M. S. Zahranb
a School of Aeronautics, Northwestern Polytechnical University, Xi’an, Shanxi, China. E-mail: [email protected], [email protected], [email protected]
b Military Technical College, Cairo, Egypt. E-mail: [email protected]
*Corresponding author
http://dx.doi.org/10.1590/1679-78255352
Abstract
The wing leading edge is one of the aircraft structures which are vulnerable to birdstrike. Therefore, Federal Aviation Regulation has clear requirements of anti-birdstrike performance for wing leading edge. However, the impact location is not specified in aviation regulation. The forefront of the wing leading edge is selected as a critical location for the birdstrike in most researches. But the rationality of the selection is not given. This paper proposes an analytical method for determining the critical location that causes the most severe damage under impact due to birdstrike. The analysis is based on the concept of effective impact, i.e. the component of the bird velocity perpendicular to the surface of wing leading edge. A birdstrike model is established using Pam-crash and used to validate the analytical prediction. The numerical model proves its effectiveness compared to the birdstrike test. The residual compressive strength of the spar when the birdstrike is at the critical impact location determined by the proposed method is 44.5% of that at the traditional impact location. Moreover, the critical penetrating velocity of the traditional impact location is not the lowest. In other words, the traditional impact location is not the weakest. Airworthiness verification experiment of birdstrike on wing structure should pay attention to this aspect.
Keywords
Birdstrike, SPH, Wing leading edge, Analytical method, Critical impact location.
1 INTRODUCTION
Collisions between aircraft and wildlife, mostly birds, are a serious hazard to all forms of aircrafts and have resulted in the loss of at least 108 aircraft and 276 lives in civil aviation (Allan et al. 2016). Due to increased density of the air transport and changing migration routes of flocking birds, birdstrikes are becoming a major problem to aviation safety (Lopez-Lago et al. 2017). Wing leading edge, windshield, tailplane leading edge and fan blades are the most vulnerable to birdstrike (Grimaldi et al. 2013). In order to protect the safety of passengers, Federal Aviation Regulation has issued strict requirements on the anti-birdstrike capacity for aircraft structure. Therefore, the birdstrike study has received extensive attention.
investigate the birdstrike problem. Goyal et al. (2006, 2013a, b) modeled birdstrike based on the Lagrangian Formulation, ALE method and SPH using LS-DYNA and found that SPH could avoid distortion caused by large deformation, which was important in high-speed impact simulation. At present, most bird strike numerical studies adopt SPH method (Lavoie et al. 2007).
Experiments are the most authoritative and accurate method to examine the anti-birdstrike performance. The experiment set-up usually includes air-gun, simulation bird and measurement devices. Liu et al. (2015) adopted processed chicken to simulate bird in birdstrike experiment. Seidt et al. (2013) conducted a birdstrike test to validate the dynamic response of gelatin bird in the numerical simulation. Considering the consistency of the tests, dummy birds made of gelatin are widely used nowadays (Budgey 2000, Allaeys et al. 2017, Jun et al. 2018). Chan et al. (2012) proposed a new approach to monitor the sensor signals at the sampling frequency of 100 kHz and validated its effectiveness through a high speed birdstrike test on the leading edge of a composite UAV wing. Guida et al. (2012) experimentally investigated the anti-birdstrike performance of a wing leading edge which was made of fiber metal laminate materials. The same group (Guida et al. 2013) also designed and manufactured a ribless composite leading edge. The designed leading edge was able to satisfy birdstrike requirements specified by certification authorities.
Aviation regulations stipulate bird mass and impact velocity but do not specify impact location. In the all above experimental studies, the forefront of the leading edge was selected as the impact location. However, the rationality of the selection in wing birdstrike tests was not illustrated in their studies. So far most of the experimental and numeric studies (Mccarthy et al., 2004a, Mccarthy et al., 2004b, Kermanidis et al., 2005, ThKermanidis et al., 2006, Hedayati and Ziaeirad, 2011, Chan et al. 2012, Guida et al., 2012, Guida et al. 2013, Hassan et al. 2016, Goraj and Kustron, 2018) think the impact location at the forefront of the leading edge is the critical impact location and do not to strictly analyze whether it is. Some researchers (Vignjevic et al. 2013, Orlando et al., 2018) have noticed that the impact position had a great effect on birdstrike damage.
In order to ensure the safety of aircraft, the birdstrike conditions of airworthy certification must be the most severe. Therefore, this paper systematically studies the critical impact location on wing leading edge under birdstrike. The paper is organized as follows. In section 2, an analytical method for determining the critical impact location is proposed. A wing leading edge is analyzed as an example based on the proposed analytical method. In section 3, birdstrike model is established and validated by experiment. In section 4, the validated model is used to assess the analytical prediction of the impact locations proposed in section 2. The flow chart of this study is shown in Figure 1.
Analytical
model of
birdstrike
Critical impact
location
energy
indicators
Birdstrike
model
Birdstrike
experiment
validated
damage
indicators
Simulation
validation
Section 2 Section 3
Section 4
weakness
factor
Figure 1: Flow chart of the study.
2 Determination of the critical impact location
2.1 Analytical method
wing leading edge at a speed opposite to the plane, the resulting damage is only related to impact location if the mass of the bird, impact velocity and the structure of wing leading edge are specified. The damage is caused by the kinetic energy of the birdstrike. However, not all the kinetic energy acts on the wing leading edge. Only the velocity component perpendicular to the impact surface introduces an effective impact. Frictional damage due to tangential velocity component can be ignored. The effective energy of the impact is related to the impact location, as well as the airfoil. The damage due to impact is also related to energy density for the character of localized effect. Therefore, two energy indicators are proposed to evaluate the weakness of a certain impact location namely the effective kinetic energy and the effective kinetic energy density.
1
bird
V
birdx
y
z
Leading edge
β
1111111
11
Figure 2: Schematic of birdstrike.
The Cartesian coordinates is given in Figure 2. The orientation of x axis is along the edge of the wing. The orientation of z axis is determined as the projection of bird velocity 𝑣𝑏𝑖𝑟𝑑 in the plane y-z. Finally, the orientation of y axis is naturally finalized. The origin can be chosen arbitrarily. â represents the sweep angle of the wing.
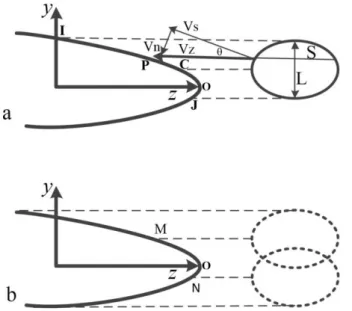
Figure 3: Schematic diagram of birdstrike analyze.
Figure 3(a) shows the schematic diagram of birdstrike analyze. Point O is the forefront of the wing leading edge and 𝑦𝑜= 0. Point C is the center point of the impact location. The impact region is between point I and point J. And the impact angle 𝜃 can be expressed as the tilt angle of the wing tangent, so 𝜃 is a function of y. Point P is the impact point of one micro segment of bird. 𝑣𝑛 is the normal impact velocity component at point P.
𝑣𝑍= 𝑣𝑏𝑖𝑟𝑑cos(𝛽) (1)
𝑣𝑛(𝑦𝑃) = 𝑣𝑍sin(𝜃(𝑦𝑃)) (2)
𝑑𝑚(𝑦𝑃) = 𝜌𝑆(𝑦𝑃)𝑑𝑦 (3)
The area 𝑆(𝑦𝑃) is obtained by discretizing the bird body over the plane x-z of the point P. So, S is a function of y. The effective kinetic energy of the impact at point C is obtained:
𝐸(𝐶) = ∫ 𝑑𝑚 ∙ 𝑣𝑦𝑦𝐽𝐼 𝑛2/2 = ∫ (𝜌𝑆𝑣𝑦𝑦𝐽𝐼 𝑛2/2)𝑑𝑦 (4)
Define effective kinetic energy density distribution function at point C 𝐷(𝐶, 𝑦) as follows:
𝐷(𝐶, 𝑦) = (𝑑𝑚 ∙ 𝑣𝑛2⁄ )/(𝑑𝑦/ 𝑠𝑖𝑛 𝜃) = 𝜌𝑆𝑣2 𝑛2𝑠𝑖𝑛 𝜃/2 (5)
Figure 3(b) shows the range of the impact locations. The center point of impact location should be between point M and point N. If
𝐸(𝑋𝐸) ≥ 𝐸(𝑋), 𝑋 ∈ [𝑀, 𝑁] (6)
𝐸(𝑋𝐸) is the maximum effective kinetic energy, and the point 𝑋𝐸 is defined as the MKE impact location. If
𝐷(𝑋𝐷, 𝑦𝑑) ≥ 𝐷(𝑋, 𝑦), 𝑋 ∈ [𝑀, 𝑁], 𝑦 ∈ [𝑦𝑋− 𝐿/2, 𝑦𝑋+ 𝐿/2] (7)
𝐷(XD, yd) is the maximum effective kinetic energy density, and the point 𝑋𝐷 is defined as the MKD impact
location. The MKD impact position is generally adopted as impact location in the traditional birdstrike experiments. The power and damage of impact is related to energy and energy density. Birdstrike with high energy and low energy density may not penetrate the skin of wing leading edge. And birdstrike with low energy and high energy density may only cause localized damage. In order to determine the critical impact location, a weakness factor combining effective energy and effective energy density is defined. The weakness factor at point C is assumed as:
𝑊(𝐶) = 𝐸(𝐶) ∙ (𝑚𝑎𝑥(𝐷(𝐶, 𝑦)))𝜂, 𝑦 ∈ [𝑦𝐼, 𝑦𝐽] (8)
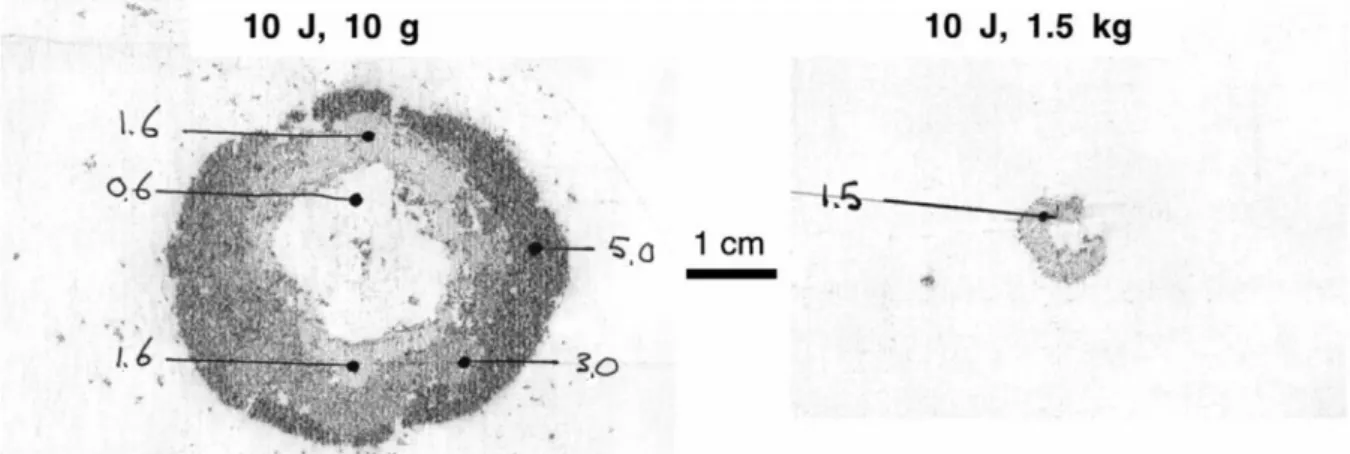
where 𝜂 is energy density correction factor. Figure 4 shows a comparison between two composite plates suffered by impact with the same kinetic energy. The small size impactor causes much more serious damage than large size impactor. The difference between the two impactors is the kinetic energy density. The small size impactor with high impact velocity has higher kinetic energy density. Considering that impact is more sensitive to the effective energy density,𝜂 should be greater than 1.
Figure 4: Response and damage caused by small- and large-mass 10 J impactors. (Olsson, 2000).
If
𝑋𝑤 is determined as the critical impact location. An example will be presented to illustrate the calculation process and
validate the prediction of the critical impact location.
2.2 Implementation
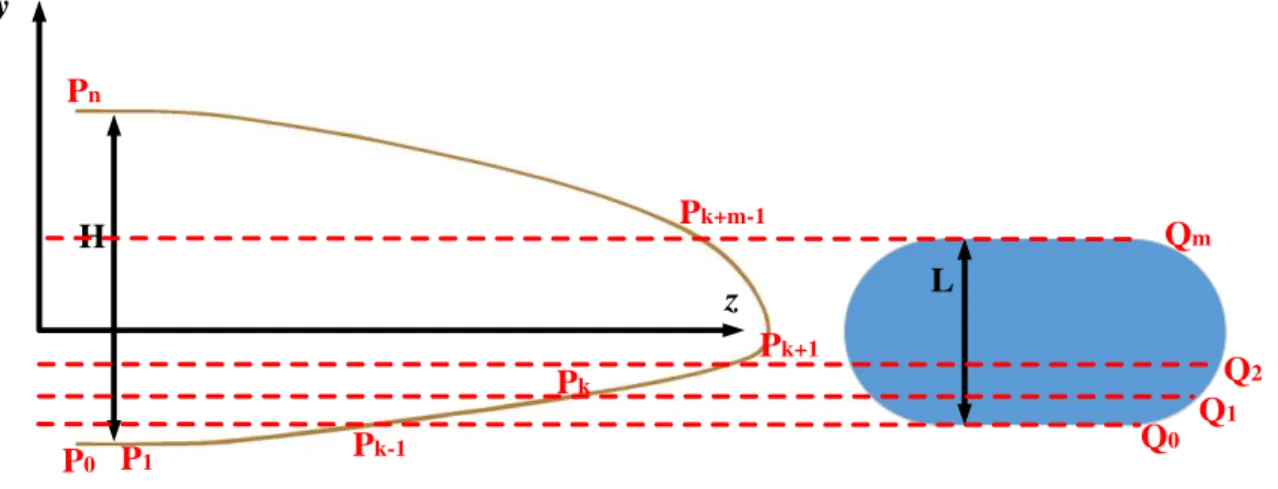
Figure 5 shows the schematic of a real birdstrike experiment. The airfoil is obtained from a real wing leading edge. The bird shape is a circular cylinder with hemispherical end caps. The calculation process is as follows.
H
y
z
L
P
0P
1P
nP
k-1P
kQ
0Q
2Q
1Q
mP
k+m-1P
k+1Figure 5: Schematic of a real birdstrike.
Step 1: Equally divide the wing leading edge into n parts using plane x-z.. While the bird is equally divided into m part in the same way. ∆𝑦 of each micro segment is equal to 𝐻/𝑛, where H is the height of the wing leading edge. Thus, 𝑚 = 𝐿/∆𝑦. Define an array Angle[n] to store 𝜃 of each micro segment in wing leading edge.
𝑨𝒏𝒈𝒍𝒆[𝑘] = 𝑡𝑎𝑛−1((𝑦
𝑃𝑘− 𝑦𝑃𝑘−1)/(𝑧𝑃𝑘− 𝑧𝑃𝑘−1)), 𝑘 = 1,2, … , 𝑛 (10)
Define an array Mass[m] to store the mass of each micro segment in bird.
𝑴𝒂𝒔𝒔[𝑘] = 𝜌𝑆𝑘(𝑦𝑄𝑘− 𝑦𝑄𝑘+1), 𝑘 = 1,2, … , 𝑚 (11)
where 𝑆𝑘 is the cross-sectional area of bird at 𝑄𝑘.
Step 2: The nature of the birdstrike is that m micro segments of bird impact their corresponding m micro segments of wing leading edge. Thus, define a matrix Region[n-m+1, m] to store all possible impact locations. Region[k, m] stores 𝜃 of micro segments belonging to k-th impact location.
𝑹𝒆𝒈𝒊𝒐𝒏[𝑘, 𝑖] = 𝑨𝒏𝒈𝒍𝒆[𝑘 + 𝑖 − 1], 𝑘 = 1,2, … , 𝑛 − 𝑚 + 1, 𝑖 = 1,2, … , 𝑚 (12)
Step 3: Define an array Energy[n-m+1] to store the effective kinetic energy of each impact location.
𝑬𝒏𝒆𝒓𝒈𝒚[𝑘] = ∑𝑚𝑖=1𝑴𝒂𝒔𝒔[𝑖](𝑣𝑧𝑠𝑖𝑛 𝑹𝒆𝒈𝒊𝒐𝒏[𝑘, 𝑖])2/2, 𝑘 = 1,2, … , 𝑛 − 𝑚 + 1 (13)
The maximum value in Energy is the maximum effective kinetic energy, and its corresponding impact location is the MKE impact location.
Step 4: Define a matrix Density[n-m+1, m] to store the effective kinetic energy density for each micro segment of each impact location.
𝑫𝒆𝒏𝒔𝒊𝒕𝒚[𝑘, 𝑖] =𝑴𝒂𝒔𝒔[𝑖](𝑣𝑧sin( 𝑹𝒆𝒈𝒊𝒐𝒏[𝑘,𝑖]))2)
2∗(∆𝑦/ sin(𝑹𝒆𝒈𝒊𝒐𝒏[𝑘,𝑖])) , 𝑘 = 1,2, … , 𝑛 − 𝑚 + 1, 𝑖 = 1,2, … , 𝑚 (14)
Step 5: Define an array Weakness[n-m+1] to store the weakness factor of each impact location.
𝑾𝒆𝒂𝒌𝒏𝒆𝒔𝒔[𝑘] = 𝑬𝒏𝒆𝒓𝒈𝒚[𝑘] ∙ (𝑚𝑎𝑥(𝑫𝒆𝒏𝒔𝒊𝒕𝒚[𝑘, 𝑖]))𝜂, 𝑘 = 1,2, … , 𝑛 − 𝑚 + 1, 𝑖 = 1,2, … , 𝑚 (15)
Take the maximum value in Weakness, and its corresponding impact location is the critical impact location. For a real birdstrike experiment, the sweep angle of the wing leading edge is 3°. The mass of the bird is 0.8 kg and the impact velocity is 180 m/s. 𝜂 is assumed to be 2 in this case and the value will be detailed discussed in section 4.3.
The foregoing steps are implemented in Matlab. The weakness factor curve is obtained, as shown in Figure 6. The maximum value is obtained at point D. Point O is the forefront of the wing leading edge, as well as the center point of the MKD impact location. And the point A is corresponding to the maximum effective kinetic energy. Point C are picked as contrasts. The selected impact locations in wing leading edge are shown in Figure 7. The detail value is listed in Table 1. According to the weakness factor of four points, the severity of damage caused by impacting at each location should be sort as point D> point O> point A> point C.
0 10 20 30 40
1.0 1.5 2.0 2.5 3.0 3.5
C A
D
weakn
ess f
acto
r (
J
3 /mm 2 )
y (mm)
10E8
O
Figure 6: Curve of weakness factor.
Figure 7: Schematic of selected impact locations in wing leading edge.
Table 1: The weakness factor of four impact locations.
Impact location y (mm) Weakness factor (J3/mm2) Normalization
O 0.0 3.25E8 100%
D 9.98 3.39E8 104.3%
A 16.4 3.04E8 93.5%
C 35.0 1.45E8 44.6%
it is necessary to consider the effective kinetic energy rather than total kinetic energy in evaluating the damage of birdstrike.
0 10 20 30 40
6600 6800 7000 7200 7400 7600 7800 8000 8200 8400 8600 O D A eff ective imp act kinet ic en er gy ( J) y (mm) C
Figure 8: Curve of effective kinetic energy.
Table 2: The effective kinetic energy of birdstrike of four impact locations.
Impact location y (mm) Effective kinetic energy (J) Normalization
O 0.0 7776.4 100%
D 9.98 8406.7 108.1%
A 16.4 8553.3 110.0%
C 35.0 7334.8 94.3%
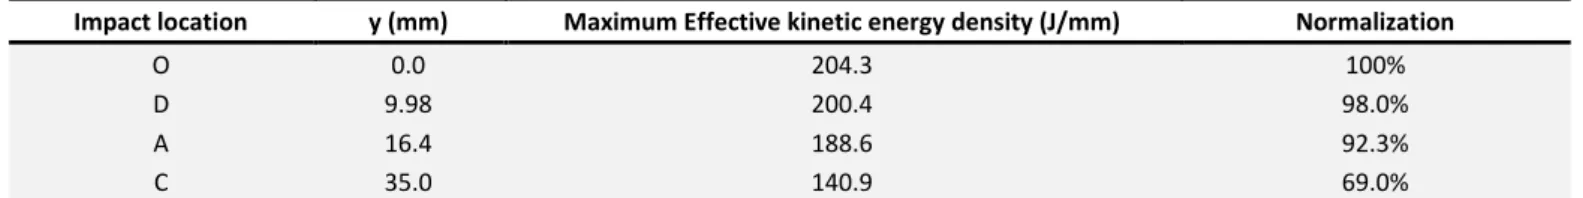
Figure 9 shows the effective kinetic energy density distribution curve of each impact location. The effective kinetic energy density of impact location at point O is the largest. And the value at point C is much smaller. And Figure 9 indicates that effective kinetic energy density continually decreases when the impact location deviates from point O. Table 3 shows the detail values.
-60 -40 -20 0 20 40 60 80 0 50 100 150 200 Effective imp act kinet ic en er gy d en sity(J/m m) y (mm) point O point D point A point C
Table 3: The effective kinetic energy of birdstrike of four impact locations.
Impact location y (mm) Maximum Effective kinetic energy density (J/mm) Normalization
O 0.0 204.3 100%
D 9.98 200.4 98.0%
A 16.4 188.6 92.3%
C 35.0 140.9 69.0%
Figure 8 and Figure 9 indicate that the birdstrikes with impact locations between point O and point A have higher effective kinetic energy and effective kinetic energy than those out of range. So, the critical impact location is determined between points O and point A. According to the assumption of weakness factor, the critical impact location is point D, which is between points O and point A. The predication of the weakness sequence will be validated through birdstrike simulations.
3 Numerical model and its validation
A birdstrike model is established by Pam-crash. Then a birdstrike experiment was conducted to validate the numerical model.
3.1 Birdstrike model
A birdstrike model of wing leading edge is established, as shown in Fig. 10. The wing leading edge contains inner skin, Nomex paper honeycomb and outer skin. The skin is made of glass fiber fabric reinforced composites. The thickness of the inner skin is 0.8 mm, and the thickness of the outer skin is 1.5 mm. The impact location is the forefront of the wing leading edge. The sweep angle is 3°.
Bird Outer skin
NOMEX paper honeycomb Inner skin
Fixture
Spar
Figure 10: Birdstrike model of wing leading edge.
The wing leading edge is a sandwich structure. The layup sequence of inner skin is [45/0/−45/90]s, and the layup sequence of outer skin is [45/0/−45/0/45/0/−45/90̅̅̅̅]s. The thickness of each layer is 0.1 mm. The properties of lamina provided by manufacturers are shown in Table 4. Tsai-Wu criteria is applied to describe the damage.
Table 4: Material properties of glass fiber fabric reinforced composite.
Density(g/cm3) 2.0
Warp/Weft tensile modulus(GPa) 21.0 GPa
Warp/Weft compression modulus(GPa) 21.0 GPa
Shear modulus(GPa) 7.5 GPa
Warp/Weft tensile strength(MPa) 400 MPa
Warp/Weft compression strength(MPa) 380 MPa
Shear strength(MPa) 121 MPa
Warp/Weft Poisson's ratio 0.13
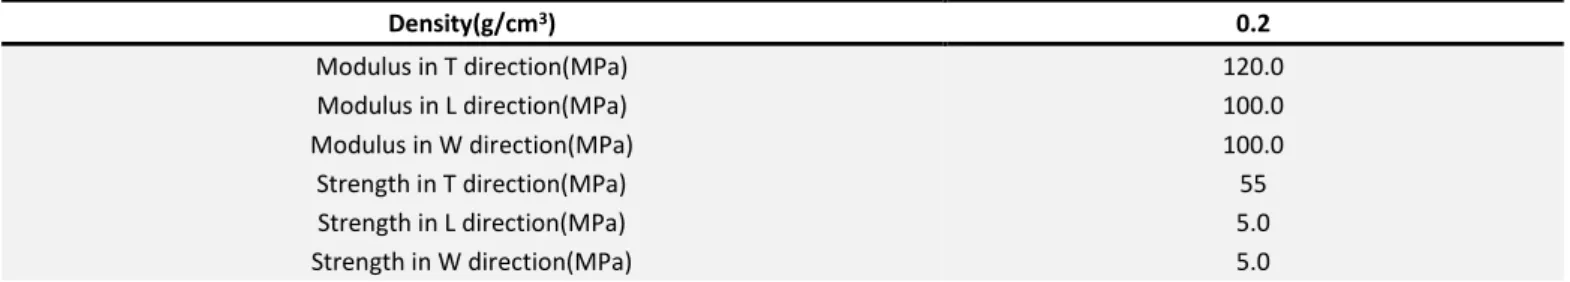
Table 5: Material properties of Nomex paper honeycomb.
Density(g/cm3) 0.2
Modulus in T direction(MPa) 120.0
Modulus in L direction(MPa) 100.0
Modulus in W direction(MPa) 100.0
Strength in T direction(MPa) 55
Strength in L direction(MPa) 5.0
Strength in W direction(MPa) 5.0
Gelatin bird is simulated by SPH method. Bird is described by the Murnaghan Equation of State, as shown in Equation 16.
𝑃 = 𝑃0+ 𝐵((𝜌 𝜌⁄ 0)𝛾− 1) (16)
where 𝑃0 and 𝜌0 are reference pressure and density, respectively, and B and ã are constants to be determined. This study adopts the values in (Mccarthy et al., 2004b), which are 𝐵 = 128MPa and 𝛾 = 7.98.
The mass of the bird is 800 g, and the impact velocity is 180 m/s. The bird model geometry is approximated as a circular cylinder with hemispherical end caps (Mccarthy et al., 2004b, Hedayati et al., 2014, Liu et al., 2017) as shown in Fig. 11, which was used widely (Mccarthy et al., 2004b, Vignjevic et al., 2013, Liu et al., 2017). The D here is 86.326 mm.
D
2D
Figure 11: Bird model geometry.
A spar is used to evaluate the damage of the inner structures of the wing. The spar is made of 7075-T6 aluminum-alloy. Its performance is described by bilinear model, as shown in Table 6 (Nicholas, 1981).
Table 6: Material properties of 7075-T6 aluminum-alloy.
Density(g/cm3) 2.8
Young modulus(GPa) 71
Poisson's ratio 0.27
Elastic ultimate strength(MPa) 543
Yield strength(MPa) 636
Elongation 0.16
Nomex paper honeycomb and composite laminates are connected by adhesive. Tie-break is used to simulate the adhesives. The break is described as Equation 17. According to the performance of the adhesive, we set the tie-break properties, which are 𝑁𝑜𝑟𝑚𝑎𝑙𝐹𝑎𝑖𝑙𝑢𝑟𝑒𝑆𝑡𝑟𝑒𝑠𝑠 = 50𝑀𝑃𝑎 and 𝑆ℎ𝑒𝑎𝑟𝐹𝑎𝑖𝑙𝑢𝑟𝑒𝑆𝑡𝑟𝑒𝑠𝑠 = 40𝑀𝑃𝑎.
( |𝜎𝑛|
𝑁𝑜𝑟𝑚𝑎𝑙𝐹𝑎𝑖𝑙𝑢𝑟𝑒𝑆𝑡𝑟𝑒𝑠𝑠) 2
+ ( |𝜎𝑠|
𝑆ℎ𝑒𝑎𝑟𝐹𝑎𝑖𝑙𝑢𝑟𝑒𝑆𝑡𝑟𝑒𝑠𝑠)2{≥ 1, 𝑓𝑎𝑖𝑙𝑢𝑟𝑒< 1, 𝑎𝑐𝑡𝑖𝑣𝑒 (17)
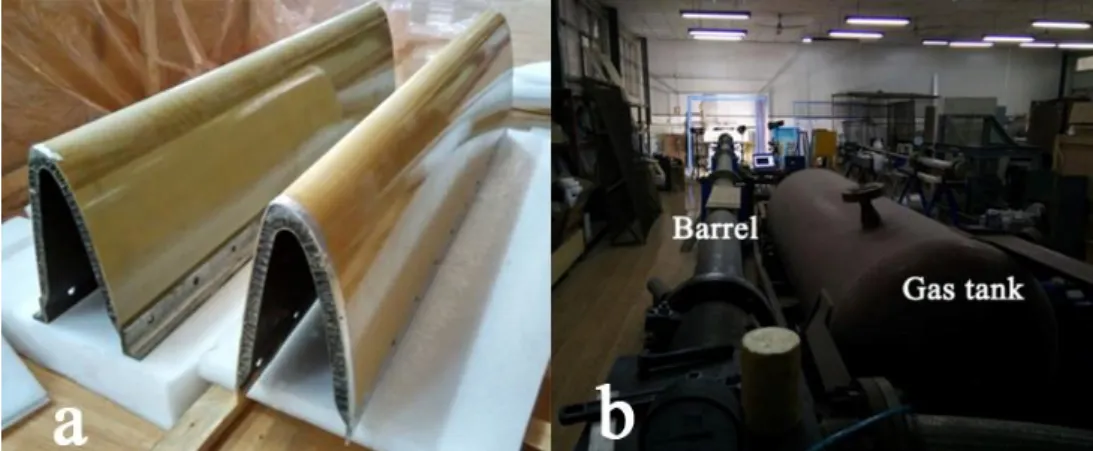
3.2 Validation of numerical model by experimental results
Figure 12: Birdstrike experiment, (a) wing leading edge, (b) air-gun.
Figure 13 showed the diagram of strain measurement position. Figure 14 showed the installation diagram of birdstrike experiment. The impact location was at the middle point of the forefront of the wing leading edge. Try a few shots to determine the impact position and the required gas pressure. When bird was launched by high pressure gas, the laser speedometer got the signal. Then this signal was transferred to strain gauge and high-speed camera as a start signal.
Figure 13: Strain measurement position diagram..
Figure 14: Installation diagram of birdstrike test
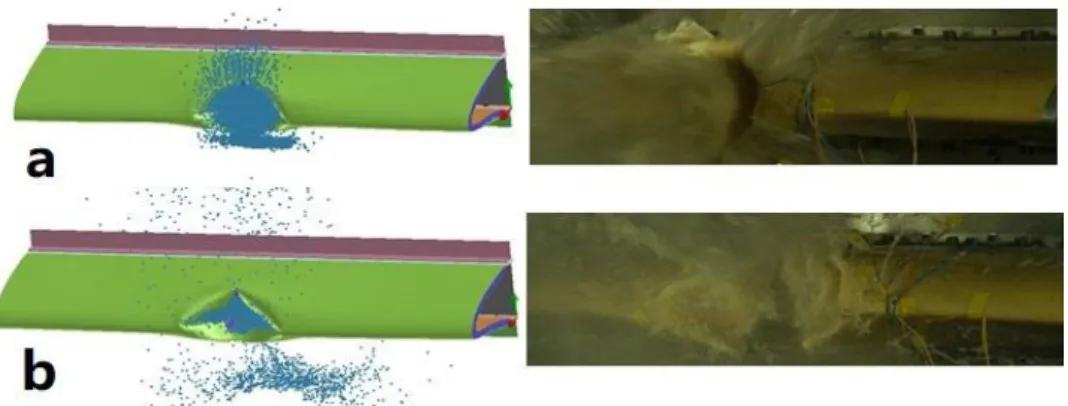
Figure 15: Comparisons of typical birdstrike process between simulation and experiment.
Figure 16: Comparisons of damage between simulation and experiment.
Strain gauge recorded the strain of the birdstrike experiment. Figure 17 showed the comparisons of strains between experiment and simulation. Four strain gages were damaged in the birdstrike. Only the S4, S6, S7 and S8 obtained valid data. In each group of comparison, the trend of the curves was roughly the same, and the values were nearly the same, too.
Through the above comparative analysis of deformation process, damage details and strains between experiment and simulation, it is shown that the birdstrike model is effective and reliable.
4 Comparison of numerical results with the analytical prediction
The study in Section 2 determines the weakness factor of each impact location theoretically. Two damage indicators, namely the residual compressive strength of spar and the critical penetration velocity, are proposed to validate the weakness of each impact location. The residual compressive strength of spar represents the damage of the internal structures in the wing. And the critical penetration velocity represents the difficulty of penetrating the wing. The four impact locations selected in Section 2.2 are studied in numerical way.
4.1 Residual compressive strength of spar
FAR 25.571 requires that the damage structure must be able to withstand the static loads. Thus, the residual compressive strength of spar must be considered. Four birdstrike models are established with four impact locations. The models are validated in Section 3. The impact velocity is 180 m/s and the sweep angle of the wing is 3°. The geometry and mass of bird is the same as those in Section 3.
Figure 18 shows the birdstrike results of four models. The bird penetrates the skin except for the model of impact location at point C, indicating a minimum damage when the impact location is point C.
Figure 18: Birdstrike results of impact locations at (a) point O, (b) point D, (c) point A and (d) point C.
Table 7: The energy absorption and residual compressive strength of the spar.
Impact location Internal energy (J) Residual compressive strength (MPa) Normalization of Residual compressive strength
O 383.2 226.7 100%
D 730.7 100.9 44.5%
A 342.4 258.5 114.0%
C 10.5 389.4 171.8%
Spar Upper plate
Lower plate Constrained horizontal
displacement Move down
Move up
Figure 19: Residual compressive strength model diagram.
0 4 8 12 16 20
0 100 200 300 400 500 600 700 800
React
ion
for
ce/kN
Displacement/mm
point O point D point A point C
Figure 20: Reaction force curves of four residual compressive strength models.
4.2 Critical penetrating velocity
Another damage indicator of anti-birdstrike performance is the critical penetrating velocity. A series of models with different impact velocities are simulated to find out the critical penetrating velocity.
Bird particle
Figure 21: Birdstrike results with impact location at point O under the velocity of (a) 148 m/s, (b) 149 m/s and (c) 150 m/s.
The birdstrikes under impact velocity of 149 m/s at the other impact locations are simulated and the results are shown in Figure 22. The impact location at point C is not considered because its critical penetrating velocity exceeds 180 m/s. The skin is completely penetrated when the impact location is point D, while skin is not penetrated when the impact location is point A. The results indicate that the critical impact location is the point D, and the slightest one is point C. According to the critical penetrating velocity, the weakness sequence is point D> point O> point A> point C, which is consistent with the analytical prediction.
Figure 22: Birdstrike results with impact location at (a) point D and (b) point A under impact velocity of 149 m/s
The results based on the two damage indicators are the same. Both the critical impact location and weakness sequence are consistent with the analytical prediction, indicating the weakness factor is effective in determining the critical impact location. The distance between point D and point O in y direction accounts for 7.9% of the height of wing leading edge, indicating that taking point O as the critical impact location in birdstrike test is obviously wrong.
4.3 Energy density correction factor ɳ
Table 8: Weakness factors of different impact locations and ç.
Impact location ç=1 ç=2 ç=3 ç=4 ç=5
O 1.59E6 3.25E8 6.63E10 1.35E13 2.77E15
D 1.68E6 3.39E8 6.77E10 1.36E13 2.72E15
A 1.61E6 3.04E8 5.74E10 1.08E13 2.04E15
C 1.03E6 1.45E8 2.05E10 2.89E12 4.07E14
Figure 23 shows the curve of weakness factor when ç equal to 3. The Point B becomes the critical impact location.
0 10 20 30 40
1 2 3 4 5 6 7
weakn
ess f
acto
r
y(mm)
η=3
D B
C A
O
1E10
Figure 23: Curve of weakness factor when ç=3.
Another birdstrike simulation is conducted with point B as the impact location. The skin is penetrated. So the residual compressive strength of spar is simulated. Figure 24 show the comparison of reaction force between two models with different impact locations. The peak reaction force of the model with impact location at point B is much larger than that at point D, indicating that point D is the real critical impact location. The simulation results demonstrate that ç=2 is most reasonable.
0 4 8 12 16 20
0 50 100 150 200 250 300 350
React
ion
for
ce/kN
Displacement(mm) B D
4 CONCLUSIONS
An analytical method to determine the critical impact location of wing leading edge under birdstrike is proposed. The main conclusions can be drawn as follows:
1. The effective kinetic energy from the velocity component along the normal direction of the impact surface and the corresponding effective kinetic energy density are defined as two energy indicators to evaluate the severity of birdstrike. Then, a weakness factor is proposed to determine the critical impact location based on the two energy indicators.
2. The analytical method is implemented using Matlab. A real wing leading edge is analyzed. The results show that the critical impact location is not the traditional impact location selected in birdstrike tests. The MKD impact location coincides with the traditional impact location.
3. To validate the analytical prediction, the numerical simulations are conducted. The residual compressive strength of spar and the penetrating velocity are taken as two damage indicators to evaluate the weakness of the impact location. The numerical model established is validated by birdstrike experiment. The simulation results indicate that the corresponding residual compressive strength of spar at critical impact location is only 44.5% of that at traditional impact location and the corresponding penetrating velocity at critical impact location is also smaller than that at traditional impact location. The critical impact location and weakness sequence are consistent with the analytical prediction. Therefore, taking the forefront of wing leading edge as the impact location in the birdstrike test is not the most severe case, which should be paid attention in airworthiness verification experiment of corresponding aircraft structure.
ACKNOWLEDGMENTS
This work was supported by the National Natural Science Foundation of China [grant numbers 11672248, 11472226]; and the Key Science and Technology Industrial Program of Shaanxi Province, China [grant number 2016GY-204].
References
Allaeys, F., G. Luyckx, W. Van Paepegem and J. Degrieck (2017). Characterization of real and substitute birds through experimental and numerical analysis of momentum, average impact force and residual energy in bird strike on three rigid targets: a flat plate, a wedge and a splitter. International Journal of Impact Engineering 99: 1-13.
Allan, J., A. Baxter and R. Callaby (2016). The impact of variation in reporting practices on the validity of recommended birdstrike risk assessment processes for aerodromes. Journal of Air Transport Management 57: 101-106.
Budgey, R. (2000). The development of a substitute artificial bird by the international birdstrike research group for use in aircraft component testing. Bird Strike Avoidance Team, Central Science Laboratory, UK.
Chan, Y. P., B. W. Jang, J. H. Kim, C. G. Kim and S. M. Jun (2012). Bird strike event monitoring in a composite UAV wing using high speed optical fiber sensing system. Composites Science & Technology 72(4): 498-505.
Goraj, Z. J. and K. Kustron (2018). Review of current research trends in bird strike and hail impact simulations on wing leading edge. Aircraft Engineering & Aerospace Technology(2): 00-00.
Goyal, V. K., C. A. Huertas, T. R. Leutwiler and J. R. Borrero (2006). Robust bird-strike modeling based on SPH formulation using LS-DYNA. AIAA Paper 1878: 2006.
Goyal, V., C. Huertas, J. Borrero and T. Leutwiler (2013a). Robust Bird-Strike Modeling Based on ALE Formulation Using LS-DYNA. Aiaa/asme/asce/ahs/asc Structures, Structural Dynamics, and Materials Conference Aiaa/asme/ahs Adaptive Structures Conference.
Goyal, V. K., C. A. Huertas and T. J. Vasko (2013b). Smooth Particle Hydrodynamics for Bird-Strike Analysis Using LS-DYNA. American Transactions on Engineering & Applied Sciences 2(2).
Grimaldi, A., A. Sollo, M. Guida and F. Marulo (2013). Parametric study of a SPH high velocity impact analysis – A birdstrike windshield application. Composite Structures 96(4): 616-630.
Guida, M., F. Marulo, M. Meo and S. Russo (2012). Experimental Tests Analysis of Fiber Metal Laminate under Birdstrike. Mechanics of Composite Materials & Structures 19(5): 376-395.
Hassan, Pahange, Mohammad, Hossein and Abolbashari (2016). Mass and performance optimization of an airplane wing leading edge structure against bird strike using Taguchi-based grey relational analysis. Chinese Journal of Aeronautics 29(4): 934-944.
Hedayati, R., M. Sadighi and M. Mohammadi-Aghdam (2014). On the difference of pressure readings from the numerical, experimental and theoretical results in different bird strike studies. Aerosp Sci Technol. Aerospace Science & Technology 32(1): 260-266.
Hedayati, R. and S. Ziaeirad (2011). Foam-Core Effect on the Integrity of Tailplane Leading Edge During Bird-Strike Event. Journal of Aircraft 48(6): 2080-2089.
Jun, L., L. Yulong, Y. Xiancheng, G. Xiaosheng and L. Zongxing (2018). Design of aircraft structures against threat of bird strikes. Chinese Journal of Aeronautics.
Kermanidis, T., G. Labeas, M. Sunaric and L. Ubels (2005). Development and Validation of a Novel Bird Strike Resistant Composite Leading Edge Structure. Applied Composite Materials 12(6): 327-353.
Lavoie, M., A. Gakwaya, M. Nejad Ensan and D. Zimcik (2007). Review of existing numerical methods and validation procedure available for bird strike modelling. ICCES 2(4): 111-118.
Liu, J., Y. Li, X. Gao, P. Liu and L. Kong (2015). Dynamic response of bird strike on aluminium foam-based sandwich panels. International Journal of Crashworthiness 20(4): 325-336.
Liu, J., Y. Li, X. Yu, Z. Tang, X. Gao, J. Lv and Z. Zhang (2017). A novel design for reinforcing the aircraft tail leading edge structure against bird strike. International Journal of Impact Engineering 105: 89-101.
Lopez-Lago, M., R. Casado, A. Bermudez and J. Serna (2017). A predictive model for risk assessment on imminent bird strikes on airport areas. Aerospace Science & Technology 62: 19-30.
Mazzawy, R. S. (2013). The Big Bang-bird strike certification testing. Mechanical Engineering Magazine Select Articles 135(04): 52-54.
Mccarthy, M. A., J. R. Xiao, C. T. Mccarthy, A. Kamoulakos, J. Ramos, J. P. Gallard and V. Melito (2004a). Modelling of Bird Strike on an Aircraft Wing Leading Edge Made from Fibre Metal Laminates – Part 2: Modelling of Impact with SPH Bird Model. Applied Composite Materials 11(5): 317-340.
Mccarthy, M. A., J. R. Xiao, N. Petrinic, A. Kamoulakos and V. Melito (2004b). Modelling of Bird Strike on an Aircraft Wing Leading Edge Made from Fibre Metal Laminates – Part 1: Material Modelling. Applied Composite Materials 11(5): 295-315.
Nicholas, T. (1981). Tensile testing of materials at high rates of strain. Experimental Mechanics 21(5): 177-185.
Olsson, R. (2000). Mass criterion for wave controlled impact response of composite plates. Composites Part A 31(8): 879-887.
Orlando, S., F. Marulo, M. Guida and F. Timbrato (2018). Bird strike assessment for a composite wing flap. International journal of crashworthiness 23(2): 219-235.
Seidt, J. D., J. M. Pereira, J. T. Hammer and A. Gilat (2013). Dynamic Load Measurement of Ballistic Gelatin Impact Using an Instrumented Tube, Springer New York.
ThKermanidis, GLabeas, MSunaric, A. Fjohnson and MHolzapfel (2006). Bird strike simulation on a novel composite leading edge design. International Journal of Crashworthiness 11(3): 189-202.
Vignjevic, R., M. Or3owski, T. D. Vuyst and J. C. Campbell (2013). A parametric study of bird strike on engine blades. International Journal of Impact Engineering 60(60): 44-57.