INTRODUCTION
In recent years, much attention has focused on nanostructured systems applied in electronic devices or to improve mechanical, chemical, structural, optical, electrical and magnetic properties of materials [1, 2]. Manipulation of the thermodynamic and kinetic control processes plays a
key role in crystal growth, which determines the inal crystal habit, phase, shape, and structures [3, 4]. The added value of a compound depends on its structural, morphological and optical properties. These properties depend directly on the crystal structure of the material. Thus, studies relating to the material’s structure, physical properties, and method of synthesis are essential.
Microstructural, structural and optical properties of nanoparticles of
PbO-CrO
3pigment synthesized by a soft route
(Propriedades microestruturais, estruturais e ópticas de nanopartículas de
pigmentos de PbO-CrO
3sintetizadas por rota soft)
V. D. Araújo1*, M. R. B. Andreeta2, L. J. Q. Maia3, R. M. Nascimento4, F. V. Motta4,
M. R. D. Bomio4, C. A. Paskocimas4, M. I. B. Bernardi5
1Unidade Acadêmica do Cabo de Santo Agostinho, Universidade Federal Rural de Pernambuco - UFRPE,
Recife, Brazil 52171-900
2Departamento de Engenharia de Materiais, Universidade Federal de S. Carlos - UFSCar, P.O. Box 676,
S. Carlos, SP, Brazil 13565-905
3Instituto de Física, Universidade Federal de Goiás, Campus Samambaia, C.P. 131, Goiânia,
GO, Brazil 74001-970
4Laboratório de Síntese Química de Materiais LSQM, DEMat, Universidade Federal do Rio Grande do Norte -
UFRN, P.O. Box 1524, Natal, RN, Brazil 59078-970
5Instituto de Física de São Carlos, Universidade de S. Paulo - USP, Av. Trabalhador São-carlense 400,
S. Carlos, SP, Brazil 13560-970 *[email protected]
Abstract
PbCrO4 and Pb2CrO5 particles were synthesized by the polymeric precursor method. Structural and microstructural properties of the
particles were characterized by scanning electron microscopy with ield emission gun, X-ray diffraction, and Raman spectroscopy techniques. The diffuse relectance technique was employed to study the optical properties in the 400-700 nm range. The optical
bandgap of the samples was obtained indirectly. Colorimetric coordinates L*, a*, b* were calculated for the pigment powders as a function of the heat treatment (400-700 oC). The powders displayed colors ranging from green to red. X-ray diffraction
patterns showed the presence of monoclinic PbCrO4 phase in green samples, while red powders had a monoclinic Pb2CrO5 phase structure. The Raman spectra of the PbCrO4 and Pb2CrO5 powders were in good agreement with those reported in the literature. The synthesized compounds can be used as green and red pigments with high thermal stability.
Keywords: nanoparticles, PbCrO4, structural properties, microstructural properties, optical properties.
Resumo
Partículas de PbCrO4 and Pb2CrO5 foram sintetizadas pelo método do precursor polimérico. Propriedades estruturais e
microestruturais das partículas forma caracterizadas por técnicas de microscopia eletrônica de varredura, difração de raios X e espectroscopia Raman. A técnica de reletância difusa foi empregada para o estudo das propriedades ópticas na faixa 400-700 nm. O bandgap óptico foi obtido indiretamente. As coordenadas colorimétricas L*, a*, b* foram calculadas para os pós de
pigmento em função do tratamento térmico (400-700 oC). Os pós apresentaram cores do verde ao vermelho. Os difratogramas de
raios X mostraram a presença da fase PbCrO4 monoclínica nas amostras verdes, enquanto os pós vermelhos apresentaram a fase
Pb2CrO5 monoclínica. Os espectros Raman dos pós de PbCrO4 e Pb2CrO5 estão em concordância com os reportados. Os compostos
sintetizados podem ser usados como pigmentos verdes e vermelhos com alta estabilidade térmica.
Lead chromate (PbCrO4) is an important solid material that is widely used as a photosensitizer and yellow pigment with a monoclinic P21/n structure [5]. Pb2CrO5 was irst used as a dielectric material in 1968 [6].Dilead pentaoxochromate (Pb2CrO5) with a monoclinic C2/m structure has a large absorption coeficient and a high-speed photo-response in the visible region of the electromagnetic spectrum. Therefore, it is a potential candidate for application in photoconductors, optoelectronic devices, and reversible thermochromism materials [7]. Pb2CrO5 has been found to have wide band gap energy (Eg ~ 2.1-2.3 eV) and a large absorption coeficient (µ ~ 104 cm-1). The photoresponse and
performance of Pb2CrO5 devices described in the literature suggest that Pb2CrO5 may be classiied as a new type of optoelectronic dielectric material that could potentially be used in room temperature photoconductors for the visible and ultraviolet regions [8]. The synthesis of PbCrO4 and Pb2CrO5 crystals with well-controlled sizes and shapes is crucial due to their potential applications. The literature describes various procedures to synthesize PbCrO4 and Pb2CrO5 crystalline phases into different shapes, such as spherical nanoparticles, nanorods, microparticles, nanowires, rectangular nanorods and nanotubes [7, 9-15]. The reported methods are microemulsion [9], hydrothermal [10, 11], self-seeding template growth (SSTG) process [12], microwave-assisted ionic liquid method [7, 13], and room temperature reaction of solutions without the additives [14]. The polymeric precursor route, the Pechini method, is a nonconventional method of synthesis that offers the advantage of yielding homogeneous systems with a high degree of purity, which can be calcined at relatively low temperatures, allowing the synthesis of nanometric oxides with well deined and controlled properties.
In this work, PbCrO4 and Pb2CrO5 crystalline particles, known as crocoites, were synthesized via a soft chemical route, the polymeric precursor method, and the structural, microstructural and optical properties of these crocoites annealed at different temperatures were examined to be used as pigments.
EXPERIMENTAL
The polymeric precursor method is based on the polymerization of metallic citrate using ethylene glycol. A hydrocarboxylic acid such as citric acid is normally used to chelate cations in an aqueous solution. The addition of a polyalcohol such as ethylene glycol leads to the formation of an organic ester. Polymerization promoted by heating to around 100 ºC results a homogenous resin in which the metal ions are distributed uniformly throughout the organic matrix. The resin is then calcined to produce the desired oxides. Lead acetate trihydrate, (CH3CO2)2Pb·3H2O, and chromium trioxide, CrO3, were used as precursors. The lead acetate and chromium trioxide were dissolved in water and then mixed into an aqueous citric acid solution (100 °C) under constant stirring The pH of the solution was adjusted to 1 with nitric acid. Next, ethylene glycol (HOCH2CH2OH)
was added to polymerize the citrate by a polyesteriication reaction. The citric acid:metal molar ratio was 6:1, while the citric acid:ethylene glycol mass ratio was 60:40. The Pb:Cr ratio was adjusted in order to obtain two compositions: PbCrO4 and Pb2CrO5. The resulting polymeric resin was then calcined to produce the desired oxide. The puff (irst calcination) was made at 400 oC/4 h in an air atmosphere.
After annealing from 500 to 700 °C for 2 h, SEM micrographs of the pigment powders were taken using a Zeiss (DSM-940A) scanning electron microscope equipped with a ield emission gun (SEM-FEG), providing larger than 100,000 X magniication.
Raman spectra was recorded with a confocal Raman microscope (WiTec, Alpha 300S – CRM 200) equipped with a piezo scanner and 100 X microscopic objectives (N.A.: 0.90; Nikon, Tokyo, Japan). The spatial resolution in this experiment reached up to 400 nm. Samples were excited with an air-cooled Ar ion laser (Melles Griot, model 35-LAL – 515-230) operating at 514.5 nm with 1 mW of power. Raman data were also obtained on a monochromator equipped with 1800-groove gratings.
The powders were structurally characterized using an automatic X-ray diffractometer (Rigaku, Rotalex RU200B) with Cukα radiation (50 kV, 100 mA, l = 1.5405 Å) and in a q–2q coniguration using a graphite monochromator. The scanning range was between 10 and 75° (2θ), with a step size of 0.02° and a step time of 1 s. The Rietveld analysis was performed with the Rietveld reinement program GSAS [15]. A pseudo-Voigt proile function was used.
The diffuse relectance and colorimetric coordinates of the pigments were measured using a spectrophotometer (Minolta, CM2600d) in the 400 and 700 nm range, equipped with standard D65 (daylight) light source, following the CIE-L*a*b* colorimetric method recommended by the CIE (Commission Internationale de l’Eclairage) [16]. Other optical property, such as the optical bandgap was obtained indirectly.
RESULTS AND DISCUSSION
The powders obtained in this study presented a broad spectrum of colors ranging from green to red. It known that the colors of some compounds containing transition metals depend on both the structural arrangements of the elements and on the shape and size of the particles. Herewith, we begin this section evaluating the grain size and morphology of the synthesized powders by the SEM-FEG technique.
Fig. 2 shows the Raman spectra of PbCrO4 and Pb2CrO5 samples. According to Wilkins [17] and Frost [18], all vibrational modes of crocoite are Raman-active (1A1 +1E +2T2), but only specimens with T2 symmetry are IR-active. All degeneracies were removed from the crocoites, resulting in 9A vibrational modes, all Raman- and IR-active. The Cr-O distance in crocoite is around 1.65 Å, indicating a substantial amount of multiple-character bonds in the chromate ion. This leads to strong Raman interactions [17]. The comparative
results are presented in Table I, where ν1 and ν3 are the symmetric and asymmetric stretching vibrations of CrO4
2-respectively, ν2 and ν4 are the deformation modes for CrO42.
Our results were consistent with those of Wilkins [17] and Frost [18], demonstrating the eficiency of the polymeric precursor method to obtain pure PbCrO4 and Pb2CrO5 phases. The vibrational modes of Pb2CrO5 showed lower frequencies than those of PbCrO4, indicating that the former has a more compact structure which acts as a barrier against Figure 1: FEG-SEM images of the PbCrO4 (a, b) and Pb2CrO5 (c, d) after calcination at 400 oC (a, c) and 700 oC (b, d).
[Figura 1: Imagens obtidas em microscópio eletrônico de varredura de PbCrO4 (a, b) e Pb2CrO5 (c, d) após calcinação 400 oC (a, c) e 700 oC (b, d).]
PbCrO4 [17]
PbCrO4 This work
Pb2CrO5 [18]
Pb2CrO5 This work
Assignments [17, 18]
853 838 -825 400 377 359 336 326
852 837 -829 401 375 366 344 325
856 848 839 826 398 377 356 339 322
850 845 835 823 391 377 353 336 322
ν 3 ν 1 ν 3 ν 3 ν 4 ν 4 ν 4 ν 2 ν 2 Table I - Raman bands of the samples compared with those reported.
uncontrolled grain growth. Pb2CrO5 therefore has smaller particles than PbCrO4, as illustrated in Fig. 1.
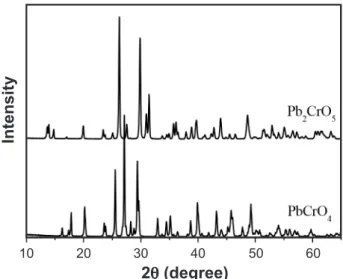
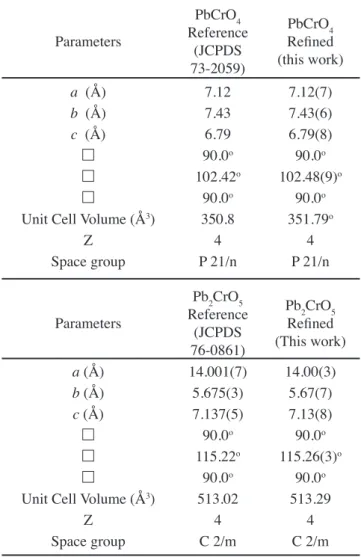
Fig. 3 presents the X-ray diffraction patterns of the PbCrO4 and Pb2CrO5 compositions calcined at 400 °C for 4h. The samples annealead at 500 and 600 °C have similar diffraction patterns to the calcined at 400 °C and thus are not presented here. Figs. 4a and 4b show the Rietveld reinement of PbCrO4 and Pb2CrO5 samples, respectively.
All the relection peaks in Fig. 4(a) can be indexed easily as PbCrO4 monoclinic phase (space group P21/n(14)) (JCPDS 73-2059), while the peaks in Fig. 4b correspond to Pb2CrO5 monoclinic phase (space group C2m (12)) (JCPDS 76-0861).
The reinement parameters, Rwp, Rp and RBragg for the PbCrO4 sample synthesized at 700 oC are 9.71, 6.49 and
3.30 respectively, and for the Pb2CrO5 sample 6.74, 4.89 and 1.92 respectively, where Rwp and Rp are indicators of the it quality of the calculated pattern to the observed data and RBragg monitors the improvement in the structure model, while Table II compares the values of these parameters with those reported in the literature.
The low values of the reliability parameters Rwp and RBragg indicate the good quality of the reinements [19]. An excellent agreement was observed between the unit cell parameters and unit cell volume of the PbCrO4 and Pb2CrO5 phases determined from the Rietveld reinements and the values reported in the literature [20, 21]. This statement is also consistent with the Raman results presented earlier.
Following, we present the results and discussions about optical properties of the nanopowders to be applied as pigments. One of the mechanisms responsible for color Figure 2: Raman shift spectra of the PbCrO4 and Pb2CrO5
nanometric pigment powders synthesized at 700 oC.
[Figura 2: Espectros Raman de pós de pigmentos nanométricos de PbCrO4 e Pb2CrO5 sintetizados a 700 oC.]
Raman Shift (cm-1)
In
te
n
s
ity
300 600 900
2q (degree)
2q (degree)
2q (degree)
In
te
n
s
ity
In
te
n
s
ity
In
te
n
s
ity
10
10
10
30
30 20
20
40
40
55
55 15
15
35
35
50
50 25
25
45
45
60
60
30 60
20 40 50
Figure 3: X-ray diffraction patterns of the PbCrO4 and Pb2CrO5 after calcination at 400 oC.
[Figura 3: Difratogramas de raios X de PbCrO4 e Pb2CrO5
após calcinação a 400 oC.]
Figure 4: X-ray diffraction patterns and Rietveld reinement of the (a) PbCrO4 and (b) Pb2CrO5 after calcination at 700 ºC/2 h.
[Figura 4: Difratogramas de raios X e reinamento de
generation is known as charge transfer. This mechanism, which consists of the motion of an electron from one transition metal ion to another, produced by the absorption of light energy [22], is responsible for the color of PbCrO4 and Pb2CrO5 compounds. Highly charged ions such as Cr6+ are not favored energetically. Cr6+ ions exert a strong
attraction on electrons, and the movement of some fraction of one or more electrons from the oxygen back to the central ions produces a much more stable arrangement, resulting in ligand-to-metal (anion-to-cation) charge transfer transitions and the color of both compounds. For PbCrO4 and Pb2CrO5, the result is a broad absorption band at blue and high transmittance for the other wavelengths, leading to an green color for PbCrO4 and a red color for Pb2CrO5 [23].
Fig. 5 shows the diffuse relectance of PbCrO4 and
Pb2CrO5 powders. The diffuse relectance spectra indicate that absorption bands in the 560 nm region of PbCrO4 (a green powder) and 400-550 nm of Pb2CrO5 (a red powder) redshift as the annealing temperature increases, as illustrated in Figs. 5a and 5b.
The three absorption bands in Fig. 5a for PbCrO4 at around 400, 500 and 600 nm are in agreement with those observed by Reddy et al [24]. The irst two bands are assigned to the transitions 1t1g 2e, 6t2g 2e respectively, and the band at 600 nm might be due to a forbidden transition.
It is well known that the morphology and size of materials have important effects on their color [25-27]. We believe that the red shift in diffuse relectance in Fig. 6 may be attributed to small differences in particle size and shape with increasing annealing temperature as can be seen in Fig. 1.
Color can be measured by several methods, but in ceramics, the most common method to determine the color of a product is the CIE-L*a*b* [17]. This method measures the intensity of diffuse relectance in the visible region to obtain the three colorimetric coordinates L*, a*, b*, yielding the black/white lightness, green/red and blue/yellow color intensities, respectively, as well as the total color difference, DE. This parameter DE is deined as the total color difference between the studied material and a reference sample, i.e., DE2 = DL*2 + Da*2 + Db*2.
For each correspondent composition, the sample calcined Parameters
PbCrO4 Reference
(JCPDS 73-2059)
PbCrO4 Reined (this work)
a (Å) 7.12 7.12(7)
b (Å) 7.43 7.43(6)
c (Å) 6.79 6.79(8)
90.0o 90.0o
102.42o 102.48(9)o
90.0o 90.0o
Unit Cell Volume (Å3) 350.8 351.79o
Z 4 4
Space group P 21/n P 21/n
Parameters
Pb2CrO5 Reference
(JCPDS 76-0861)
Pb2CrO5 Reined (This work)
a (Å) 14.001(7) 14.00(3)
b (Å) 5.675(3) 5.67(7)
c (Å) 7.137(5) 7.13(8)
90.0o 90.0o
115.22o 115.26(3)o
90.0o 90.0o
Unit Cell Volume (Å3) 513.02 513.29
Z 4 4
Space group C 2/m C 2/m
Table II - Values of Rietveld reinement of PbCrO4 and
Pb2CrO5 compared with those in the literature.
[Tabela II - Valores de reinamento de Rietveld de PbCrO4 e
Pb2CrO5 comparados com od publicados.]
Figure 5: Diffuse relectance spectra of a) PbCrO4, and b)
Pb2CrO5 calcined at different temperatures.
[Figura 5: Espectros de reletância difusa de a) PbCrO4 e b) Pb2CrO5 calcinados a diferentes temperaturas.]
Wavelength (nm)
Wavelength (nm)
D
iffu
se
re
le
cta
nc
e
D
iffu
se
re
le
cta
nc
e
400
400
600
600 500
500
700
700 450
450
650
650 550
at 400 °C for 4 h was used as reference. Table III presents the colorimetric coordinates (L*, a*, b*) and total color difference (DE) of PbCrO4 and Pb2CrO5 nanoparticles
obtained in this work, using type D65-10° (day light) light source determined by the CIE-L*a*b* standard colorimetric method.
The samples’ colorimetric values a*, b* and L* reduced as the calcination temperature was increased, indicating that their red color enhanced by increasing the temperature. We believe that these changes are related to differences in particle size as the annealing temperature increases, as shown for the diffuse relectance above. It is related to defects on the as prepared surface nanoparticles. The defects on crystalline surface nanoparticles are reduced, once the crystallinity increased with the temperature as showed by DRX results.
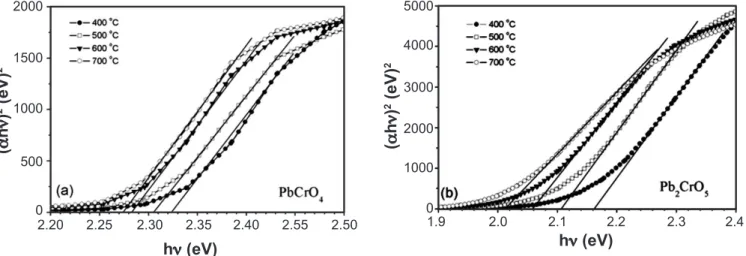
Other optical property, such as the optical bandgap
Figure 6: Absorption coeficient as a function of incident photon energy in the near band gap region of PbCrO4 (a) and
Pb2CrO5 (b) powders calcined at different temperatures.
[Figura 6: Coeiciente de absorção em função da energia do fóton incidente na região próxima do bandgap de pós de PbCrO4
(a) e Pb2CrO5 calcinados em diferentes temperaturas.]
2.20 2000
1000 1500
500
0
hn (eV)
(
a
h
n
)
2 (e
V)
2
2.30 2.40 2.50
2.25 2.35 2.55 1.9
5000
3000 4000
1000 2000
0
hn (eV)
(
a
h
n
)
2 (e
V)
2
2.1 2.3
2.0 2.2 2.4
was obtained indirectly. Considering the high absorption region, the transmittance T and relectance R followed a simplecorrelation with absorption coeficient:
T = A exp(-ld) (A)
where A is approximately equal to the unity at the absorption edge and d is the thickness of the sample. The relation between the absorption coeficient l and incident photon energy hn for allowed direct transition can be written as [28, 29]
Dhn = A1 (hn –Eg)1/2 (B)
where A1 is a constant and Eg is the direct bandgap.
The (Dhn)2 vs. hn plots for the powders calcined at
different temperatures are shown in Fig. 6. A linear behavior Table III - Colorimetric coordinates (a*, b* and L*), total color difference (DE) of PbCrO4 and Pb2CrO5, using type D65
(daylight) light source, following the CIE-L*a*b* standard colorimetric method, and the optical bandgap of the powders as a function of the heat treatment.
[Tabela III - Coodenadas colorimétricas (a*, b* e c*) diferença de cor total (DE) de PbCrO4 e Pb2CrO5, usando fonte de luz (luz do dia) D65, segundo o método colorimétrico padrão CIE-L*a*b*, e o bandgap óptico dos pós em função do tratamento térmico.]
Sample – Calcination
Temperature Light Source a* b* L* ΔE Eg (± 0.05 eV)
PbCrO4 – 400oC D65-10° 10.07 38.17 43.91 - 2.32
PbCrO4 – 500oC D65-10° 11.06 33.75 42.73 4,68 3.31
PbCrO4 – 600oC D65-10° 10.61 27.86 37.49 12,16 2.28
PbCrO4 – 700oC D65-10° 10.26 26.85 37.70 12,91 2.27
Pb2CrO5 – 400oC D65-10° 42.25 49.93 44.92 - 2.16
Pb2CrO5 – 500oC D65-10° 41.26 36.24 41.36 14,18 2.11
Pb2CrO5 – 600oC D65-10° 35.99 31.17 40.41 20,28 2.06
can be observed in a certain range of the curves, supporting the interpretation of direct Eg band gap for powders [28, 29]. Therefore, the Eg bandgap of the powders can be obtained by extrapolating relation (B) between 2.32 eV and 2.27 eV for PbCrO4 and 2.16 eV and 2.01 eV for Pb2CrO5. Table III gives the optical bandgap values determined from Figure 6. As can be seen, the band gap of powders decreases from 2.32 eV to 2.27 eV for PbCrO4 and from 2.16 eV to 2.01 eV for Pb2CrO5 as the heat treatment increases from 400 oC to 700 oC. Elevating
the treatment temperature, increase powder crystallinity and reduces bandgap, thus increasing the conductive nature of compounds.
Lu et al [30] have observed that change in energy gap with the grain size of BaTiO3 ilms must have a close relation to the interatomic spacing (lattice parameters). Also, they have mentioned that the decrease in bandgap value on annealing (amorphous à microcrystalline) might be due to the lowering of the interatomic spacing, which reduced the polarization and electron-hole interaction corrections. Certainly, similar effects occur in our synthesized crocoites powders. Once that the crystallinity increases with the annealing, and at 700 oC we
have well crystallized powders with lattice parameters close to those reported in literature, Table II. Then, the color changes can be attributed to the crystallinity degree and the optical bandgap. It seems that for Pb2CrO5 powder, the color changes are directly related to the optical bandgap displacement. About the PbCrO4 compound, the color changes are related to two factors: the optical band gap and the band centered around 600 nm (Fig. 5a).
CONCLUSIONS
The polymeric precursor method proved eficient to synthesize pigments with colors ranging from green to red, since it yielded pure PbCrO4 and Pb2CrO5 phases. The relectance and colorimetric measurements showed that the PbCrO4 samples presented varying shades of green to mustard, while the color of the Pb2CrO5 samples ranged from orange to red. The Raman spectra were congruous with the X-ray diffraction patterns, indicating the presence of PbCrO4 and Pb2CrO5 in the samples. Moreover, the bands detected were compatible with those reported. The samples displayed strong coalescence and considerable particle agglomeration. The colors of the synthesized pigments were correlated with the type of phase present in each sample, as well as the particle size, the crystallinity degree and the optical bandgap.
ACKNOWLEDGEMENTS
The authors gratefully acknowledge the inancial support of the Brazilian research funding agencies FAPESP, CNPq, PRONEX/FINEP and CAPES.
REFERENCES
[1] C. Burda, X. B. Chen, R. Narayanan, M.A. El-Sayed. Chem. Rev. 105 (2005) 1025-1102.
[2] T. L. Porter, M. E. Hagerman, B. P. Reynolds, M. P. Eastman, R. A. Parnell, J. Polym. Sci. Part B-Polym. Phys. 36 (1998) 673-679.
[3] H. Cölfen, S. Mann. Angew. Chem., Int. Ed.42 (2003) 2350-2365.
[4] S. R. Dickinson, K. M. McGrath. J. Mat. Chem. 13 (2003) 928-933.
[5] K. Toda, S. Watanabe. J. Mat. Sci. Lett. 18 (1999) 689-690.
[6] N. Yukami, M. Ikeda, Y. Harada, M. Nisitani, T. Nishikura. IEEE Trans. Electron Dev. 33 (1986) 520-525. [7] W. W. Wang, Y. J. Zhu. Cryst. Growth Des. 5 (2005) 505-507.
[8] K. A. Wishah, M. M. Abdul-Gader. Appl. Phys. A: Mater. Sci. Process. 66 (1998) 229-234.
[9] A. K. Panda, B. B. Bhowmik, A. R. Das, S. P. Moulik. Langmuir 17 (2001) 1811-1816.
[10] J. Liang, Y. Li, J. Cryst. Growth 261 (2004) 577-580. [11] X. L. Hu, Y. J. Zhu, Chem. Lett. 33 (2004) 880-881. [12] D. Chen, K. Tang, Z. Liang, Y. Liu, H. Zheng, Nanotechnology 16 (2005) 2619-2624.
[13] Y. J. Zhu, W. W. Wang, R. J. Qi, X. L. Hu, Angew. Chem., Int. Ed.43 (2004) 1410-1414.
[14] J. H. Xiang, S. H. Yu, Z. Xu, Cryst. Growth Des. 4 (2004) 1311-1315.
[15] A. C. Larson, R. B. Von Dreele, Los Alamos National Laboratory, Los Alamos, EUA, Copyright, 1985–2000, The Regents of the University of California (2001).
[16] CIE, “Recommendations of uniform color spaces, color difference equations, phychometrics color terms”, Suppl.2 CIE Publ. 15 (E1e1.31) (1971), Bureau Central de la CIE, Paris, France (1978).
[17] R. W. T. Wilkins, Mineral. Mag. 38 (1971) 249-250. [18] R. L. Frost, J. Raman Spectrosc. 35 (2004) 153-158. [19] M. L. Moreira, G. P. Mambrini, D. P. Volanti, E. R. Leite, M. O. Orlandi, P. S. Pizani, V. R. Mastelaro, C. O. Paiva-Santos, E. Longo, J. A. Varela, Chem. Mater. 20 (2008) 5381-5387.
[20] S. Quareni, R. De Pieri, Rend. Soc. Mineral. Ital. 20 (1964) 235-250.
[21] S. A. Williams, W. J. McLean, J. W. Anthony, Am. Mineral. 55 (1970) 784-792.
[22] K. Nassau, “The Physics and Chemistry of color”, Wiley Intersci. Publ., New York, USA (2001).
[23] K. Nassau, Am. Mineral. 63 (1978) 219-229.
[24] B. J. Reddy, K. B. N. Sarma, Phys. Lett. 86A (1981) 386-388.
[25] M. Quinten, Appl. Phys. B 73 (2001) 317-326.
[26] J. Wang, W. B. White, J. H. Adair, J. Am. Ceram. Soc. 88 (2005) 3449-3454.
[27] L. J. R. Marshall, J. R. Williams, M. J. Almond, S. D. M. Atkinson, S. R. Cook, W. Matthews, J. L. Mortimore, Spectrochim. Acta, Part A 61 (2006) 233-241.
[28] L. J. Q. Maia, M. I. B. Bernardi, C. A. C. Feitosa, V. R. Mastelaro, A. R. Zanatta, A. C. Hernandes, Thin Solid Films 457 (2004) 246-252.
Messaddeq, S. J. L. Ribeiro, R. R. Gonçalves. J. Phys.: Condens. Matter 20 (2008) 285224.
[30] X. M. Lu, J. S. Zhu, W. Y. Zhang, G. Q. Ma, Y. N. Wang, Thin Solid Films 274 (1996) 165-168.
![Fig. 2 shows the Raman spectra of PbCrO 4 and Pb 2 CrO 5 samples. According to Wilkins [17] and Frost [18], all vibrational modes of crocoite are Raman-active (1A 1 +1E +2T 2 ), but only specimens with T 2 symmetry are IR-active](https://thumb-eu.123doks.com/thumbv2/123dok_br/18892868.425538/3.892.110.790.112.623/spectra-samples-according-wilkins-vibrational-crocoite-specimens-symmetry.webp)