Research Article
Structural, Optical, and Magnetic Properties of NiMoO
4
Nanorods Prepared by Microwave Sintering
Ana P. de Moura,
1Larissa H. de Oliveira,
1Ieda L. V. Rosa,
2Camila S. Xavier,
1Paulo N. Lisboa-Filho,
3Máximo S. Li,
4Felipe A. La Porta,
1,2Elson Longo,
1and José A. Varela
11Instituto de Qu´ımica, UNESP, 14800-900 Araraquara, SP, Brazil 2Departamento de Qu´ımica, UFSCar, 13565-905 S˜ao Carlos, SP, Brazil 3Departamento de F´ısica, UNESP, 13565-905 Bauru, SP, Brazil 4Departamento de F´ısica, USP, 13560-970 S˜ao Carlos, SP, Brazil
Correspondence should be addressed to Felipe A. La Porta; felipe [email protected]
Received 29 August 2014; Accepted 4 December 2014
Academic Editor: Ching-Fuh Lin
Copyright © 2015 Ana P. de Moura et al. his is an open access article distributed under the Creative Commons Attribution License, which permits unrestricted use, distribution, and reproduction in any medium, provided the original work is properly cited.
We report on the structural, optical, and magnetic properties of �,�-NiMoO4 nanorods synthesized by annealing the NiMoO4:nH2O precursor at 600∘C for 10 minutes in a domestic microwave. he crystalline structure properties of�,�-NiMoO4 were investigated using X-ray difraction (XRD), Fourier transform infrared (FTIR), and Raman (FT-Raman) spectroscopies. he particle morphologies and size distributions were identiied by ield emission microscopy (FE-SEM). Experimental data were obtained by magnetization measurements for diferent applied magnetic ields. Optical properties were analyzed by ultraviolet-visible (UV-vis) and photoluminescence (PL) measurements. Our results revealed that the oxygen atoms occupy diferent positions and are very disturbed in the lattice and exhibit a particular characteristic related to diferences in the length of the chemical bonds (Ni-O and Mo-O) of the cluster structure or defect densities in the crystalline�,�-NiMoO4nanorods, which are the key to a deeper understanding of the exploitable physical and chemical properties in this study.
1. Introduction
Over the past few decades, morphology as well as size con-trol of crystalline materials is the key requirement for their industrial exploitation with unprecedented capabilities in
emerging technologies [1–4]. In this context, nickel
molyb-dates (NiMoO4) have received much attention, due to their
remarkable record of widespread applications in diferent ields of materials science, such as photocatalysis, phosphors, light-emitting diodes, optical ibers, humidity sensors,
scin-tillators, and magnetic properties [5]. Under atmospheric
pressure, three compounds of NiMoO4are known: the low
temperature�-phase, the high temperature�-isomorph, and
the hydrate and NiMoO4:nH2O, respectively [6–10]. Both�
-NiMoO4and�-NiMoO4are oten obtained by heating their
nickel molybdate hydrates NiMoO4:nH2O that is utilized as a
precursor [11]. On the other hand, the synthesis of the pure�
-NiMoO4phase is usually generated by heating the�-NiMoO4
at temperature above 760∘C; however, the�-NiMoO4phase
is stable only above 180∘C due that on cooling below at
this temperature transforms again into the�-NiMoO4phase,
which is more stable under these conditions [12–15]. hese
studies have examined the catalytic properties of both phases
and in all these cases the�-NiMoO4phase showed a higher
eiciency in these tests. However, very little has been reported on the optical properties of these systems.
It has been known that preparation and conditions meth-ods become essential to control the obtention of semicon-ductor nanomaterials with the tunable physical and chemical properties, which are very important in a wide range of
appli-cations in nanotechnology [16–18]. Recently, the domestic
microwave oven has been successfully employed to obtain
94
92
90
88
86
12.3%
W
eig
h
t (%)
150 300 450 600 750
Temperature (∘C)
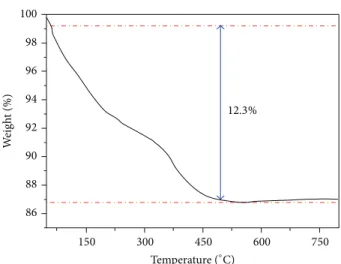
Figure 1: TGA curve of the precursor NiMoO4⋅nH2O.
many ceramic materials with improved quality and size
dis-tributions of the nanomaterials [19–22]. Advantages such as
rapid heating, selective material coupling, and enhanced reaction kinetics make the microwave process an attractive
route for these materials’ synthesis [23–27], showing
signif-icant advantages against conventional sintering procedures
[28–30]. Recently, Oghbaei and Mirzaee [30] reported a
complete review on the subject.
herefore, in this work, we report the correlation among
optical and magnetic properties of the�,�-NiMoO4
nano-rods synthesized by annealing the NiMoO4:nH2O precursor
at 600∘C for 10 minutes in a domestic microwave. Moreover,
these nanorods were analyzed by XRD, FTIR, FT-Raman, FE-SEM, UV-vis, and PL, and magnetic behavior was also studied. In this context, the structural and electronic order-disorder efects inluence physical properties as it will be shown here. In addition, the efects, as well as the inluence, of microwave heating by using the synthetic process are reported.
2. Materials and Methods
2.1. Synthesis of�,�-NiMoO4Powders. In a typical procedure, 2 mmol of sodium molybdate solution was dissolved in 50 mL of distilled water. Aterwards, 2 mmol of nickel nitrate hexahydrate was dissolved in 50 mL of deionized water, which was slowly added into the sodium molybdate solution under magnetic stirring giving rise to a homogeneous solution (pH = 6). he reactional mixture was put under magnetic stirring during 30 minutes. hen, the obtained precipitate was water washed for several times, and the powder of
green-yellow color was dried at 60∘C for 12 hours under
air atmosphere in a conventional furnace. he obtained
precursor was investigated using thermal analysis.Figure 1
shows the TGA curve for the thermal decomposition of the
precursor. TGA curves of the NiMoO4⋅nH2O samples with
the temperature ranging from 30 to 800∘C show that a mass
losses at about 480∘C was 12.3% in the net weight, mainly
ascribed to the loss of water content in the NiMoO4⋅nH2O.
microwave sintering furnace at 600∘C for 10 minutes.
2.2. Characterizations. he powders were characterized by
X-ray difraction (XRD) using a Rigaku-DMax 2500 PC,
Japan, with Cu K� radiation (� = 1.540598A) in the˚ 2�
range from 10∘to 75∘using a scanning rate of 0.02∘/min. he
phase analysis by the Rietveld and Le Bail method [31,32]
was carried out using the General Structure Analysis System
(GSAS) sotware [33]. FT-IR spectroscopies were performed
in the range from 400 to 4000 cm−1, using a Bruker-Equinox
55 (Germany) spectrometer in transmittance mode. FT-Raman spectroscopy was recorded with a Bruker-RFS 100 (Germany). he spectra were obtained using a 1064 nm line of Nd:YAG laser, keeping its maximum output power at 110 mW. he morphologies of the samples were veriied using a ield emission gun scanning electron microscopy (Jeol JSM 6330F). UV-vis spectra were taken using Cary 5G (Varian, USA) equipment in the difuse relection mode. he thermal decomposition of the precursor powders was studied by thermogravimetric analysis (TGA/DTA) on a TGA2050 thermal analysis device (American TA Corporation). TGA determination was carried out in air at a heating rate of
20∘C min−1in the range from room temperature to 900∘C.
he PL measurements were taken in a hermal Jarrel-Ash Monospec 27 monochromator and a Hamamatsu R446 photomultiplier. he 350.7 nm exciting wavelength of a kryp-ton ion laser (Coherent Innova) was used with the nominal output power of the laser power kept at 200 mW. All the mea-surements were taken at room temperature. Magnetization versus an applied ield in a zero ield cooled (ZFC) and ield cooled (FC) measurements was performed using a Quantum Design Magnetic Properties Measurement System (MPMS) XL-5 Superconducting Quantum Interference Device.
3. Results and Discussion
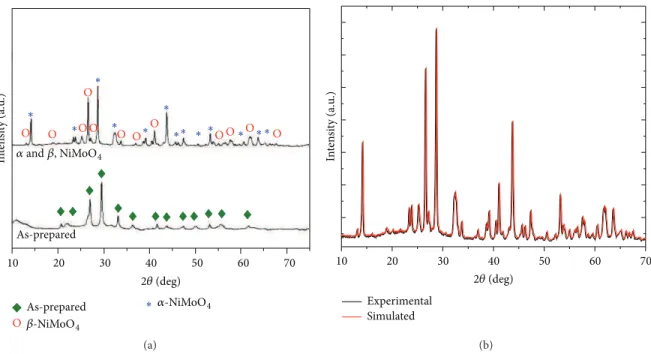
he crystallinity and crystal structures of the precursor and
calcined products (�- and�-NiMoO4) were examined by
X-ray difraction (XRD) as shown inFigure 2(a). he precursor
composition is mainly associated with the hydrate precur-sor. his conclusion was possible, since the difractograms present the characteristic peaks of this matrix according to
JCPDS data ile number 13-0128 [34]. In the XRD pattern
of the precursor calcined all the relectance peaks can be
perfectly indexed to the mixture of the �-NiMoO4 and �
-NiMoO4phases that it was possible to identify the presence
of intense well deined and sharp difraction peaks, which are characteristics of solids structurally ordered in a long-range, according to the JCPDS data ile numbers 33-948 and 12-348, respectively. Under these conditions we can see that the
sample is richer in the�-NiMoO4phase. his conclusion is
in line with previous work of other groups [34–37].
From the structural point of view, �-NiMoO4 and �
In
ten
si
ty (a.u
.)
�and�, NiMoO4
As-prepared
As-prepared �-NiMoO4
�-NiMoO4
∗ ∗
∗
∗
∗ ∗
∗
∗
∗ ∗ ∗ ∗ ∗∗
O O O
O
O
O O
O O O O O O
10 20 30 40 50 60 70
2𝜃(deg)
(a)
10 20 30 40 50 60 70
Experimental Simulated
In
ten
si
ty (a.u
.)
2𝜃(deg)
(b)
Figure 2: (a) XRD patterns of the as-prepared powder and the powders heated at 600∘C for 10 minutes in a microwave oven together with (b) structural reinements plot for the�,�-NiMoO4nanostructures.
space C12/m1) and the most important diferences between both phases are diferent coordination for the molybde-num ions in the crystal structure, being octahedral cluster,
[MoO6], for the�-NiMoO4 and tetrahedral one, [MoO4],
for the �-NiMoO4 powder [30]. In order to analyze and
understand whether there are diferences in the structural
arrangements of both phases in the sample calcined at 600∘C
for 10 minutes in a domestic microwave, the Rietveld and
Le Bail reinement method was employed (seeFigure 2(b)).
In particular, the Rietveld method is generally restricted to crystalline phases for which structures are well known
allow-ing the quantiication of the phase mixtures [38]. However,
for the�-NiMoO4phase these parameters are not very well
known. In this context, the Le Bail method is very similar to the Rietveld method, except that in this method there is no need to make the crystal structure reinement, and allowing an adjustment that can be obtained by the integrated intensity
and the positions of all peaks in the XRD proile [32,39], and
this strategy was used here for the structural determination
of the �-NiMoO4 phase. In this respect, during the XRD
reinements the structural parameters such as scale factor, background with exponential shit, microstructure, crystal structure, shit lattice constants, proile half-width
parame-ters(�,V, �), lattice parameters, texture, factor occupancy,
and atomic site occupancies were optimized using the GSAS
program [33]. he XRD reinement results of the unit cell
parameters are� = 9.602A,˚ � = 8.769A,˚ � = 7.665A, and˚ �
= 114.24∘for�-NiMoO4, while� = 10.094A,˚ � = 9.203A,˚ � =
6.996A, and˚ �= 107.17∘ for�-NiMoO4phases, respectively.
Clearly, the diference between the measured and calculated patterns is considered a way to verify the success of the
reinement method, as shown inFigure 2(b); however, it is
necessary to check values of the itting parameters for greater
control of these results. In general, the criteria depend on the type of structure, in general, are recommended low values of
the Rw (<10%) and�2(<2) more reliable are the results of the
reinement [1]. As can be observed inFigure 2(b), the quality
of the XRD reinement was assessed by the values of the itting
parameters (�WP = 4.3%,�Bragg = 0.9%, and�2 = 1.17)
indicating good agreement between reined and observed
XRD patterns for the sample calcined at 600∘C for 10 minutes
in a domestic microwave, and it was noted that the reined parameters are very close to those published in the literature
by Haetge et al. [35]. However, some variations in the atomic
positions related to oxygen atoms were observed while the nickel and molybdenum atoms remain ixed in their positions within the framework. hese results indicate the existence
of local structural distortions on the [NiO8], [MoO4], and
[MoO6] clusters of �,�-NiMoO4 nanorods synthesized by
annealing the NiMoO4:�H2O precursor at 600∘C for 10
minutes in a domestic microwave. In this case, the employed strategy provides information on unit cell parameters, so it can not be used for quantiication of the phases present in this sample.
Figures3(a)and3(b)illustrate the FTIR and FT-Raman
spectra for the�,�-NiMoO4powders synthesized via the
pre-cursor decomposition. According to the FTIR spectra shown inFigure 3(a), the presence of large bands was observed at
3470 cm−1 and 1622 cm−1, which could be associated with
the stretching and lexing modes of the O-H linkages from the water molecules adsorbed in the sample surfaces. he
bands at 962 and 882 cm−1can be assigned to the symmetric
and antisymmetric stretching of the Mo=O linkage and
the band at 492 cm−1 could be associated with torsions of
the Mo-O-Mo attachment. he bands at 808 and 706 cm−1,
4000 3500 3000 2500 2000 1500 1000 500 7
7
6 6
5 5
4 4
3 3
2 1
Wavenumber (cm−1)
Wavenumber (cm−1)
T
ra
n
smi
T
ra
n
smi
tt
an
ce (a.u
.) 1200 1000 800 600 400
(a)
200 400 600 800 1000
Raman shit (cm−1)
Raman shit (cm−1)
9 8 7
6 5 4 3 2 1
100 150 200 250 300
In
ten
si
ty (a.u
.)
In
ten
(b)
Figure 3: (a) FTIR and (b) FT-Raman spectra of the�,�-NiMoO4nanorods.
(seeFigure 3(a)).Figure 3(b)shows the FT-Raman spectra of
the�,�-NiMoO4powders indicating that the sample presents
structural organization at short range. he results show that
the band located at 952 cm−1is associated with the symmetric
stretching mode of Mo-O linkage. he bands at 900 and
826 cm−1are due to the asymmetric stretching modes of the
oxygen in O-Mo-O link. he bands observed at 380 cm−1and
361 cm−1are related to the bending modes of asymmetric and
symmetric O-Mo-O. he band located at 733 cm−1is due to
the symmetric stretch of the bond Ni-Mo-O. here is also
a band at around 261 cm−1related to deformation modes of
Mo-O-Mo linkage. Our results are in very good agreement
with other published studies [36,37,40,41].
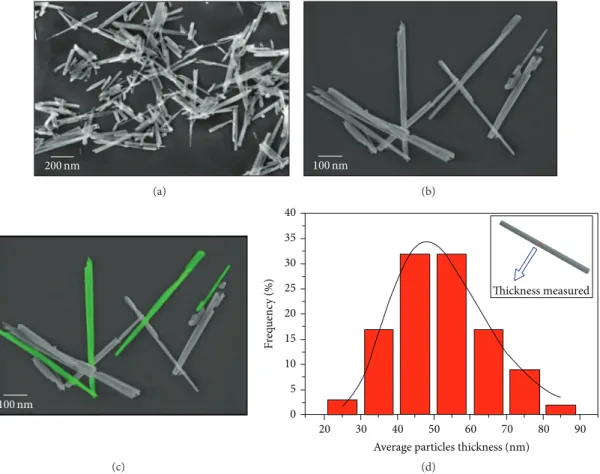
Representative FE-SEM micrographs were used to study
the particle morphologies and size distributions of �,�
-NiMoO4powders (see Figures4(a)–4(d)). In particular,
FE-SEM images show that the synthesis route formed �,�
-NiMoO4 nanorods shape, which corresponds to a
polydis-persed sample (see Figures 4(a)–4(c)). Figure 4(d) shows
the average distribution of the particles width for �,�
-NiMoO4nanorods. FE-SEM micrographs allowed estimating
the average distribution of the particle size for �- and
�-NiMoO4 powders through the counting of around 100
particles.Figure 4(d)shows the average distribution of the
particle width in the range from 25 to 85 nm for�,�-NiMoO4
powders. In this igure, 93% of the particles presented an average width from 35 to 65 nm. he diameters of the nanorods were determined as 100–300 nm and the lengths as
1-2�m.
Owing the higher surface-to-volume ratio in nanoparti-cles perform quite diferently from the corresponding bulk
material [9, 42–44]. Figures 5(a) and 5(b) show the
UV-vis and PL spectra of the �,�-NiMoO4 nanorods. UV-vis
difuse relectance was used to determine the optical band
gap energy of �,�-NiMoO4 nanorods (for more details on
this methodology see [17]). For our sample, the direct optical
band gap presented a value of ∼2.15 eV, which is in good
agreement with values reported in the literature 2.3 eV [45].
he decrease in the band gap value can be attributed to defects and local bond distortion as well as intrinsic surface states and interfaces which yield localized electronic levels within
the forbidden band gap [17].
PL emission is considered a powerful tool to obtain infor-mation on the electronic structure and degree of structural
organization at medium range of the materials [46–49]. he
PL spectrum of the �,�-NiMoO4 nanostructures shows a
broad band covering a large part of the visible spectrum with a maximum situated at 480 nm (blue emission), when excited
by a 350.7 nm laser line (seeFigure 5). his PL proile suggests
an emission mechanism characterized by the participation of several energy levels or light emission centers able to trap electrons within the band gap. To a better understanding of the properties of PL and its dependence on the structural order-disorder of the lattice, the PL curves were analyzed
by the PEAKFIT program [50]. he deconvolution results
showed that the PL spectrum was better adjusted by four components (P1 – 446 nm, P2 – 493 nm, P3 – 544 nm, and P4 – 606 nm peak center), and each color represents a diferent type of electronic transition linked to a speciic structural arrangement. he emission band proile is typical of a multi-phonon process: that is, a system where relaxation occurs by several paths involving the participation of numerous states
within the band gap of the material [46–49].
In previous studies [25, 46–49] we reported that
phys-ical behavior for many molybdates compounds having the
formula AMoO4, where A = Ba, Ca, Pb, Co, and Sr, is
200nm
(a)
100nm
(b)
100nm
(c)
40
35
30
25
20
15
10
5
0
20 30 40 50 60 70 80 90
F
req
uenc
y (%)
Average particles thickness (nm)
Thickness measured
(d)
Figure 4: FE-SEM micrograph (a, b, and c) and (d) average distributions of the particle width for�and�-NiMoO4nanostructures.
P1 P1
P2
P2
P3
P3
P4
P4
480nm Peak area
400 450 500 550 600 650
Wavelength (nm)
In
ten
si
ty (a.u
.)
10%
20%
38%
32%
Figure 5: PL spectrum at room temperature and its deconvolution spectra of the�,�-NiMoO4nanorods.
levels (deep and shallow defects) within the band gap. In this case, the charge gradient between the clusters generates
a polarization in the lattice of�,�-NiMoO4 nanorods, can
lead to the formation types of distortions on [O-Ni-O] and [O-Mo-O] bonds, and consequently promotes diferent levels
of distortions on the [NiO8], [MoO4], and [MoO6] clusters.
hese studies have shown that ordered-disordered efects in nano- or microparticles have two types of coordination for Ni, Mo, or O atoms into the lattice, and this phenomenon can be related to the local structure at short, medium, and long range distances and favors the formation of complex cluster vacancies that arise from fast crystallization during the initial nucleation process. Based on these structural
and electronic order-disorder efects, for the �,�-NiMoO4
nanorods, the distortion between these complex clusters causes a polarization and/or diference in charge density in
the local structure [25,46–49], which is able to promote a
charge transfer from the[NiO8]�� e
�
�→ [NiO8]��,[MoO4]�� e
�
�→
[MoO4]��, and [MoO6]�� e
�
�→ [MoO6]�� complex clusters (�
= order and � = disorder). In particular, the
cluster-to-cluster charge transfer (CCCT) process are a natural conse-quence due to the presence of the structural defects, which essentially is characterized by excitations involving electronic
transitions from one cluster to another cluster [49] and are
strongly dependent on the formation and recombination of
0.00
0.02 0.04 0.06
0 50 100 150 200 250 300
M
agnetiza
tio
n (em
u
/g)
Temperature (K)
ZFC FC
(a)
M
agnetiza
tio
n (em
u
/g)
0 50 100 150 200 250 300
Temperature (K)
0.0
0.2 0.4 0.6
ZFC FC
H = 1000Oe
(b)
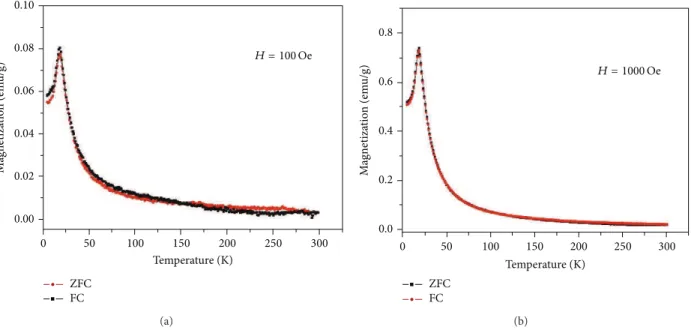
Figure 6: Temperature dependence of the ZFC and FC magnetizations for�,�-NiMoO4nanorods measured under 100 Oe (a) and 1000 Oe (b) applied ields.
considered and is also represented by Kr¨oger–Vink notation
[51] by means of clusters notations in
[NiO8]��+ [NiO8]�� �→ [NiO8]��+ [NiO8]∙� (1)
[MoO4]��+ [MoO4]�� �→ [MoO4]��+ [MoO4]∙� (2)
[MoO6]��+ [MoO6]���→ [MoO6]��+ [MoO6]∙� (3)
It is assumed that charge redistribution may lead to electron-hole recombination of localized excitons that result
in PL behavior for the �,�-NiMoO4 nanorods. herefore,
the structural and electronic reconstructions of all possible combinations of complex clusters belonging to a speciic crystal are essential for the deeper understanding of the CCCT process and its inluences on the PL phenomenon
at the atomic level [49]. In addition, in this study we also
investigated the magnetic properties for the �,�-NiMoO4
nanorods. Magnetization, as a function of temperature in a range of 2–300 K for diferent applied magnetic ields, is
shown inFigure 6.
In the “zero-ield-cooled” (ZFC) run, the sample was cooled from 300 to 2 K in the absence of an external applied magnetic ield. hen, magnetic ield was applied and the magnetization was measured as a function of the temperature in the warming process. Following the ZFC run, in the “ield-cooled” (FC) run, the sample was then cooled from 300 to 2 K in the presence of an external magnetic ield. For both ones, a reversible antiferromagnetic- (AF-) paramagnetic (PM) transition was observed, with an increasing of the magnitude of the magnetization as the magnetic ield is increased. he
�,�-NiMoO4nanorods present N`eel temperature (��) close
to 18.5 K (� = 100Oe) and 17.8 K (� = 1kOe) in accordance
with the literature [52]. Based on our results, we suggest
that the structural and electronic order-disorder efects may contribute to the improvement of PL and magnetic properties
of�,�-NiMoO4nanorods and are mainly associated with the
disorder in the medium-range distance created during the processing of these materials.
4. Conclusions
In summary, �,�-NiMoO4 nanorods were synthesized by
annealing the NiMoO4:nH2O precursor at 600∘C for 10
min-utes in a domestic microwave. he XRD patterns, FT-Raman, and FTIR spectrum revealed that the nanorods obtained
are crystalline structures formed by the�-NiMoO4 and�
-NiMoO4phases. UV-vis absorption spectroscopy revealed a
characteristic optical band gap of 2.2 eV, which is associated with the diference of energy between the valence and con-duction bands. PL emission at room temperature was veriied at 480 nm (blue emission), which can be attributed to the participation of several energy levels or light emission centers able to trap electrons within the band gap. For both applied magnetic ields a reversible antiferromagnetic-paramagnetic transition was observed.
Conflict of Interests
he authors declare that there is no conlict of interests regarding the publication of this paper.
Acknowledgments
References
[1] L. S. Cavalcante, V. M. Longo, J. C. Sczancoski et al., “Electronic structure, growth mechanism and photoluminescence of CaWO4 crystals,”CrystEngComm, vol. 14, no. 3, pp. 853–868, 2012.
[2] N. B. J. Hetherington, A. N. Kulak, Y.-Y. Kim et al., “Porous single crystals of calcite from colloidal crystal templates: ACC Is not required for nanoscale templating,”Advanced Functional Materials, vol. 21, no. 5, pp. 948–954, 2011.
[3] X. Zhang, F. Yan, C. Guo, and G. Yuan, “Preparation of barium sulfate polycrystal from barium peroxide matrix,” Materials Letters, vol. 80, pp. 117–120, 2012.
[4] Z. Ma, X. Wei, Y. Chang, S. Xing, and Y. Wu, “Facile synthesis of various manganese oxides nano/micro-crystals by a lignos-ulfanate-mediated hydrothermal process: efect of the reactant concentration and solution media,”Nano, vol. 9, no. 7, Article ID 1450077, 9 pages, 2014.
[5] Y. Li, S. Tan, J. Jiang, Z. Huang, and X. Tan, “Room-temperature synthesis, growth mechanism and properties of uniform CdMoO4nano-octahedra,” CrystEngComm, vol. 13, no. 7, pp. 2649–2655, 2011.
[6] J. A. Rodriguez, S. Chaturvedi, J. C. Hanson, and J. L. Brito, “Reaction of H2 and H2S with CoMoO4 and NiMoO4: TPR, XANES, time-resolved XRD, and molecular-orbital studies,” he Journal of Physical Chemistry B, vol. 103, no. 5, pp. 770–781, 1999.
[7] G. W. Smith and J. A. Ibers, “he crystal structure of cobalt molybdate CoMoO4,”Acta Crystallographica, vol. 19, no. 2, pp. 269–275, 1965.
[8] G. W. Smith, “he crystal structures of cobalt molybdate CoMoO4and nickel molybdate NiMoO4,”Acta Crystallograph-ica, vol. 15, pp. 1054–1057, 1962.
[9] A. W. Sleight and B. L. Chamberland, “Transition metal molyb-dates of the type AMoO4,”Inorganic Chemistry, vol. 7, no. 8, pp. 1672–1675, 1968.
[10] J. A. Rodriguez, S. Chaturvedi, J. C. Hanson, A. Albornoz, and J. L. Brito, “Electronic properties and phase transformations in CoMoO4and NiMoO4: XANES and time-resolved synchrotron XRD studies,”Journal of Physical Chemistry B, vol. 102, no. 8, pp. 1347–1355, 1998.
[11] H. Wan, J. Jiang, X. Ji et al., “Rapid microwave-assisted synthesis NiMoO4⋅H2O nanoclusters for supercapacitors,”Materials Let-ters, vol. 108, pp. 164–167, 2013.
[12] S. Chaturvedi, J. A. Rodriguez, and J. L. Brito, “Characterization of pure and sulided NiMoO4 catalysts using synchrotron-based X-ray absorption spectroscopy (XAS) and temperature-programmed reduction (TPR),”Catalysis Letters, vol. 51, no. 3-4, pp. 85–93, 1998.
[13] J. L. Brito and A. L. Barbosa, “Efect of phase composition of the oxidic precursor on the HDS activity of the sulided molybdates of Fe(II), Co(II), and Ni(II),”Journal of Catalysis, vol. 171, no. 2, pp. 467–475, 1997.
[14] C. Mazzocchia, C. Aboumrad, C. Diagne, E. Tempesti, J. M. Herrmann, and G. homas, “On the NiMoO4oxidative dehy-drogenation of propane to propene: some physical correlations with the catalytic activity,”Catalysis Letters, vol. 10, no. 3-4, pp. 181–191, 1991.
[15] B. Moreno, E. Chinarro, M. T. Colomer, and J. R. Jurado, “Com-bustion synthesis and electrical behavior of nanometric � -NiMoO4,”he Journal of Physical Chemistry C, vol. 114, no. 10, pp. 4251–4257, 2010.
[16] F. A. la Porta, J. Andr´es, M. S. Li, J. R. Sambrano, J. A. Varela, and E. Longo, “Zinc blende versus wurtzite ZnS nanoparticles: control of the phase and optical properties by tetrabutylammo-nium hydroxide,”Physical Chemistry Chemical Physics, vol. 16, no. 37, pp. 20127–20137, 2014.
[17] F. A. La Porta, M. M. Ferrer, Y. V. B. de Santana et al., “Synthesis of wurtzite ZnS nanoparticles using the microwave assisted solvothermal method,”Journal of Alloys and Compounds, vol. 556, pp. 153–159, 2013.
[18] C. Burda, X. Chen, R. Narayanan, and M. A. El-Sayed, “Chem-istry and properties of nanocrystals of diferent shapes,” Chem-ical Reviews, vol. 105, no. 4, pp. 1025–1102, 2005.
[19] H. Wan, J. Jiang, X. Ji et al., “Rapid microwave-assisted synthe-sis NiMoO4-H2O nanoclusters for supercapacitors,”Materials Letters, vol. 108, pp. 164–167, 2013.
[20] F. V. Motta, R. C. Lima, A. P. A. Marques, E. R. Leite, J. A. Varela, and E. Longo, “In2O3microcrystals obtained from rapid calcination in domestic microwave oven,”Materials Research Bulletin, vol. 45, no. 11, pp. 1703–1706, 2010.
[21] D. Keyson, D. P. Volanti, L. S. Cavalcante et al., “Domestic microwave oven adapted for fast heat treatment of Ba0.5Sr0.5(Ti0.8Sn0.2)O3 powders,”Journal of Materials Process-ing Technology, vol. 189, no. 1–3, pp. 316–319, 2007.
[22] A. Z. Sim˜oes, M. A. Ramirez, C. S. Riccardi, E. Longo, and J. A. Varela, “Efect of the microwave oven on structural, morpho-logical and electrical properties of SrBi4Ti4O15 thin ilms grown on Pt/Ti/SiO2/Si substrates by a sot chemical method,” Materials Characterization, vol. 59, no. 6, pp. 675–680, 2008. [23] H. Katsuki, N. Kamochi, and S. Komarneni, “Novel
energy-saving materials for microwave heating,”Chemistry of Materials, vol. 20, no. 15, pp. 4803–4807, 2008.
[24] J. P. Cheng, D. K. Agrawal, S. Komarneni, M. Mathis, and R. Roy, “Microwave processing of WC-Co composities and ferroic titanates,”Materials Research Innovations, vol. 1, no. 1, pp. 44–52, 1997.
[25] A. P. de Moura, R. C. Lima, E. C. Paris, M. S. Li, J. A. Varela, and E. Longo, “Formation of �-nickel hydroxide plate-like structures under mild conditions and their optical properties,” Journal of Solid State Chemistry, vol. 184, no. 10, pp. 2818–2823, 2011.
[26] A. P. de Moura, L. H. de Oliveira, E. C. Paris et al., “Photolumis-cent properties of nanorods and nanoplates Y2O3:Eu3+,”Journal of Fluorescence, vol. 21, no. 4, pp. 1431–1438, 2011.
[27] A. P. de Moura, L. H. de Oliveira, P. F. S. Pereira et al., “Photo-luminescent properties of CoMoO4nanorods quickly synthe-sized and annealed in a domestic microwave oven,”Advances in Chemical Engineering and Science, vol. 2, no. 4, pp. 465–473, 2012.
[28] G. Gasparotto, M. A. N. Bordignon, C. R. Foschini, E. C. Aguiar, M. A. Zaguete, and L. Perazolli, “SnO2 ceramics with low electrical resistivity obtained by microwave sintering,”Journal of Advanced Microscopy Research, vol. 6, no. 3, pp. 193–200, 2011. [29] E. C. Aguiar, A. Z. Sim˜oes, E. Longo, and J. A. Varela, “Inluence of microwave energy on structural and piezoelectric response of Bi4Ti3O12ceramics,”Journal of Advanced Microscopy Research, vol. 5, no. 3, pp. 209–216, 2010.
determination of LiSbWO6by X-ray powder difraction,” Mate-rials Research Bulletin, vol. 23, no. 3, pp. 447–452, 1988. [33] A. C. Larson and R. B. Von Dreele,General Structure Analysis
System (GSAS), vol. 86, Los Alamos National Laboratory Report LAUR, 1994.
[34] Y. Ding, Y. Wan, Y.-L. Min, W. Zhang, and S.-H. Yu, “General synthesis and phase control of metal molybdate hydrates MMoO4⋅nH2O (M = Co, Ni, Mn, � = 0, 3/4, 1) nano/ microcrystals by a hydrothermal approach: magnetic, photo-catalytic, and electrochemical properties,”Inorganic Chemistry, vol. 47, no. 17, pp. 7813–7823, 2008.
[35] J. Haetge, I. Djerdj, and T. Brezesinski, “Nanocrystalline NiMoO4with an ordered mesoporous morphology as potential material for rechargeable thin ilm lithium batteries,”Chemical Communications, vol. 48, no. 53, pp. 6726–6728, 2012.
[36] R. Zˇavoianu, C. R. Dias, A. P. V. Soares, and M. F. Portela, “Oxidative dehydrogenation of i-butane over nanostructured silica-supported NiMoO4 catalysts with low content of active phase,”Applied Catalysis A: General, vol. 298, no. 1-2, pp. 40–49, 2006.
[37] C. Mazzocchia, C. Aboumrad, C. Diagne, E. Tempesti, J. M. Herrmann, and G. homas, “On the NiMoO4oxidative dehy-drogenation of propane to propene: some physical correlations with the catalytic activity,”Catalysis Letters, vol. 10, no. 3-4, pp. 181–191, 1991.
[38] N. V. Y. Scarlett and I. C. Madsen, “Quantiication of phases with partial or no known crystal structures,”Powder Difraction, vol. 21, no. 4, pp. 278–284, 2006.
[39] F. Trivinho-Strixino, D. X. da Silva, C. O. Paiva-Santos, and E. C. Pereira, “Tetragonal to monoclinic phase transition observed during Zr anodisation,”Journal of Solid State Electrochemistry, vol. 17, no. 1, pp. 191–199, 2013.
[40] H. M. Abdel-Dayem, “Dynamic phenomena during reduc-tion of�-NiMoO4 in diferent atmospheres: in-situ thermo-raman spectroscopy study,”Industrial and Engineering Chem-istry Research, vol. 46, no. 8, pp. 2466–2472, 2007.
[41] J. Y. Zou and G. L. Schrader, “Deposition of multiphase molyb-date thin ilms by reactive sputtering,”hin Solid Films, vol. 324, no. 1-2, pp. 52–62, 1998.
[42] E. Roduner, “Size matters: why nanomaterials are diferent,” Chemical Society Reviews, vol. 35, no. 7, pp. 583–592, 2006. [43] A. P. Alivisatos, “Perspectives on the physical chemistry of
semiconductor nanocrystals,”he Journal of Physical Chemistry, vol. 100, no. 31, pp. 13226–13239, 1996.
[44] A. M. Smith, A. M. Mohs, and S. Nie, “Tuning the optical and electronic properties of colloidal nanocrystals by lattice strain,” Nature Nanotechnology, vol. 4, no. 1, pp. 56–63, 2009.
[45] P. K. Pandey, N. S. Bhave, and R. B. Kharat, “Preparation and characterization of spray deposited NiMoO4thin ilms for pho-tovoltaic electrochemical studies,”Materials Research Bulletin, vol. 41, no. 6, pp. 1160–1169, 2006.
[46] I. C. Nogueira, L. S. Cavalcante, P. F. S. Pereira et al., “Rietveld reinement, morphology and optical properties of (Ba1−�Sr�)MoO4 crystals,”Journal of Applied Crystallography, vol. 46, no. 5, pp. 1434–1446, 2013.
[47] J. C. Sezancoski, M. D. R. Bomio, L. S. Cavalcante et al., “Morphology and blue photoluminescence emission of PbMo04
process of CaMoO4 crystals and their optical properties,” Crystal Growth & Design, vol. 10, no. 11, pp. 4752–4768, 2010. [49] V. M. Longo, L. S. Cavalcante, E. C. Paris et al., “Hierarchical
assembly of CaMoO4nano-octahedrons and their photolumi-nescence properties,”he Journal of Physical Chemistry C, vol. 115, no. 13, pp. 5207–5219, 2011.
[50] http://www.systat.com/products/PeakFit/.
[51] F. A. Kroger and H. J. Vink, inSolid State Physics, F. Seitz and D. Turnbull, Eds., p. 307, Academic Press, New York, NY, USA, 3rd edition, 1956.
Submit your manuscripts at
http://www.hindawi.com
Scientifica
Hindawi Publishing Corporation
http://www.hindawi.com Volume 2014 Hindawi Publishing Corporation
http://www.hindawi.com Volume 2014
Hindawi Publishing Corporation
http://www.hindawi.com Volume 2014
Hindawi Publishing Corporation
http://www.hindawi.com Volume 2014
Ceramics
Journal ofHindawi Publishing Corporation
http://www.hindawi.com Volume 2014
Nanoparticles
Journal of Hindawi Publishing Corporationhttp://www.hindawi.com Volume 2014
Hindawi Publishing Corporation
http://www.hindawi.com Volume 2014
International Journal of
Biomaterials
Hindawi Publishing Corporation
http://www.hindawi.com Volume 2014
Nanoscience
Journal ofTextiles
Hindawi Publishing Corporation
http://www.hindawi.com Volume 2014
Journal of
Hindawi Publishing Corporation
http://www.hindawi.com Volume 2014
Crystallography
Journal ofHindawi Publishing Corporation
http://www.hindawi.com Volume 2014
The Scientiic
World Journal
Hindawi Publishing Corporation
http://www.hindawi.com Volume 2014
Hindawi Publishing Corporation
http://www.hindawi.com Volume 2014
Coatings
Journal ofAdvances in
Materials Science and Engineering
Hindawi Publishing Corporation
http://www.hindawi.com Volume 2014
Hindawi Publishing Corporation
http://www.hindawi.com Volume 2014
Hindawi Publishing Corporation
http://www.hindawi.com Volume 2014
Metallurgy
Journal ofHindawi Publishing Corporation
http://www.hindawi.com Volume 2014
BioMed
Research International
Materials
Journal ofHindawi Publishing Corporation
http://www.hindawi.com Volume 2014
N
a
no
ma
te
ria
ls
Hindawi Publishing Corporation
http://www.hindawi.com Volume 2014
Journal of