ISSN 0104-6632 Printed in Brazil
www.abeq.org.br/bjche
Vol. 25, No. 03, pp. 503 - 514, July - September, 2008
Brazilian Journal
of Chemical
Engineering
DEVELOPMENT OF A DARCY-FLOW MODEL
APPLIED TO SIMULATE THE DRYING OF
SHRINKING MEDIA
S. Chemkhi
1*and F. Zagrouba
21Laboratoire Energétiques et Procédés Thermiques, LEPT, Centre Recherches et Technologies
de l’Energie, Phone: 00216 97 332 997, B.P. 95, Hammam-Lif, 2005, Borj Cedria, Tunisia. E-mail: [email protected], E-mail: [email protected]
2Institut Supérieur des Sciences et des Technologies de l’Environnement,
Borj Cedria, Tunisia.
(Received: March 01, 2007 ; Accepted: March 10, 2008)
Abstract - A mathematical model is developed to describe the coupling between heat, mass, and momentum transfers and is applied to simulate the drying of saturated and shrinking media. This model is called “the Darcy-flow model”, which is based on the fact that the liquid flow is induced by a pressure gradient. The main novelties of the model are that firstly no phenomenological law need be introduced by keeping solid mass conservation and solid volume conservation together and secondly we use the effective stresses notion strongly coupling mechanical behaviour with mass transport. The analysis is limited to the preheating and the constant rate drying periods because shrinkage occurs during these two periods for most materials. Our purpose is to simulate the drying process and to compare the results of the simulations and the experiments done on clay material to demonstrate the consistency of the model developed. One of the important conclusions is that is no correlation between moisture flow and moisture gradient.
Keywords: Drying; Darcy-flow model; Shrinkage; Saturated media; Liquid pressure gradient; Effective stresses.
INTRODUCTION
The drying phenomenon is viewed as a process of simultaneous energy and mass transfer, occurring both inside and outside the material. Heat and mass transfer are coupled by the requirement that all phases remain in thermodynamic equilibrium at the local temperature (Whitaker, 1977). Thus evaporation rates are determined locally by the balance between heat flow, temperature change, and moisture flow, all subject to phase equilibrium constraints. The overall drying phenomenon results from the simultaneous interaction of all of these processes. These mechanisms of heat and mass transport are critical factors in this conceptual description of drying.
There is a large body of literature comparing predicted results of drying models that either consider or neglect shrinkage. But it is necessary to incorporate shrinkage into the drying model, especially when dealing with agricultural products (Perré and May, 2001) and building materials like wood (Perré and Passard, 2004) and ceramics (Gong and Mujumdar, 1998), where shrinkage is a key factor in the dehydration phenomena.
504 S. Chemkhiand F. Zagrouba
1997; Zagrouba et al., 2002a; Mihoubi et al., 2004; Chemkhi et al., 2004a; Chemkhi et al., 2005a). In so doing, the diffusion coefficient becomes an effective coefficient. Fick’s first law of diffusion is at times replaced by Darcy’s law in describing moisture movement in drying. Darcy’s law in its simplest form expresses the proportionality between the average velocity of a fluid flow and the flow potential, comprised of the pressure gradient existent through porous media and the gravitational contribution. Even though it is an empirical formulation, it was theoretically derived and may be used in place of the momentum balance for fluid phases. Darcy’s law is applicable to multiphase mixtures as opposed to Fick’s law, which requires the assumption of a homogeneous mixture. For that reason the former is preferable (Katekawa and Silva, 2006).
In this paper, we present a mathematical model to describe the drying of a clay material. This moisture transfer model is based on the fact that the liquid flow is induced by a pressure gradient and it is valid for saturated and shrinking media. The analysis is limited to the preheating and the constant rate drying periods because shrinkage occurs essentially during these two periods. The description takes into account the shrinkage via coupling between the mechanical behaviour of the material, which is supposedly elastic, and mass transfer through liquid pressure. Moisture and temperature profiles are presented and discussed. Stress fields developed during drying are also presented and discussed. Finally, the results of the model are discussed and criticized.
This study is part of a larger project on drying being conducted in our laboratory since 2000. Zagrouba et al. (2002b) and Mihoubi et al. (2002) presented the kinetics, the characteristic curve, and the experimental characterisation for the drying of clay. Then Zagrouba et al. (2002a), Mihoubi et al. (2004), and Chemkhi et al. (2004a; 2005a) discussed the transfer phenomena during the drying of deformable media using the diffusion model. Finally, Chemkhi et al. (2004b; 2005b) and Chemkhi and Zagrouba (2005) presented the water sorption equilibrium, the water diffusion coefficient, and some physical and chemical properties of clay material.
MATHEMATICAL MODELLING
In this paragraph, we present the mathematical modelling to describe the process of drying of saturated and shrinking media. Conservation equations are first written for each phase. The
macroscopic partial differential equations are derived by integrating over a representative volume of these microscopic conservation laws. The total momentum conservation is the sum of solid and liquid momentum conservation. Darcy’s law is established by introducing, on a phase scale, the rheological behaviour of a classic fluid for the liquid phase in the liquid momentum conservation. This law, which links the average liquid velocity to the pressure gradient, can be used to replace the liquid momentum conservation. The assumption of incompressibility of each phase gives the two supplementary equations necessary to complete the macroscopic description. So, both volume and mass conservation equations are maintained for the solid phase so that the introduction of a phenomenological law becomes unnecessary.
The continuum approach, based on the volume averaging theory developed by Whitaker (1977), couples the heat and mass transfer with the mechanical behaviour of the material and takes into account the basic transport phenomena on the pore scale, including liquid transport by capillary forces. The analysis is limited to the preheating and the constant rate drying periods: the medium is still saturated and the deformations occur essentially during the constant drying rate period for clay material (Katelaars, 1992).
The above description of moisture transfer mathematical modelling was also developed by Sfair et al. (2004), but it isn’t solved and the authors don’t validate their theoretical formulation. The novelty that we defined the momentum conservation that assures the high coupling between mass transfer and the mechanical behaviour of the material. The notion of Terzaghi’s effective constraint is introduced to respect the total momentum conservation. But the formulation of Sfair et al. (2004) does not respect the mechanical equilibrium because they deduce the constraints from the volume shrinkage.
Assumptions
To simplify the problem of heat, mass, and momentum transfer, the following assumptions are made:
The medium is assumed saturated and biphasic (solid and liquid phase only),
Mass and energy transport are considered one-directional because of the small thickness of the sample compared to the other dimensions, so all cross effects are neglected,
The evaporation of water takes place only at the surface of the material because it is still saturated during the constant rate drying period,
The liquid phase is incompressible,
Local thermodynamic equilibrium is assumed,
The initial distribution of moisture and temperature are uniform, and initially no mechanical constraints are applicable to the medium.
Phase Scale Equations
The mass, momentum, and heat transports are initially described for each phase by classical balance equations as well as the boundary conditions on the phase scale, where the subscripts “l” and “s” mean liquid and solid phases, respectively.
The mass conservation for the liquid phase is given by this equation:
(
)
l
l l
. v 0 t
∂ρ + ∇ ρ =
∂ (1)
The gravity and the convective inertial effects are both neglected. Thus, the liquid momentum conservation equation for a mono-component phase is
l
. 0
∇ σ = (2)
The energy conservation equation is written, with the assumption of no external heat sources:
(
)
(
)
l l
l l l l l
h
. v h . K T t
∂ρ + ∇ ρ = ∇ ∇
∂ (3)
At this stage, for the liquid phase we have five scalar equations, which are not enough to describe the phenomena. To close the set of equations for the liquid phase, one more equation is necessary to obtain the six scalar unknowns: density, the three components of velocity, temperature, and liquid pressure, which come from the rheological behaviour of the Newtonian liquid. The additional equation is obtained by assuming the flow of liquid phase to be incompressible:
l
.v 0
∇ = (4)
A description similar to that for the liquid phase is obtained for the solid phase:
(
)
s
s s
. v 0
t
∂ρ + ∇ ρ =
∂ (5)
s
. 0
∇ σ = (6)
(
)
(
)
s s
s s s s s
h
. v h . K T t
∂ρ + ∇ ρ = ∇ ∇
∂ (7)
It is also reasonable to assume the solid phase as incompressible:
s
.v 0
∇ = (8)
Contrary to Eq. 4, this last equation is not necessary to provide a complete modelling of the solid phase. We have five scalar equations and five unknowns: density, the three components of velocity, and temperature. Pressure does not appear in the stress-strain relation of the solid phase. Eq. 9 is an extra equation for the solid phase that will be maintained because it will be helpful for not having to use a phenomenological law later. The average of this equation will replace the arbitrary link between averaged liquid pressure and liquid volume fraction introduced in the literature.
The boundary conditions are
(
)
s vs w .nsl 0
ρ − = (9)
(
)
l vl w .nls 0
ρ − = (10)
l.nls s.nsl 0
σ + σ = (11)
(
Kl∇T .nl)
ls+(
Ks∇T .ns)
sl=0 (12)Darcy-Flow Model
506 S. Chemkhiand F. Zagrouba Local Scale Equations
The mathematical developments necessary to pass from the phase scale description to the local one are not presented here: both of the descriptions are presented in order to emphasise the physical origin of the relations used.
First, the medium is saturated: no gaseous phase will be developed and at any time the material is composed of liquid moisture and solid only.
s l 1
ε + ε = (13)
Using the classical volume averaging theory (Marle, 1967; Slattery, 1967; Whitaker, 1967), we have for the solid phase:
( )
s ss s
. v 0
t
∂ρ + ∇ ρ =
∂ (14)
sl
s s sl
A
1
. .n dA 0
V
∇ σ +
∫
σ = (15)sl
sl
s s
s s
s s s
s
s s s sl s s s
A
s s sl
A
h
.( h ) t
1
. K T T .n dA h
V 1
K T .n dA V
∂ρ +∇ ρ ν =
∂
∇ ∇ + −ρ ν +
∇
∫
∫
(16) s s csteρ = (17)
For the liquid phase, we obtain
( )
l ll l
. v 0
t
∂ρ + ∇ ρ =
∂ (18)
ls
l l ls
A
1
. .n dA 0
V
∇ σ +
∫
σ = (19)( )
ls
ls
l l l l
l l l
l
l l l ls l l l
A
l l ls
A
h
. v h t
1
. K T T .n dA h v
V 1
K T .n dA V
∂ρ + ∇ ρ =
∂
∇ ∇ + − ρ
+ ∇
∫
∫
(20) l l csteρ = (21)
For the energy conservation (Eqs. 16 and 20), the hypothesis of thermodynamic equilibrium is commonly assumed (Whitaker, 1977):
s l
T =T =T (22)
With this assumption and the boundary equation (Eq. 12), the sum of Eqs. 16 and 20 results in:
(
)
(
)
(
)
l l s s
l l s s eff
l l l s s s
h h
t
. v h v h . K T
∂ ρ + ρ +
∂
∇ ρ + ρ = ∇ ∇
(23)
The effective conductive tensor (Keff) is given by the experiment.
Reformulation of Mass Transfer Equation
By introducing the volume fraction (ε) for the two mass conservation equations, we obtain
( )
ll l l
l l
. v 0
t
∂ε ρ + ∇ ρ =
∂ (24)
Taking into account the incompressibility (Eq. 21), the following ensues:
( )
l l
. v 0 t
∂ε + ∇ =
∂ (25)
The same logic for the solid phase gives
( )
s
s
. v 0 t
∂ε
+ ∇ =
∂ (26)
The sum of Eqs. 25 and 26 is
(
s l)
(
)
s l
. v v 0 t
∂ ε + ε
+ ∇ + =
∂ (27)
Using Eq. 13, the left term of Eq. 27 is nil, which results in:
(
s l)
. v v 0∇ + = (28)
Introducing the generalised Darcy’s law for the liquid flow (Eq. 29) and neglecting the effect of gravity (Eq. 30):
(
)
l s l l
l s l l
l l
k
v =v − . ∇ − ρP g
s s l
s l s s l s l
l
k v +v = ε v + ε v − . P∇
µ (30)
So we finally obtain the first conservation equation substituting Eq. 30 into Eq. 28:
s l
s l
l
k
. v . P 0
∇ − ∇ =
µ
(31)
The second conservation equation is deduced from Eqs. 26 and 30:
s l
l
l s l
l
k
. v . P 0
t
∂ε + ∇ ε − ∇ =
∂ µ (32)
Energy Conservation
The energy balance for a general control volume assumes that heat is transferred only by the conduction process, which is logical due to the weak thickness of the sample (Couture, 1995):
(
)
TCp . K. T 0 t
∂
ρ − ∇ ∇ =
∂ (33)
with:
s s l l
Cp Cp Cp
ρ = ρ + ρ (34)
Mechanic Equilibrium, Effective Stresses
The sum of equations 2 and 6 gives the mechanical equilibrium equation:
.( ) 0
∇ σ = (35)
Using Biot’s consolidation theory (Biot, 1941) and the work of Coussy (1991), the total stress tensor is the sum of two contributions: the first contribution is the pure mechanical solid behaviour and the second is the fluid pressure contribution:
l s s l l
ε
ε
P I
σ = σ −
(36)Introducing the notion of effective stresses proposed by Terzaghi (1943), these stresses (σeff
) are defined as the sum of the total constraint (σ) and the liquid pressure (Pll):
eff l
l
P I
σ
= σ +
(37)Because of the coupling between the solid matrix and the liquid phase, this equation links mechanical behaviour with liquid pressure and we obtain a strong coupling between mechanical behaviour and mass transport.
So we obtain the momentum conservation equation assuming the elastic behaviour of the medium:
( )
(
l)
l
. .tr I 2. P I 0
∇ λ ε + µε − = (38)
The strain tensor is defined as a function of the displacements:
( ) ( ) ( ) ( )
t t1
u u u . u
2
ε = ∇ + ∇ + ∇ ∇ (39)
Boundary Conditions
Adiabatic surface (x=0): No exchange:
l l
P
0
∇ =
(40)(
− ∇K T .n 0)
= (41)u
=
0
(42) Exchange surface (x=e):
l m
l l
l l
k F
. P .n
− ∇ =
µ
ρ
(43)
(
− ∇
K. T .n
)
= −
mh
v+
h T
c(
e−
T
∞)
(44).n 0
σ = (45)
Fm is the mass flow defined as
(
)
m m g sat
F =h ρ C −C∞ (46)
m is the evaporating mass flow defined as (Kechaou and Roques, 1990)
(
)
m v
v,surf v,a a
h M
m P P
R T
= −
(47)
Km is the mass transfer coefficient calculated from
508 S. Chemkhiand F. Zagrouba
c m
air air h h
Cp
=
ρ (48)
The heat transfer coefficient hc is given by the correlation of Sieder and Tate (1936) in the case of a rectangular duct (length “L” and hydraulic diameter “dh”):
c h
0.8 1 3 h
K Nu h
d
6 d
Nu 0.023 Re Pr 1
L
=
= +
(49)
Numerical Strategies Used for Resolution of the Transport Model
To sum up, the model consists of the following averaged equations:
the mass conservation equations (Eqs. 31 and 32),
the energy conservation equation (Eq. 33),
the momentum conservation equations (Eq. 38),
and the boundary conditions (Eqs. 40-45).
Here liquid pressure is an unknown that has to be calculated as liquid volume fraction, solid velocity, and temperature. The first step in numerical resolution of this model is the simulation of one-dimensional convective drying of clay material.
The generalized system of transport equations is discretised by applying the well-known conservative finite-volume technique originally devised by Patankar (1980). During the inner iteration phase the
system is solved by employing the biconjugate gradient stabilised method (Van der Vorst, 1992). This method is a computationally efficient technique for solving the complicated set of drying equations and has been shown in previous research to offer better rates of convergence to the fixed point (Perré and Turner, 1997).
MATERIAL AND EXPERIMENTS
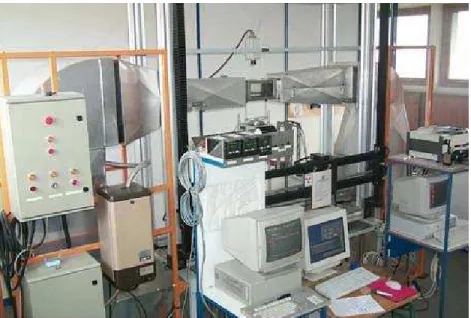
The relevance of the model was justified by experimental verification. The experiments were performed in the drying tunnel (see Figure 1) with adjustable temperature, air velocity, and air humidity. A parallelepiped sample of clay material, with approximate dimensions of 1.5x12x15 cm was placed on the sample holder and the drying air circulated over its surface. The mass evolution of the sample was controlled by a precision balance connected to a computer, allowing data acquisition. Inlet air temperature and relative humidity were measured by a thermo-hygrometer. Air velocity was measured by an anemometer. The accuracy of the measurements is as follows: 10-3 g for mass, 0.1 °C for temperature, 0.1 m/s for air velocity and 1% for humidity. The drying process was controlled by a PC with a developed acquisition program. During the experimental run the following parameters were controlled and registered: drying time, inlet air velocity, inlet air temperature, inlet air relative humidity, and sample mass.
SIMULATION AND DISCUSSION
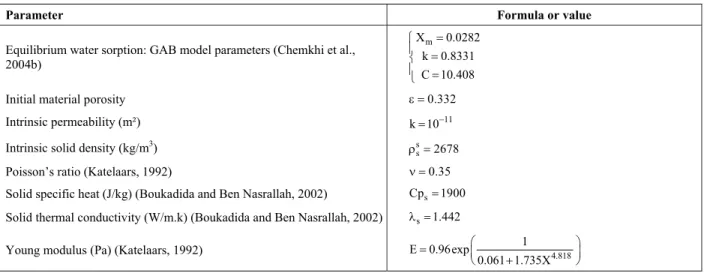
The main physical characteristics of the clay material used in the simulations are summarised in Table 1.
Simulation Results
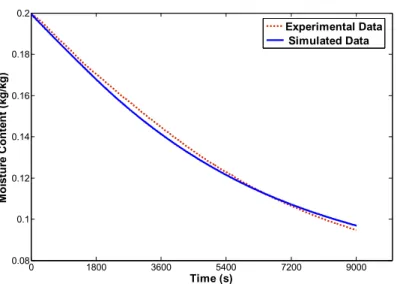
The model was validated through a comparison of predicted variable values with those obtained experimentally. In fact, Figures 2 and 3 represent respectively validation of the average moisture content and the volume shrinkage for the following drying conditions (T=40°C, RH=40% and V=2m/s). We can consider that the mathematical model was largely satisfactory for an overall experimental measurement. The deviations between experimental and simulated data are essentially due to calculation errors and to the hypothesis of a one-dimensional problem. So the computation is sufficiently accurate to provide a perspective tool to analyse the different physical phenomena governing the drying process.
In Figure 3, we remark that for moisture contents less than 0.13 (d.b), the simulated shrinkage does not agree with the measured values. In fact, during the drying of clay material, porosity can be developed when air penetrates and the medium becomes unsaturated. For the simulations, we assume that the medium is still saturated so the shrinkage is ideal. In Figure 4 the moisture distribution in the
sample as a function of effective thickness of the sample and time is presented for the drying process in air at 40°C during the two first phases.
The moisture content (W) is deduced from the liquid volume fraction as follows:
(
)
l l l
s
l s
W 1
ε ρ =
− ε ρ (50)
Every curve in the Figure refers to the moisture distribution from the bottom to the surface of the sample after the drying time indicated on the curve. The effect of shrinkage on the sample was taken into account during calculation of moisture content. A uniform moisture profile was assumed at the beginning of drying. It can be seen that the surface moisture content and the thickness of the sample during drying decrease sharply with time. The weak thickness of the sample (7.5 mm), the hypothesis of saturated medium, and the important permeability value result in quasi-flat profiles for moisture content.
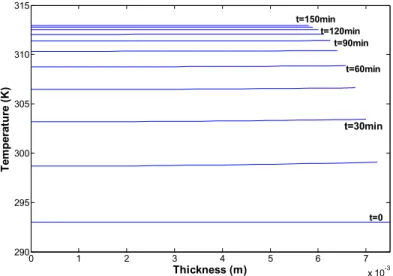
The spatiotemporal distribution of temperature is presented in Figure 5. These curves are nearly flat, which is logical considering the weak thickness of the sample. Temperature increases considerably at the beginning of drying (time<30 minutes) up to the humid temperature (Th=301 K) and then it increases slowly with time, tending towards drying air temperature.
Table 1: Physical characteristics of clay material used in the simulation
Parameter Formula or value
Equilibrium water sorption: GAB model parameters (Chemkhi et al., 2004b)
m
X 0.0282
k 0.8331
C 10.408
=
=
=
Initial material porosity ε =0.332
Intrinsic permeability (m²) k 10= −11
Intrinsic solid density (kg/m3) s
s 2678
ρ =
Poisson’s ratio (Katelaars, 1992) ν =0.35
Solid specific heat (J/kg) (Boukadida and Ben Nasrallah, 2002) Cps=1900
Solid thermal conductivity (W/m.k) (Boukadida and Ben Nasrallah, 2002) λ =s 1.442
Young modulus (Pa) (Katelaars, 1992) E 0.96exp 1 4.818
0.061 1.735X
=
+
510 S. Chemkhiand F. Zagrouba
0 1800 3600 5400 7200 9000 0.08
0.1 0.12 0.14 0.16 0.18 0.2
Time (s)
Mo
is
tu
re
C
o
n
te
n
t
(k
g
/k
g
)
Experimental Data Simulated Data
Figure 2: Comparison between the simulated average moisture contents and the experimental data (T=40°C, RH=40% and V=2m/s)
0,7 0.8 0.9 1
0 0.05 0.1 0.15 0.2
Moisture content (d.b.)
V
ol
ume s
h
ri
nkag
e
Simulated shrinkage
Measured shrinkage
Figure 3: Comparison between the simulated and the measured volume shrinkage
0 1 2 3 4 5 6 7
x 10-3 0.08
0.1 0.12 0.14 0.16 0.18 0.2 0.22
Thickness (m)
Moi
s
tur
e
Co
nt
e
n
t (
k
g/
k
g
)
t=0
t=60min
t=90min
t=120min
t=150min t=30min
0 1 2 3 4 5 6 7 x 10⁻³ 290
295 300 305 310 315
Thickness (m)
T
em
p
er
at
u
re (
K
)
t=0 t=120min
t=90min
t=30min t=60min t=150min
Figure 5: Simulated temperature profiles The liquid pressure profiles of the mechanistic
model are presented in Figure 6. We notice that they are parabolic in shape and decrease as a function of time. Liquid pressure gradients appear at the beginning of drying and they will be the driving force of the water migration. As a response to this moisture flux, the solid matrix shrinks in the opposite direction to overcome the volume of liquid evacuated.
The liquid pressure remains constant at the surface because at the liquid/gas interface, its value is equal to the difference between the gas phase pressure (atmospheric pressure) and the capillary pressure at the surface, which is assumed constant during the constant drying rate period:
l g
l g c
P =P −P (51)
If we compare Figures 4 and 6, we also observe that there is no concordance between the pressure gradients and the moisture gradients issuing from the model, so moisture gradient can not be the driving force of water migration (Sfair, 2004).
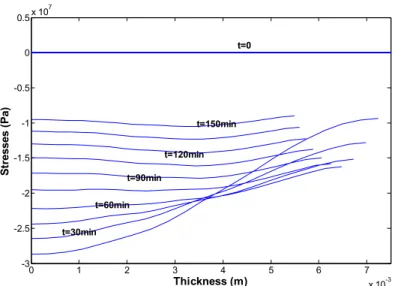
In Figure 7 profiles for normal stress during time are presented. This normal stress is the stress in the “x” direction. Since the thermal conditions of drying are moderate (low temperature, T=40 °C and moderate air velocity, V=2 m/s), the stress gradients in the sample are not important. Stresses are compression forces because the material shrinks along the drying process. These forces will return to equilibrium after the end of the drying in the decreasing drying rate period, which is not of concern in this study.
0 1 2 3 4 5 6 7
x 10-3 0.98
0.99 1 1.01 1.02 1.03 1.04 1.05
L
iq
u
id
P
ressu
re
(b
ar
)
Thickness (m)
t=1min t=30min
t=90min
t=120min
t=60min
t=150min
512 S. Chemkhiand F. Zagrouba
0 1 2 3 4 5 6 7
x 10-3 -3
-2.5 -2 -1.5 -1 -0.5 0 0.5x 10
7
Thickness (m)
St
resses (
P
a)
t=150min
t=90min t=120min
t=60min
t=30min
t=0
Figure 7: Simulated stress profiles
DISCUSSION
In the literature, we can observe that the moisture content profiles for most materials are classically parabolic (strong gradients of moisture content). In fact, the product surface exposed to air flow dries fast and quickly enters the unsaturated zone. But in the case of deformable media, evacuation of moisture is compensated by the shrinkage of the solid matrix, and the medium remains saturated despite the decrease in the quantity of moisture. Thus, the gradients of moisture content should not be strong because of the small difference in humidity from the surface to the inside of the material. For the model developed, water transport is easy because the permeability of the medium is important (k=10-11) and thus the moisture profiles are not parabolic. We have also assumed that the medium remains saturated along the constant rate drying period, so the moisture content at the surface does not decrease quickly and remains similar to that inside the medium.
Most drying modelling adopts a diffusion model, but there are many critics of this formulation (Fortes and Okos, 1980; Katekawa and Silva, 2006). Liquid diffusion may not be the only mechanism responsible for moisture migration inside a dried material. Other authors argue that a phenomenological law is without physical foundation and its use should be avoided and suggest a solid incompressibility equation to replace it (Fortes and Okos, 1980). In fact the Darcy-flow model avoids the use of a phenomenological law and its formulation has physical bases. Besides, contrary
to affirmations in the literature, there is no correlation between mass flux and moisture gradient in the medium, contrary to the diffusion model formulation.
CONCLUSIONS
Besides, contrary to affirmations in the literature, the simulation demonstrates that there is no correlation between the moisture flow and the moisture gradient in the medium.
NOMENCLATURE
Cp specific heat J/kg K dh hydraulic diameter of the
duct
M e thickness of the sample M
E Young modulus Pa
Fm mass flux kg/m2s
h enthalpy J/kg
hc convective heat transfer coefficient
W/m K hm mass transfer coefficient m/s hv vaporisation heat of the
water
J I unit tensor
k permeability m²
K thermal conductivity W/m K L length of the duct M m mass evaporation rate kg/m s Mv molar mass of the pure
water
g/mol Nu Nusselt number
P pressure Pa
Pv,a vapor pressure in the ambient medium
Pa Pv,surf vapor pressure at the
product surface
Pa R ideal gas constant J/K mol Re Reynolds number
Rv volume shrinkage Rv=V/V0
T temperature K
u displacements M
v phase velocity m/s
w solid-liquid interface displacement velocity
m/s W moisture content kg/kg Greek Letters
ε strain (-)
εi volume fraction (-)
λ, µ Lamé coefficients Pa
µl liquid dynamic viscosity Pa.s
ρ density kg/m
σ stress Pa
Subscripts
e surface (-)
l liquid (-)
s solid (-)
Averaging
i
x average (-)
i i
x intrinsic average (-)
ACKNOWLEDGMENT
The authors would like to thank Pr. Wahbi Jomaa (TREFLE Laboratory, University of Bordeaux 1, France) for his scientific and material help.
REFERENCES
Achanta S., Okos M. R., Cushman J. H. and Kessler D.P., Moisture transport in shrinking gels during saturated drying, AIChE Journal, Vol. 43, N° 8, pp. 2112-2122 (1997).
Biot M. A., General theory three dimensional consolidation, Journal of Applied Physics, Vol. 12, pp. 155-164 (1941).
Boukadida N. and Ben Nasrallah S., Effect of the variability of heat and mass transfer coefficients on convective-radiative drying of porous media, Drying Technology, Vol. 20, N° 1, pp. 67-91 (2002).
Chemkhi S. and Zagrouba F., Water diffusion coefficient in clay material from drying data, Desalination, Vol. 185, pp. 491-498 (2005).
Chemkhi S., Zagrouba F. and Bellagi A., Mathematical model for drying of highly shrinkable media, Drying Technology, Vol. 22, N° 5, pp. 1023-1039 (2004a).
Chemkhi S., Zagrouba F. and Bellagi A., Thermodynamics of water sorption in clay, Desalination, Vol. 166, pp. 393-399 (2004b). Chemkhi S., Zagrouba F. and Bellagi A., Modelling
and simulation of drying phenomena with rheological behaviour, Brazilian Journal of Chemical Engineering, Vol. 22, N° 2, pp. 153-163 (2005a).
514 S. Chemkhiand F. Zagrouba
behaviour and experiments, Industrial Ceramics, Vol. 25, N° 3, pp. 149-156 (2005b).
Coumans W. J., Power law diffusion in drying processes. Ph.D. Thesis, University of Eindhoven, Nederland (1987).
Coussy O., Mécanique des milieux poreux, Ed. Technip, Paris (1991).
Couture F., Modélisation fine d’un problème de séchage: développement d’outils adaptés, Ph.D. Thesis, University of Bordeaux 1, France (1995). Fortes M. and Okos M. R., Drying theories: Their
bases and limitations as applied to foods and grains, In Advances in Drying, Vol. 1, Mujumdar A.S. Ed., Hemisphere, Washington DC, pp. 119-154 (1980).
Gong Z. X. and Mujumdar A. S., Drying of clay and nonclay media: Heat and mass transfer and quality aspects, Drying Technology, Vol. 16, N° 6, pp. 1119-1152 (1998).
Jomaa W., Drying of highly shrinkable materials taking in account the shrinking velocity. Ph.D. Thesis, University of Bordeaux 1, France (1991). Katekawa M. E. and Silva M. A., A review of drying
models including shrinkage effects, Drying Technology, Vol. 24, N° 1, pp. 5-20 (2006). Katelaars A., Drying deformable media: Kinetics
shrinkage and stresses. Ph.D. Thesis, University of Eindhoven, Nederland (1992).
Kechaou N. and Roques M., A variable diffusivity model of drying on highly deformable materials. In Drying '89, A.S. Mujumdar and M. Roques Eds., pp. 332-338, New York, Hemisphere Publ. Co. (1990).
Marle C. M., Ecoulement monophasique en milieux poreux, Revue Institut Français du Pétrole, Vol. 22, pp. 1471-1509 (1967).
Mihoubi D., Zagrouba F., Bellagi A. and Ben Amor M., Drying of clay I: Experimental characterization, Drying Technology, Vol. 20, N° 1, pp. 80-90 (2002).
Mihoubi D., Zagrouba F., Vaxelaire J., Bellagi A. and Roques M.A., Transfer phenomena during the drying of a shrinkable product: Modeling and simulation, Drying Technology, Vol. 22, N° 1-2, pp. 91-109 (2004).
Patankar S. V., Numerical heat transfer and fluid flow, Mc Graw Hill, New York (1980).
Perré P. and May B.K., A numerical drying model
that accounts for the coupling between transfers and solid mechanics: Case of highly deformable products, Drying Technology, Vol. 19, N° 8, pp. 1629-1643 (2001).
Perré P. and Passard J., A physical and mechanical model able to predict the stress field in wood over a wide range of drying conditions, Drying Technology, Vol. 22, N° 1-2, pp. 27-44 (2004). Perré P. and Turner I. W., Microwave drying of
softwood in an oversized waveguide: Theory and experiment, AIChE Journal, Vol. 43, N° 10, pp. 2579-2595 (1997).
Sfair A. L., Modélisaton des phénomènes de transport en milieux déformables diphasiques: prise en compte de la pression liquide. Ph.D. Thesis, University of Pau, France (2004).
Sfair A. L., Couture F., Laurent S., Roques M., Modeling of heat and mass transport in two-phase media by considering liquid pressure, Drying Technology, Vol. 22, N° 1-2, pp. 81-90 (2004). Sieder G. D. and Tate C. E., Heat transfer and
pressure drop of liquids in tubes, Industrial Engineering Chemistry, Vol. 28, p. 1429 (1936). Slattery J. C., Flow of viscoelastic fluids through
porous media, AIChE Journal, Vol. 13, pp. 1066-1071 (1967).
Terzaghi K., Theoretical Soil Mechanics, John Wiley and Sons, New York (1943).
Van der Vorst H. A., Bi-CGSTAB: A fast and smoothly converging variant of Bi-CG for the solution of nonsymetric linear systems, Journal Sciences Statistics Computational, Vol. 13, p. 631 (1992). Whitaker S., Diffusion and dispersion in porous
media, AIChE Journal, Vol. 13, N° 3, pp. 420-427 (1967).
Whitaker S., Simultaneous heat mass and momentum transfer in porous media: A theory of drying, Advances in Heat and Mass Transfer, Vol. 13, pp. 110-203 (1977).
Zagrouba F., Mihoubi D. and Bellagi A., Drying of clay II. Rheological modelisation and simulation of physical phenomena, Drying Technology, Vol. 20, N° 10, pp. 1895-1917 (2002a).