ISSN 0104-6632 Printed in Brazil
www.abeq.org.br/bjche
Vol. 32, No. 02, pp. 335 - 345, April - June, 2015 dx.doi.org/10.1590/0104-6632.20150322s00003304
Brazilian Journal
of Chemical
Engineering
A MULTISTAGE GRADUAL
NITROGEN-REDUCTION STRATEGY FOR INCREASED LIPID
PRODUCTIVITY AND NITROGEN REMOVAL
IN WASTEWATER USING
Chlorella vulgaris
AND
Scenedesmus obliquus
J. C. Robles-Heredia
1, J. C. Sacramento-Rivero
1*, Y. Canedo-López
2,
A. Ruiz-Marín
2and L. E. Vilchiz-Bravo
11
Facultad de Ingeniería Química, Universidad Autónoma de Yucatán, Periférico Norte Km. 33.5, Tablaje Catastral 13615, Col. Chuburna de Hidalgo Inn, CP 97203, Merida, Yucatán, México.
E-mail: [email protected] 2
Facultad de Química, Universidad Autónoma del Carmen, C. 56 #4, Av. Concordia, Col. Benito Juárez, CP 24180, Ciudad del Carmen, Campeche, Mexico.
(Submitted: February 17, 2014 ; Revised: July 16, 2014 ; Accepted: July 22, 2014)
Abstract - Chlorella vulgaris and Scenedesmus obliquus were grown in artificial-wastewater using a new nitrogen-limitation strategy aimed at increasing lipid productivity. This strategy consisted in a multi-stage process with sequential reduction of N-NH4 concentration (from 90 to 60, 40, and 20 mg.L
–1
) to promote a balance between cell growth and lipid accumulation. Lipid productivity was compared against a reference process consisting of nitrogen reduction in two stages, where the nitrogen concentration was suddenly reduced from 90 mg.L–1 to three different concentrations (10, 20, and 30 mg.L–1). In the multi-stage mode, only C. vulgaris exhibited a net lipid-productivity increase. Lipid content of S. obliquus did not present a significant increase, thus decreasing lipid productivity. The highest lipid productivities were observed in the two-stage mode for both S. obliquus and C. vulgaris (194.9 and 133.5 mg.L–1.d–1, respectively), and these values are among the highest reported in the literature to date.
Keywords: Nitrogen limitation; Lipid productivity; Multistage; Microalgae; Biodiesel.
INTRODUCTION
Biodiesel is one of the liquid biofuels that has re-ceived most interest due to its many advantages over fossil diesel. Currently, it is commercially produced from oleaginous plants, such as soy, African palm, and rapeseed. However, two major problems for the industrial production of biodiesel are feedstock avail-ability, and land competition (direct or indirect) with food crops. As a response to these challenges, micro-algae have been explored as a promising oil supply: they have higher photosynthetic efficiencies than
ter-restrial crops, exhibit higher biomass production rates per hectare, and can be used as a tertiary wastewater treatment. Many studies have shown that some mi-croalgae species can store large amounts of triacyl-glycerides (TAGs) consisting of a mixture of satu-rated and unsatusatu-rated fatty-acid chains (C12 to C22), which makes them appropriate for biodiesel produc-tion (Borowitzka, 1991).
in-termittence, temperature, salinity, CO2 addition, agi-tation regime, and harvesting methods (Hu et al.,
2008; Chiu et al., 2009; Widjaja et al. 2009). One of the most studied factors for increasing the lipid con-tent is nutrient limitation; in particular, nitrogen and phosphorous limitation have been reported to increase lipid content and to shift the lipid composition to-wards TAGs (Widjaja et al., 2009), although little is known about the underlying mechanisms (Li et al.,
2012). The microalgae Chlorella and Scenedesmus
are often used in biodiesel-production studies, and they present the ability to grow in wastewater. Illman
et al. (2000) reported that Chlorella vulgaris accu-mulated 14-30% w/w of lipids under N-sufficient conditions. The lipid content of C. vulgaris increased from 20% to 43% of dry cell weight under nitrogen starvation conditions (Mujtaba et al., 2012). Scott et al. (2010) reported lipid contents of up to 70% for the same species, when cultivated under nitrogen defi-ciency. Furthermore, response to nutrient limitation has been shown to be species-specific (Griffiths et al., 2011).
When grown under nutrient limitation, lipid con-tent is expected to increase at the expense of cellular growth. This occurs because, under limited N con-centration, protein synthesis required for cell growth is inhibited, leaving an excess of carbon from photo-synthesis that is redirected to the metabolic paths of lipid storage and starch production (Li et al., 2012; Scott et al., 2010). Lipid productivity PL (grams of lipids per liter of culture per day) is the most impor-tant variable to maximize the biodiesel production from microalgae cultures (Khozin and Cohen, 2006; Rodolfi et al., 2009), since it represents the coupled effect of increased lipid content w (grams of lipids per grams of dry biomass) and reduced biomass concentration X (grams of dry biomass per liter of
culture) in N-limited cultures.
Because of their high lipid productivity and ade-quate fatty-acid profile, C. vulgaris and S. obliquus
have been identified as two species with great potential for biodiesel production (Griffiths et al., 2011). Several works have reported lipid productivities of these two species as high as 180 mg.L–1.d–1 and 140 mg.L–1.d–1 for C. vulgaris and S. obliquus, respectively (Table 1). These productivity values were achieved under nitro-gen-limited culture conditions (Widjaja et al., 2009; Mujtaba et al., 2012; Griffiths et al., 2011; Gouveia and Oliveira, 2009; Feng et al., 2011; Pranveenkumar
et al., 2012; Lv et al., 2010; Ho et al., 2010; Converti
et al., 2009; Ho et al., 2012).
Using a two-stage cultivation mode, Rodolfi et al.
(2009) grew Nannochloropsis sp. F&M-M24 in nitro-gen-rich medium, and then diluted with fresh, low-nitrogen medium, increasing lipid productivity to 200 mg.L–1.d–1. On the other hand, Stephenson et al.
(2012) reported that the most effective strategy to increase the productivity of TAGs in C. vulgaris was by continuing the cultivation until nitrogen depletion (in a single stage), rather than transferring the culture to fresh medium without nitrogen. Also, Mujtaba et al.
(2012) reported a constant lipid content (14-16% w/w) and lipid productivity in C. vulgaris when growing the microalgae for 5 and 7 days using two cultivation modes: a single stage, and continuous addition of nitrogen in batch reactors. These results show that reducing the N concentration in the medium will re-sult in an increase of lipid content in the microalgae, but the net lipid productivity may be the same, or even lower than in single batch culture, as a result of the reduction in the growth rate.
Furthermore, Feng et al. (2011) reported high lipid productivities in a semi-continuous culture of C. vulgaris in aerated-column reactors.
Table 1: Reported lipid productivities for C. vulgaris and S. obliquus in photoautotrophic cultures.
Species PL
(mg L–1 d–1)
Culture conditions and reference
180.0 Nitrogen limitation (Gouveia and Oliveira, 2009)
147.0 Semi-continuous cultivation in bubble column photobioreactors (Feng et al., 2011) 77.1 Nitrogen limitation (Mujtaba et al., 2012)
67.0 Nitrogen limitation (Griffiths et al., 2011)
54.0 Nitrogen starvation of Chlorella sp. BUM11008 (Praveenkumar et al., 2012). 40.0 Optimized productivity limiting nitrogen source, adding CO2 and varying the light
intensity (Lv et al., 2010)
16.9 Nitrogen starvation (Widjaja et al., 2009) C. vulgaris
20.4 Reduced nitrate culture (Converti et al., 2009)
140.4 Five-day nitrogen starvation in S. obliquus CNW-N (Ho et al., 2012) 106.0 Nitrogen limitation (Griffiths et al., 2011)
90.0 Nitrogen limitation (Gouveia and Oliveira, 2009) S. obliquus
They showed that 50% v/v dilutions with fresh me-dium every 24 h for three days, resulted in a lipid pro-ductivity of 147 mg.L–1.d–1, compared to 79 mg.L–1.d–1 obtained with daily replacement of 75% v/v with fresh medium. The lower lipid productivity in the second case was related to the reduced growth rates, since lipid content remained almost constant in both proc-esses (38–42% w/w, respectively).
Based on all this evidence, a cultivation strategy consisting of sequential stages of gradual reduction of N concentration in the medium is analyzed in this study. In the design of microalgal-oil production proc-esses it is apparent that lipid productivity is more im-portant than lipid content only. Therefore, a strategy to increase the lipid productivity in autotrophic cul-tures may require balancing lipid content and growth rate through a multistage process, involving the grad-ual reduction of N concentration in the culture me-dium. Thus, two autotrophic cultivation modes of C.
vulgaris and S. obliquus were compared: a
multi-stage process (or gradual nitrogen reduction), and the most studied two-stage process (or sudden nitrogen reduction).
MATERIALS AND METHODS Strain Selection and Culture Media
Strains of Chlorella vulgaris and Scenedesmus obliquus were obtained from the culture collection of the Centro de Investigación Científica y de Educa-ción Superior de Ensenada (CICESE), Mexico. These species were selected due to their proven ca-pacity to grow in wastewater, and having high N and P removal efficiencies (Ruiz-Marin et al. 2010). For the acclimation, both species were grown in culture media with a composition similar to that in the efflu-ent of the primary treatmefflu-ent of an urban wastewater-treatment plant (Ruiz-Marin et al. 2010), as follows: 7 mg NaCl, 4 mg CaCl2, 2 mg MgSO4·7H2O, 15 mg KH2PO4, 115.6 mg NH4Cl, all dissolved in 1 L of distilled water. Trace metals and vitamins were added according to the guidelines for medium f/2 (Guillar and Ryther 1962). During acclimation (1 month), both microalgae were transferred to fresh culture media every seven days at 28±1 °C and light intensity of 100 µE.m–2.s–1.
Two-Stage (TS) Nitrogen Reduction Cultures
The cultures were operated in 3 L cylindrical bio-reactors made of transparent polyethylene
terephtha-late (PETE) containing 2 L of operational volume of culture medium. The reactors were pre-washed with a chlorine solution to prevent bacterial contamina-tion. The treatments were run with an initial cell density of 2×10⁶ cells.mL–1 and aerated at 0.4 L.L–1.min–1, un-der a continuous illumination regime at 120 µE.m–2.s–1 (cool-white fluorescent lamps) and at a constant tem-perature of 28 ± 1 °C.
In most studies using a two-stage method for nu-trient limitation, the first stage is a nunu-trient-rich cul-ture with the purpose of achieving a high biomass concentration, while depleting the nitrogen in the medium; for this reason, the biomass is harvested at the end of the logarithmic phase of growth (centrifu-gation and precipitation being the most commonly used methods). The harvested biomass is then re-suspended in fresh medium containing a low concen-tration or absence of nitrogen (Widjaja et al., 2009; Griffiths et al., 2011; Converti et al., 2009; Li et al.,
2008). For practical purposes, especially in larger capacity reactors, it is more convenient to replace the depleted medium from the first stage with fresh me-dium containing a lower initial nitrogen-concentra-tion (Converti et al., 2009; Li et al., 2008; Zhila et al., 2005; Tan and Lin, 2011). In this study, the latter approach was taken: the microalgae were first grown in a nitrogen-rich medium (90 mg.L–1 in the first stage), using an operational volume of 1 L; at the end of the logarithmic phase of growth, 1 L of fresh me-dium was added (in order to achieve a 50% v/v dilu-tion of the biomass). The residual nitrogen from the first stage was taken into account for adjusting the nitrogen concentration in the fresh medium in order to achieve initial concentrations in the second stage of 30, 20, or 10 mg.L–1 of N-NH4. At the end of each stage, measurements were made to determine nitro-gen and biomass concentration and lipid content, as described in the following sections.
Multi-stage (MS) Nitrogen Reduction Cultures
The experimental system was the same as in the TS cultures. Initially, stock suspensions of C. vulgaris
Determination of N-NH4 Content, Cell Density,
and Cell Dry-Weight
Every 12 h, 50 mL of water sample was collected for analysis. The concentration of N–NH4 was deter-mined according to standard methods (APHA, 1995). The number of algal cells was determined using a Neubauer chamber Hemacytometer 0.1 mm in depth. For the determination of ash-free dry weight, 20 mL of culture was filtered through a GF-C glass fiber filter previously rinsed with distilled water, and in-cinerated at 470 °C for 4 h. The samples were dried at 120 °C until constant weight for 2 h in a conven-tional oven, and then in a muffle furnace at 450 °C for 3 h.
Lipid Extraction and Fatty Acid Composition Analysis
At the end of each treatment, approximately 1 L of culture was collected and then centrifuged at 4.500 rpm and 14 °C for 15 min. The recovered bio-mass was frozen at –4.0 °C for 48 h, and then lyophi-lized for 3-5 days; the dry biomass was stored under refrigeration at 0 °C. Total lipids were extracted fol-lowing the dry extraction procedure described by Feng et al. (2011), and then quantified using the method by Pande et al. (1963) using a tripalmitin standard (99%, Sigma-Aldrich).
For the analysis of the fatty acids in the micro-algal oil, approximately 10 mg of biomass was mixed with 4 mL of methanol, 2 mL of chloroform, and 0.5 mL of distilled water; the mixture was first sonicated for 15-30 min at 10 °C, and then centri-fuged at 4000 rpm for 15 min. The lipid-solvent phase was recovered by washing the upper layer with 2 mL of distilled water, centrifuging and drying with nitrogen-gas. The microalgal lipids were transesteri-fied with 2.5 mL of a HCl:CH3OH solution (5% v/v) for 2.5 h at 85 °C (Sato and Murata, 1988). The ob-tained fatty-acid methyl esters (FAMEs) were ex-tracted with 3 mL hexane, washed with distilled wa-ter and dried with nitrogen gas, obtaining samples of about 0.5 mL, which were re-suspended in 1 mL of hexane.
FAME profiles were obtained using an Agilent Technology 7890 gas chromatograph (GC). One microliter of the FAME-hexane solution was injected into the GC equipped with a flame ionization detec-tor (FID) and the separation was performed on a DB-23 column (60 m length, 0.32 mm ID, 0.25 µm thick-ness) with helium as the carrier gas. The temperature of the injector and detector was 250 °C. The
tem-perature program started at 120 °C, holding for 5 min, then increasing at 10 °C.min–1 until 180 °C, where it was held for 30 min, and then increased to 210 °C at 10 °C.min–1 (held 21 min). A calibration curve was prepared for all FAMEs by injecting known concen-trations of an external standard mixture comprising 37 FAMEs (Supelco, Bellefonte, PA, USA), obtain-ing a correlation coefficient equal to or greater than 95% in all cases.
Calculation of the Specific Growth Rate and Lipid Productivity
The rate of biomass production (or simply the
growth rate) can be expressed in terms of the
spe-cific growth rate µ so that dX dt/ = μX. Since it remains constant during the logarithmic phase:
2 1
2 1
ln(X ) ln(X )
t t
− μ =
− (1)
where t1 and t2 are cultivation times during the loga-rithmic phase. The lipid productivity is given by
( ) / L
P =d wX dt; in batch cultures the overall lipid productivity can be approximated by:
( )
L
wX P
t Δ =
Δ (2)
where Δ(wX) represents the accumulated lipids from inoculation to harvest, which occurs in the time Δt.
RESULTS AND DISCUSSIONS
In the following sections, the results of the two-stage (TS) cultivation of both strains are first de-scribed, followed by the results of the multi-stage (MS) cultivation, and finally the comparison be-tween the two modes.
Effects on the Growth Rate
0 20 40 60 80 100 120 140
ce
lls
x 1
0
6
mL
-1
0 5 10 15 20
N-NH
4
(m
g
L
-1)
0 20 40 60 80 100
C. vulgaris
N reduction
C90 C30 C20 C10
Time (h)
0 20 40 60 80 100 120 140
ce
ll
s x 10
6 mL
-1
0 5 10 15 20
N-NH
4
(m
g
L
-1)
0 20 40 60 80 100
S. obliquus
N reduction
C90 C30 C20 C10
Time (h)
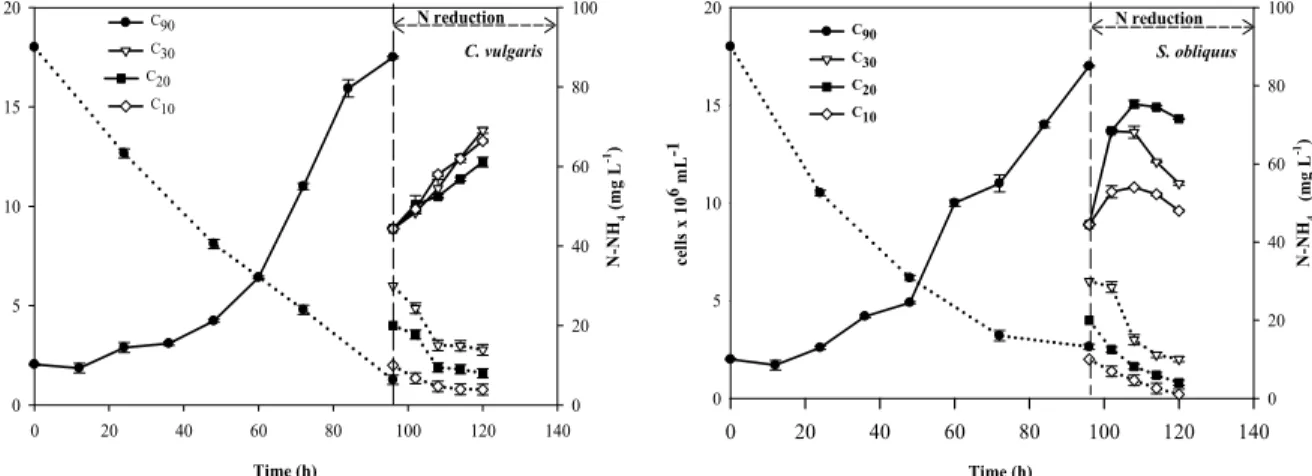
Figure 1: Growth curves (continuous lines) and nitrogen concentration curves (dotted lines) of S. obliquus and C. vulgaris grown in the TS mode.
A Tukey test showed that the three nitrogen-lim-ited treatments are significantly different (p ≥0.05) from each other, in the maximum cell density achieved and the specific growth rate (Table 2). Although it can be argued that growth limitation was not achieved in this case, the reduced specific growth-rates indi-cate that the reduction in the available nitrogen did affect the metabolic paths of the culture.
In the case of S. obliquus, the nitrogen-rich treat-ment reached a maximum cell density of 19.9×10⁶ cells.mL–1. However, after 12 h into the second stage, the culture entered the stationary phase for all reduced-nitrogen treatments (Figure 1 and Table 2); also, nitrogen uptake continued during the stationary phase, indicating that nitrogen limitation was achieved. Even when S. obliquus growth stopped after 12 h into the second stage, the specific growth rate in that period was slower in the C20 and C10 treatments than in C90. Similar results were reported in microalgae cultures, where the effect of reducing nitrogen through medium dilution caused a reduction in the maximum cell density and the specific growth, leading to accumulation of lipids (Pravenkumar et al., 2012;. Mujtaba et al., 2012; Blair et al., 2014). One reason for this behavior is that certain nutrients (including N, P and Fe ions) are essential for cellular
growth and structure synthesis; when these nutrients are present, cellular growth is preferred over lipid synthesis (Ho et al., 2010). However, nitrogen scar-city decreases the synthesis rate of cellular structures (including proteins and nucleic acids), whereas the synthesis rate of carbohydrates and lipids remains steady (Feng et al., 2011; Richardson et al., 1969).
Low concentrations of nitrogen in the medium are associated with low nitrogen-uptake rates per cell. From the data in Table 3, it can be observed that, during the reduced nitrogen stage, C. vulgaris con-sumed ca. 50% of the medium nitrogen, and S.
obliquus reached a maximum removal percentage of
up to 74.2%, suggesting that, even after a sudden reduction of the nitrogen in the medium, both mi-croalgae preserve the potential for nitrogen removal. The results of MS cultivation of C. vulgaris and
S. obliquus are shown in Figure 2. The maximum
cell densities and specific growth rates for this mode of cultivation are shown in Table 4. As expected, the specific growth-rate in both species was higher dur-ing the initial nitrogen-rich stage (C90), with values of 0.551 d–1 and 0.837 d–1 for C. vulgaris and S.
obliquus, respectively, and decreased in the
subse-quent stages (C60, C40, C20), reacting to the lower nitrogen concentrations in the medium.
Table 2: Maximum cell density and specific growth rates µ in the two-stage mode.
C. vulgaris S. obliquus
ID Initial N-NH4
concentration (mg L–1)
Max. cell density (cells×106 mL–1)
µ (d–1)
Max. cell density (cells×106 mL–1)
µ (d–1)
C90 90 17.73 ± 0.05a 0.694 ± 0.007a 19.90 ± 0.05a 0.638 ± 0.014a
C30 30 13.82 ± 0.14b 0.455 ± 0.008b 14.50 ± 0.05b 0.600† ± 0.035a
C20 20 12.22 ± 0.25c 0.321 ± 0.018c 9.17 ± 0.06c 0.247† ± 0.024b
C10 10 13.29 ± 0.07d 0.397 ± 0.008d 11.93 ± 0.22bc 0.192† ± 0.015b
Table 3: Nitrogen removal, lipid content w, and lipid productivity PL in the TS mode. Species Treatment
ID
N-NH4 removal (%)
w
(%w/w)
PL
(mg L–1 d–1)
PL increment†
(%)
C90 92.96 42.8 ± 6.1a 67.24
C30 49.96 52.0 ± 5.7b 96.17 43.0
C20 52.84 67.8 ± 1.2c 194.92 189.9
C. vulgaris
C10 53.31 23.9 ± 2.8d 3.00 –95.5
C90 85.33 37.4 ± 3.2a 79.67
C30 62.90 60.0 ± 1.4b 133.48 67.5
C20 70.24 63.4 ± 3.3b 106.92 34.2
S. obliquus
C10 74.21 24.4 ± 4.6c 6.82 –91.4
*Different letters in the same column and for each species represent significant differences according to Tukey’s test (p≥ 0.05); (± Standard deviation) † Increment with respect to C90
0 100 200 300 400
ce
lls
x
10
6 mL
-1
0 10 20 30 40
N-NH
4
(m
g
L
-1)
0 20 40 60 80 100
C. vulgaris
N reduction
C90 C60 C40 C20
Time (h)
0 50 100 150 200 250 300
ce
lls x
10
6 mL
-1
0 5 10 15 20 25 30 35 40
0 20 40 60 80 100
S. obliquus
N reduction
N-NH
4
(m
g
L
-1)
C90 C60 C40 C20
Time (h)
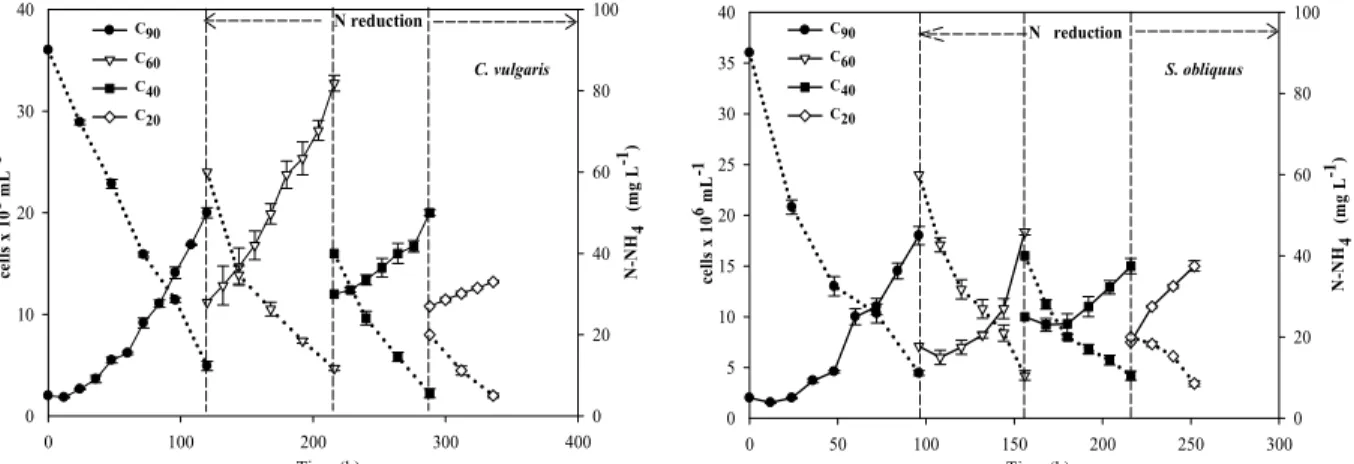
Figure 2: Growth curves (continuous lines) and nitrogen concentration curves (dotted lines) of S. obliquus
and C. vulgaris grown in the MS mode.
Table 4: Maximum cell density and specific growth rates in the MS mode.
C. vulgaris S. obliquus
Treatment ID
Initial N-NH4 concentration
(mg L–1)
Max. cell density (cells×106 mL–1)*
µ (d–1)
Max. cell density (cells×106 ml–1)*
µ (d–1)
C90 90 22.48 ± 0.53a 0.551 ± 0.010a 17.27 ± 0.75a 0.837 ± 0.027a
C60 60 32.75 ± 0.55b 0.270 ± 0.004b 18.97 ± 0.15b 0.360 ± 0.062b
C40 40 21.63 ± 0.31a 0.134 ± 0.044c 15.68 ± 1.83ab 0.377 ± 0.127b
C20 20 12.17 ± 0.15c 0.124 ± 0.013c 14.76 ± 1.65ab 0.324 ± 0.223b
*Different letters in the same column represent significant differences according to Tukey’s test (p≥ 0.05); (± Standard deviation)
The maximum cell density of C. vulgaris re-mained constant or even increased throughout the MS experiment until the last stage, where it reached a minimum value (Table 4). However, the specific growth-rate did decrease during the first three stages. A similar trend was observed for S. obliquus cul-tures, where the maximum density was achieved in the C60 treatment and the specific growth-rate de-creased after the second stage. These results show that both species showed a good adaptability to the gradual nitrogen-limitation, since growth did not stop but only slowed down.
It is also noteworthy that in TS cultivation, S.
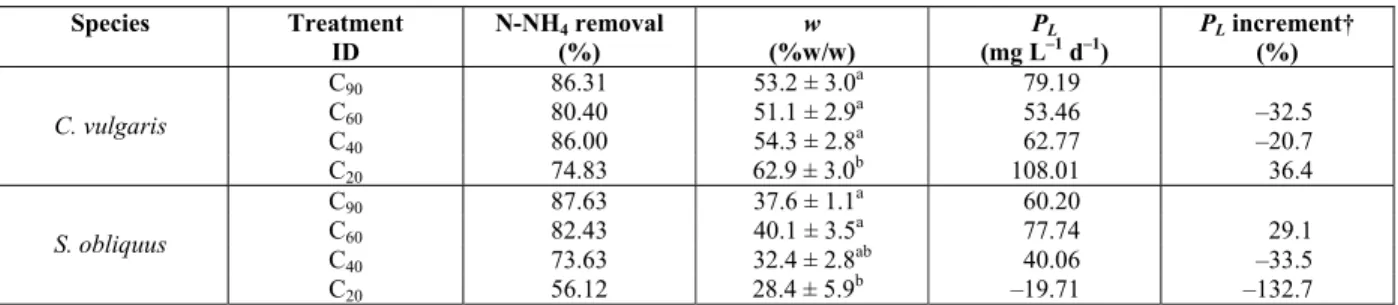
Table 5: Nitrogen removal, lipid content w, and lipid productivity PL in the MS mode. Species Treatment
ID
N-NH4 removal (%)
w
(%w/w)
PL
(mg L–1 d–1)
PL increment†
(%)
C90 86.31 53.2 ± 3.0a 79.19
C60 80.40 51.1 ± 2.9a 53.46 –32.5
C40 86.00 54.3 ± 2.8a 62.77 –20.7
C. vulgaris
C20 74.83 62.9 ± 3.0b 108.01 36.4
C90 87.63 37.6 ± 1.1a 60.20
C60 82.43 40.1 ± 3.5a 77.74 29.1
C40 73.63 32.4 ± 2.8ab 40.06 –33.5
S. obliquus
C20 56.12 28.4 ± 5.9b –19.71 –132.7
*Different letters in the same column and for each species represent significant differences according to Tukey’s test (p≥ 0.05); (± Standard deviation) †Increment with respect to C90
Similar observations were reported by Mutlu et al. (2011), suggesting that nitrogen-limitation in mi-croalgae cultures causes a decrease in cell density and chlorophyll a content, and accumulation of storage lipids. Also, Kim et al. (2007) report that Scenedes-mus sp. exhibited growth inhibition due to the reduc-tion of nitrogen and phosphorous, required by photo-synthesis.
Effects on Lipid Content and Productivity
When certain types of stress are induced in the culture, many algae alter their lipid biosynthetic pathways towards the formation and accumulation of fatty acids, which do not perform a structural role, but instead serve primarily as a storage form of car-bon and energy (Lin and Lin, 2011). It is generally accepted that stress by nitrogen-limitation inhibits cell division, without an immediate collapse of lipid production (Widjaja et al., 2009). In this work, this is well illustrated by the behavior of S. obliquus in TS cultivation, in which switching from nitrogen-rich (C90) to nitrogen-limited conditions (C30 and C20) caused an increase in lipid content from 37.4% to 60.0% and 63.4% w/w, respectively (Table 3). These values are considerably higher than the 17.7% re-ported by Gouveia and Oliveira (2009) for the same species in nutrient-sufficient cultures, and similar to those found for S. obliquus by Xin et al. (2010), of 30% and 50% in cultures with nitrogen and phospho-rous limitation, respectively.
The same trend was observed in TS cultivation of
C. vulgaris, increasing w from 42.8% to 52.0% and
67.8% when switching from C90 to C30 and C20, re-spectively. These values are considerably higher than those reported by Illman et al. (2000) for C. vulgaris
grown in nutrient-sufficient cultures, ranging from 14 to 30%, and slightly lower than those reported by Rodolfi et al. (2009) of 70% w/w under nitrogen-limitation.
In the TS treatments with the largest reduction of nitrogen (C90 to C10), the lipid content of both species notoriously decreased. In these cases, C. vulgaris
remained in the exponential phase of growth, and S.
obliquus immediately entered the stationary phase.
These results suggest that the sudden reduction to 10 mg.L–1 of N-NH4 in the second stage does not allow either species to adjust their metabolism towards lipid storage and growth, which is the result of low adaptability to large nitrogen variations. Xin et al.
(2010) reported that limiting nitrogen (2.5 mg.L–1) and phosphorous (0.1 mg.L–1) for Scenedesmus sp. LX1 caused a considerable increase of the lipid con-tent (30 and 53%, respectively), but the net lipid-productivity is abated by a dominating decrease of the growth rate. Similar conclusions were drawn from the Report of Sheehan et al. (1998). However, in their extensive review, Williams and Laurens (2010) identified several works where nitrogen and phosphorous limitation resulted in a net increase of lipid productivity, despite the reduction in growth rates. The results from this work (Table 3) also sup-port this observation: lipid productivities PL in both species increased when switching from C90 to C30 and C20, where C. vulgaris achieved the highest pro-ductivity in the C20 batch (194.9 mg.L–1.d–1), and S.
obliquus in the C30 batch (133.5 mg.L–1.d–1). The
increase in productivity is associated with lipid con-tent increasing and the growth rate decreasing only moderately. The observed maximum values of PL are higher than most reported in the literature for photo-autotrophic cultures (Table 1), and the trend of in-creasing PL as the culture undergoes nitrogen-limita-tion confirms the trends observed by several previ-ous investigations (Widjaja et al., 2009; Griffiths et al., 2011; Gouveia and Oliveira, 2009; Ho et al.,
2010).
the effect on lipid content and productivities was different for C. vulgaris and S. obliquus, supporting the assertion of Griffiths et al. (2011) that the re-sponse to nitrogen-limitation is species-specific.
For C. vulgaris, the second and third stages (C60 and C40) did not change the lipid content signifi-cantly, and the lipid productivity was reduced from 79.2 to 53.46 mg.L–1.d–1 due to the lower growth rate. However, in the fourth stage (C20), both lipid content and productivity increased, achieving a maximum value of 108 mg.L–1.d–1, a 36.4% increase relative to the lipid productivity in the first stage. This result is in line with the observations of Widjaja
et al. (2009), where C. vulgaris presented a decrease in lipid productivity after seven days under nitrogen-starvation, but extending the culture for 17 days re-sulted in a higher lipid productivity. This suggests that C. vulgaris needs more than five days of grow-ing under nitrogen-limited conditions to redirect its metabolism towards a significant increase in lipid productivity.
S. obliquus behaved differently in MS cultivation. While in the second and third stages the lipid content did not change significantly, the lipid productivity increased slightly from 60.2 to 77.7 mg.L–1.d–1 (Ta-ble 5), due to the larger biomass concentration at the end of the second stage. From there, subsequent stages caused a decrease in both lipid content and productivity. From the growth curves of S. obliquus
under MS cultivation (Figure 2) and the correspond-ing values of the specific growth rate in Table 4, it is evident that the culture was not greatly affected by
the changes of the nitrogen concentration in the cul-tures, with the exception of the second stage (C60). Thus, S. obliquus was able to maintain a steady growth in the exponential phase through the sequen-tial stages, but lipid accumulation by nitrogen-limita-tion was not observed for this species in the MS mode. This suggests that, under a gradual reduction of nitrogen, S. obliquus can use the available nitro-gen preferably for cell maintenance, influencing nega-tively in the lipid accumulation and productivity.
FAMEs Profiles of Microalgal Lipids
When the purpose of lipid production in micro-algae cultures is the production of biodiesel, it is important to characterize the TAG fraction for the quality of the resulting biodiesel. Both cultivation time and nitrogen limitation affect microalgal lipids, not only increasing the lipid content, but also chang-ing their composition (Widjaja et al., 2009). Thomas
et al. (1984) analyzed the fatty acid composition of
the lipids from seven species of fresh-water micro-algae, and observed that all accumulated C14:0, C16:0, C18:0, C18:2, and C18:3, that is, a majority of saturated fatty acids (SFA) and polyunsaturated fatty acids (PUFA). Hence, for the purpose of biodiesel produc-tion it is important to evaluate the changes in the fatty acid profile that may arise from the variations in the cultivation methods.
Tables 6a and 6b summarize the FAMEs profile found in C. vulgaris and S. obliquus, respectively, under the two cultivation modes studied in this work.
Table 6a: Profile of the fatty acids of C. vulgaris lipids (expressed as % of total fatty acids*).
TS† MS
FAMES C90 C30 C20 C90 C60 C40 C20
C4:0 12.53(0.38) 15.04(1.33) 11.80 (0.59) 9.11 (0.30) 11.24 (0.64) 12.05 (3.25) 13.12 (0.94) C14:0 10.27 (0.31) 11.36 (0.28) 10.84 (0.34) 8.45 (1.22) 5.47 (0.01) 6.10 (0.27) 6.18 (0.1)
C15:1 n.d. n.d. n.d. 8.88 (0.11) 8.03 (0.11) 6.24 (0.06) 6.87 (0.17)
C16:0 7.03 (0.11) n.d. 7.05 (0.32) 5.12 (0.07) 4.77 (1.09) 3.93 (0.00) 4.15 (0.06)
C16:1 9.75 (0.42) 11.36 (0.28) 9.60 (0.27) 7.07 (0.29) 5.86 (0.13) 6.40 (0.11) 6.26 (0.00)
C17:0 n.d. n.d. n.d. 9.13 (0.30) 7.86 (0.04) 6.48 (0.01) 6.97 (0.19)
C18:1n9t n.d. n.d. n.d. 3.99 (0.00) 3.60 (0.04) 6.65 (0.87) 4.93 (0.41)
C20:0 9.48 (0.04) 12.32 (0.17) 10.65 (0.07) 6.85 (0.02) 7.18 (0.22) 8.30 (0.38) 8.33 (0.04)
C18:3n6 n.d. n.d. n.d. n.d. 5.48 (0.09) 4.75 (0.15) 4.52 (0.07)
C20:1 20.79 (0.12) 20.75 (0.12) 20.23 (0.15) 15.08 (0.10) 15.29 (0.46) 14.48 (0.58) 13.73 (0.05)
C21:0 7.17 (0.17) 7.04 (1.26) 7.31 (0.46) 5.20 (0.12) 5.23 (0.18) 4.78 (0.03) 4.87 (0.20)
C22:0 22.97 (0.56) 22.12 (0.58) 22.52 (1.10) 15.64 (0.42) 14.46 (0.36) 15.33 (0.86) 15.20 (0.37)
C22:1n9 n.d. n.d. n.d. 5.48 (0.28) 5.52 (0.10) 4.51 (0.03) 4.87 (0.24)
SFA 69.46(0.31)a 67.90(0.40)a 70.16(0.13)b 59.50(0.02)a 56.22(0.94)a 56.98(1.69)a 58.82(0.01)a
MUFA 30.54(0.34)a 32.11(0.40)a 29.83(0.12)b 49.50(0.02)a 38.30(0.85)a 38.27(1.54)a 36.66(0.05)a
PUFA n.d. n.d. n.d. n.d. 5.41(0.09)a 4.75(0.15)a 4.56(0.07)a
SFA:MUFA 2.27 a 2.11 a 2.35 b 1.47 a 1.47 a 1.49 a 1.60 a
*
Weight percentages, standard deviation between brackets
† Lipid samples in the C10 treatment were smaller than the detection limits.
Table 6b: Profile of the FAMEs of S. obliquus lipids (expressed as % of total fatty acids*).
TS† MS
FAMES C90 C30 C20 C90 C60 C40 C20
C4:0 12.28 (1.67) 23.85 (1.51) 18.43 (1.55) 11.55 (0.30) 15.50 (0.35) 26.13 (0.54) 21.81 (3.6) C14:0 11.43 (0.16) 14.74 (1.54) 15.39 (1.62) 9.75 (0.04) 7.72 (0.07) 7.33 (0.06) 7.98 (0.62) C16:1 10.69 (0.16) 8.54 (0.5) 10.53 (0.26) 9.12 (0.00) 7.61 (0.20) 7.06 (0.01) 6.91 (0.66)
C18:1n9t n.d. n.d. n.d. 4.13 (0.04) 5.10 (0.68) 1.64 (1.08) 5.50 (3.51)
C20:0 14.20 (0.21) 9.19 (0.44) 11.38 (0.31) 12.11 (0.36) 9.59 (0.10) 8.54 (0.04) 8.14 (0.18) C20:1 20.93 (0.28) 17.71 (2.52) 19.19 (0.90) 17.88 (0.08) 20.73 (0.78) 18.51 (0.07) 17.96 (0.06)
C21:0 n.d. n.d. n.d. 7.72 (0.56) 7.39 (0.14) 7.35 (0.01) 6.98 (0.14)
C22:0 20.96 (0.42) 14.09 (0.98) 14.68 (0.42) 17.90 (0.64) 17.32 (0.88) 15.03 (0.05) 16.53 (0.97) C22:1n9 9.52 (1.64) 11.88 (2.50) 10.40 (1.83) 9.83 (0.90) 9.03 (0.31) 8.42 (0.43) 8.19 (0.47) SFA 58.87 (1.19)a 61.87 (0.51)ab 59.88 (0.67)b 59.03(0.78)a 57.52(0.41)a 64.37(0.59)b 61.44 (2.32)ab MUFA 41.13 (1.20)a 38.13 (0.50)b 40.12 (0.66)ab 40.96(0.80)a 42.48(0.42)a 35.62(0.60)b 39.01(2.30)ab
SFA:MUFA 1.43a 1.62b 1.49a 1.44a 1.35a 1.80b 1.60ab
* Weight percentages, standard deviation between brackets
† Lipid samples in the C10 treatment were smaller than the detection limits.
Different letters in the same row represent significant differences according to Tukey’s test (p≥ 0.05); (± Standard deviation) n.d. = not detected.
It can be observed that the lipids content of C.
vulgaris is mainly SFA and monounsaturated
fatty-acids (MUFA). The profiles show that the ratio of SFAs to MUFAs did not change significantly after reducing nitrogen in the medium, with the exception of the C20 treatment, where the production of SFA was slightly favored. Unfortunately, the C10 treat-ments did not yield enough lipids for the GC meas-urements. On the other hand, cultures of C. vulgaris
in the MS mode did not exhibit significant changes in the lipid composition throughout the sequential stages, and the overall ratio SFA:MUFA remained constant throughout the sequential batches.
The cultivation mode did affect the FAMEs pro-file. In the MS mode, the PUFA C18:3 was detected for C. vulgaris, and the relative compositions of most FAMEs in both species were different than in the TS mode, reaffirming the conclusion by Damiani et al. (2010) that the growth conditions affect the FAMEs profile. Similar results were reported by Makulla (2000) for the microalga S. obliquus, noting that an increase in the dilution rate caused the SFA fraction to increase from 44.97% in a culture with no dilution to 50.73% when cultivated with a dilution rate of 0.48 d–1. In addition, studies by Lin and Lin (2011) showed that the C18:3 fraction decreased dramatically during the nitrogen starvation phase. Finally, John-son and Wen (2009) found that the C16 and C18 series of Chlorella sp. changed significantly during 5 days of culture.
It is also important to note that the main compo-nents of the lipid profiles were long-chain fatty acids (C22:0 and C20:1), and a large proportion of C4:0. This would mean a large cetane number for the resulting biodiesel, although it may result in poor cold-flow properties. Also, the low level of MUFAs and PUFAs
suggest that the resulting biodiesel would have good oxidative stability.
In S. obliquus lipids, only SFA and MUFA were
identified. The main compounds in S. obliquus lipids were long-chain fatty acids (C22:0 and C20:1). Al-though C4:0 concentrations were high (>13% in all treatments), the overall composition was more bal-anced than in C. vulgaris lipids. In the TS mode, the sudden nitrogen limitation had the effect of increas-ing the composition of lower-sized carbon chains (C4:0, C14:0), increasing the fraction of SFA, and de-creasing the MUFAs content, so that the ratio of SFA:MUFA varied from 1.4-1.6 (in C90) to 2.1-2.3 in C30 and C20, respectively. On the other hand, the MS mode did not seem to affect noticeably the fraction of SFA or MUFA, and the ratio SFA:MUFA re-mained in the range of 1.3 to 1.8.
Similarly to C. vulgaris, the composition of S.
obliquus lipids can lead to good biodiesel quality
given a small percentage of MUFAs, virtually no presence of PUFAs, and long-chain fatty acids as main components. Although the latter factor may result in high viscosity, the resulting biodiesel may still be appropriate for concentrated fuel blends.
CONCLUSIONS
S. obliquus were not able to sustain growth in the TS mode, increasing their lipid content; however, in the MS mode the microalgae adapted well to the reduced nitrogen concentrations and the lipid-accumulation effect was not observed. Both species presented a good potential for nitrogen removal from the artifi-cial wastewater medium, and in general, the removal efficiencies were larger in MS cultivation. The fatty-acid profiles of the lipids from both species showed good potential for biodiesel production in terms of their content of saturated, monounsaturated, and polyunsaturated fatty-acids.
ACKNOWLEDGEMENTS
This research was supported by the Mexican Council of Science and Technology (CONACyT) pro-ject 145521, and the Secretariat of Public Education of Mexico (SEP) project PROMEP 103.5/09/7341.
REFERENCES
APHA, American Public Health Association. Stan-dard Methods for the Examination of Water and Wastewater, 19th Ed., Washington, DC (1995). Blair, M. F., Bahareh, K., Gude, V. G., Light and
growth medium effect on Chlorella vulgaris bio-mass production. Journal of Environmental Chemi-cal Engineering, 2, 665-674 (2014).
Borowitzka, L. J., Development of western biotech-nology's algal β-carotene plant. Bioresource Tech-nology, 38, 251-252 (1991).
Chiu, S., Kao, C., Tsai, M., Ong, S., Chen, C., Lin, C., Lipid accumulation and CO2 utilization of
Nan-nochloropsis oculata in response to CO2 aeration.
Bioresource Technology, 100, 833-838 (2009). Converti, A., Casazza, A. A., Ortiz, E. Y., Perego, P.,
Del Borghi, M., Effect of temperature and nitro-gen concentration on the growth and lipid content
of Nannochloropsis oculata and Chlorella
vul-garis for biodiesel production. Chemical
Engi-neering and Processing: Process Intensification, 48, 1146-1151 (2009).
Damiani, M. C., Popovich, C. A., Constenla, D., Leonardi, P. I., Lipid analysis in Haematococcus pluvialis to assess its potential use as a biodiesel feedstock. Bioresource Technology, 101, 3801-3807 (2010).
Feng, Y., Li, C., Zhang, D., Lipid production of
Chlorella vulgaris cultured in artificial wastewater medium. Bioresource Technology, 102, 101-105 (2011).
Gouveia, L., Oliveira, A. C., Microalgae as a raw material for biofuels production. Journal of Indus-trial Microbiology & Biotechnology, 36, 269-74 (2009).
Griffiths, M. J., Hille, R. P., Harrison, S. T. L., Lipid productivity, settling potential and fatty acid pro-file of 11 microalgal species grown under nitro-gen replete and limited conditions. Journal of Ap-plied Phycology (2011).
Guillard, R. L. L., Ryther, J. H., Studies on marine planktonic diatoms Cycloterlla nana Hustedt and
Detonula confervacea (Cleve). Gran Canaria
Journal of Microbiology,8, 229-239 (1962). Ho, S., Chen, C., Chang, J., Effect of light intensity
and nitrogen starvation on CO2 fixation and lipid/ carbohydrate production of an indigenous micro-alga Scenedesmus obliquus CNW-N. Bioresource Technology, 113, 244-252 (2012).
Ho, S., Chen, W., Chang, J., Scenedesmus obliquus
CNW-N as a potential candidate for CO2 mitiga-tion and biodiesel producmitiga-tion. Bioresource Tech-nology, 101, 8725-8730 (2010).
Hu, Q., Sommerfeld, M., Jarvis, E., Ghirardi, M., Posewitz, M., Seibert, M., Darzins, A., Micro-algal triacylglycerols as feedstocks for biofuel production: perspectives and advances. The Plant Journal, 54, 621-639 (2008).
Illman, A. M., Scragg, A. H., Shales S. W., Increase
in Chlorella strains calorific values when grown
in low nitrogen medium. Enzyme Microbiologi-cal Technology,27, 631-635 (2000).
Johnson, M. B., Wen, Z. Y., Development of an at-tached microalgal growth system for biodiesel production. Appl. Microbiol. Biotechnol, 85(3), 525-534 (2009).
Kim, M. K., Park, J. W., Park, C. S., Kim, S. J., Jeune, K. H., Chang, M. U., Acreman, J., En-hanced production of Scenedesmus sp. (green mi-croalgae) using a new medium containing fer-mented swine wastewater. Bioresource Technology, 98, 2220-2228 (2007).
Khozin, G. I., Cohen, Z., The effect of phosphate starvation on the lipid and fatty acid composition of the fresh water eustigmatophyte Monodus
sub-terraneus. Phytochemistry,67, 696-701 (2006).
Li, Y., Fei, X., Deng, X., Novel molecular insights into nitrogen starvation-induced triacylglycerols accumulation revealed by differential gene ex-pression analysis in green algae Micractinium
pu-sillum. Biomass Bioenergy, 42, 199-211 (2012).
Li, Y., Horsman, M., Wang, B., Wu, N., Lan, C. Q., Effects of nitrogen sources on cell growth and lipid accumulation of green algae Neochloris
Biotech-nology, 81(4), 629-636 (2008).
Lin, Q., Lin, J., Effects of nitrogen source and con-centration on biomass and oil production of a
Scenedesmus rubescens like microalga.
Biore-source Technology, 102, 1615-1621 (2011). Lv, J., Cheng, L., Xu, X., Zhang, L., Chen, H.,
En-hanced lipid production of Chlorella vulgaris by adjustment of cultivation conditions. Bioresource Technology, 101, 6797-6804 (2010).
Makulla, A., Fatty acid composition of scenedesmus obliquus: Correlation to dilution rates. Limnologica, 30,162-168 (2000).
Mujtaba, G., Choi, W., Lee, C., Lee, K., Lipid pro-duction by Chlorella vulgaris after a shift from nutrient-rich to nitrogen starvation conditions. Bioresource Technology, 123, 279-283 (2012). Mutlu, Y., Işık, O., Uslu, L., Koç, K., Durmaz, Y.,
The effects of nitrogen and phosphorus deficien-cies and nitrite addition on the lipid content of
Chlorellavulgaris (Chlorophyceae). African
Jour-nal of Biotechnology, 10(3), 453-456 (2011). Pande, S. V., Khan, R. P., Venkitasubramanian, T. A.,
Microdetermination of lipids and serum total fatty acids. Analytical Biochemistry,6, 415-423 (1963). Praveenkumar, Shameera, R., K., Mahalakshmi, G.,
Akbarsha, M. A., Thajuddin, N., Influence of nu-trient deprivations on lipid accumulation in a dominant indigenous microalga Chlorella sp., BUM11008: Evaluation for biodiesel production. Biomass Bioenergy, 37, 60-66 (2012).
Richardson, B., Orcutt, D. M., Schwertner, H. A., Martinez-Cara, L., Wickline-Hazel, E., Effects of nitrogen limitation on the growth and composi-tion of unicellular algae in continuous culture. Applied Microbiology, 18, 245-250 (1969). Rodolfi, L., Chini Zittelli, G., Bassi, N., Padovani,
G., Biondi, N., Bonini, G., Tredici, M. R., Micro-algae for oil: Strain selection, induction of lipid synthesis and outdoor mass cultivation in a low-cost photobioreactor. Biotechnology and Bioen-gineering, 102, 100-112 (2009).
Ruiz-Marin, A., Mendoza-Espinosa, L. G., Stephenson, T., Growth and nutrient removal in free and im-mobilized green algae in batch and
semi-continu-ous cultures treating real wastewater. Bioresource Technology, 101, 58-64 (2010).
Sato, N., Murata, N., Membrane Lipids. In: Sidney P. Colowick, Nathan O. Kaplan, Editors. Methods in Enzymology, Academic Press, 167, 251-259 (1988).
Scott, S. A., Davey, M. P., Dennis, J. S., Horst, I., Howe, C. J., Lea-Smith, D. J., Smith, A. G., Bio-diesel from algae: Challenges and prospects. Cur-rent Opinion in Biotechnology, 21, 277-286 (2010). Sheehan, J., Dunahay, T., Benemann, J., Roessler,
P., A Look Back at the U.S. Department of En-ergy’s Aquatic Species Program-Biodiesel from Algae. NREL/TP-580-24190 (1998).
Stephenson, A. L., Dennis, J. S. Howe, C. J., Scott, S. A., Smith, A. G., Influence of nitrogen-limita-tion regime on the producnitrogen-limita-tion by Chlorella vul-garis of lipids for biodiesel feedstocks. Biofuels, 1, 47-58 (2012).
Tan, Y., Lin, J., Biomass production and fatty acid profile of Scenedesmus rubescens-like microalga. Bioresource Technology, 102, 10131-10135 (2011). Thomas, W. H., Tornabene, T. G., Weissman, J.,
Screening for lipid yielding microalgae: Activi-ties for 1983. SERI/STR-231-2207 (1984). Widjaja, A., Chien, C., Ju, Y., Study of increasing lipid
production from fresh water microalgae Chlorella vulgaris. Journal of the Taiwan Institute of Chemi-cal Engineer,40, 13-20 (2009).
Williams, P. J., Laurens, L. M. L., Microalgae as biodiesel & biomass feedstocks: Review & analysis of the biochemistry, energetics & economics. En-ergy Environmental Sciences, 3, 554-590 (2010). Xin, L., Hong-Ying, H., Ke, G., Ying-Xue, S., Ef-fects of different nitrogen and phosphorus con-centrations on the growth, nutrient uptake, and lipid accumulation of a freshwater microalga
Scenedesmus sp. Bioresource Technology, 101,
5494-5500 (2010).
Zhila, N. O., Kalacheva, G. S., Volova, T. G., Effect of nitrogen limitation on the growth and lipid composition of the green alga Botryococcus
braunii Kiitz IPPAS H-252. Russian Journal of