ISSN 0104-6632 Printed in Brazil
www.abeq.org.br/bjche
Vol. 32, No. 02, pp. 397 - 408, April - June, 2015 dx.doi.org/10.1590/0104-6632.20150322s00003342
*To whom correspondence should be addressed
Brazilian Journal
of Chemical
Engineering
BIOHYDROGEN FROM CHEESE WHEY
TREATMENT IN AN AnSBBR: ACHIEVING
PROCESS STABILITY
D. M. F. Lima
1, R. K. Inoue
1, J. A. D. Rodrigues
2*, S. M. Ratusznei
2and M. Zaiat
11Escola de Engenharia de São Carlos, Universidade de São Paulo (USP),
Av. Trabalhador São-Carlense 400, CEP: 13.566-590, São Carlos - SP, Brasil.
2
Escola de Engenharia Mauá, Instituto Mauá de Tecnologia, (IMT), Praça Mauá 1, CEP: 09580-900, São Caetano do Sul - SP, Brasil.
E-mail: [email protected]
(Submitted: March 7, 2014 ; Revised: June 28, 2014 ; Accepted: August 6, 2014)
Abstract - An AnSBBR (anaerobic sequencing batch reactor containing biomass immobilized on an inert support) with liquid phase recirculation, containing a 3.5 L working volume, treated 1.5 L of cheese whey wastewater in 3 and 4 h cycles at 30 °C to produce biohydrogen. From startup the bioreactor presented process instability. To overcome this problem the following measures were taken, however without success: adaptation of the biomass with uncontaminated easily degradable substrates, pH control at very low levels, and a different form of inoculation (natural fermentation of the feed medium). The problem was solved by cooling the feed medium to 4 °C to prevent acidification in the storage container, by eliminating nutrient supplementation to prevent possible formation of H2S by sulfate-reducing bacteria and by periodic washing
of the support material to improve the food/microorganism ratio. Hence, stable hydrogen production could be achieved with minimal presence of methane (36% H2; 62% CO2; 2% CH4) and the AnSBBR fed with
cheese whey (influent concentration of 4070 mgCOD.L-1 and 3240 mgCarbohydrate.L-1 and applied volumetric organic loading of 14.6 gCOD.L-1.d-1) presented improved productivity and yield indicators compared to pure lactose and other reactor configurations, reaching values of 420 NmLH2.L
-1
.d-1 and 0.60 molH2.molCarbohydrate
-1
in the steady-state phase (conversions of carbohydrates and COD were 98% and 30%, respectively).
Keywords:Biohydrogen; Cheese whey; AnSBBR; Process stability; Selective pressure.
INTRODUCTION
Fossil fuels are non-renewable sources of energy and are becoming increasingly scarce. In addition, the combustion products contribute to increasing global warming. Therefore, researchers have been looking for alternative sources of energy to replace fossil fuels, including thermonuclear, solar, wind, and geo-thermal energy. However, hydrogen remains one of the best options due to its unique characteristics compared to other fuels (Veziroglu & Sahin, 2008). Hydrogen is considered to be a clean fuel because
when combusted only water is released as the end product. In addition, in comparison with hydrocar-bons, 2.75 times more energy can be released (Sinha & Pandey, 2011).
Brazilian Journal of Chemical Engineering
hydrogenase activity and low costs (Ntaikou et al., 2008).
The use of whey as the source for biohydrogen production was primarily motivated by the large production figures; according to the ADPI (American Dairy Products Institute), the global production of liquid whey from cheese and casein amounted to 186 million metric tons (MT) in 2008. Moreover, even with the technological possibility of using this com-pound as a byproduct, this may not be economically feasible, especially for small and medium producers, resulting in the disposal of this product; disposal can be a serious problem due to whey´s high biodegrad-ability (Mawson, 1994; Calli & Yukselen, 2004).
Several factors can cause instability in hydrogen production. According to Speece (1996), anaerobic digestion is a complex process involving several types of microorganisms and intermediate phases. The complex organic components (i.e., polymers) present in the substrate are hydrolyzed into simpler compounds (monomers). These are metabolized by fermentative bacteria and converted into volatile fatty acids, alcohols, carbon dioxide and hydrogen. The volatile fatty acids with more than two carbons are converted to acetate and hydrogen gas by aceto-genic bacteria. Finally, acetate and hydrogen gas are converted into methane by the acetoclastic or hydro-genotrophic methanogenic archaea, respectively. When nitrate and sulfate are present in the environ-ment, sulfate-reducing and nitrate-reducing bacteria are able to use the hydrogen produced as an electron donor to form sulfide and ammonia, respectively (Valdez-Vazquez et al., 2005). Another possibility is the development of microorganisms that produce propionic acid instead of acetic or butyric acid. Vavilin et al. (1995) presented a general equation for the propionate production from hexose, showing that this route involves the consumption of hydrogen (Equation (1)):
6 12 6 2 3 2 2
C H O +2 H →2 CH CH COOH+2 H O (1)
Lastly, homoacetogenic microorganisms, which are capable of using the Wood-Ljungdahl pathway, may develop (Tanner et al., 1993). Among these
Clostridium ljungdahlii (Tanner et al., 1993; Köpke
et al., 2010) and Clostridium carboxidivorans (Liou
et al., 2005) should be mentioned, which are capable of growing heterotrophically in sugars (hexoses and pentoses) or autotrophically (Wood-Ljungdahl path-way) in gases (CO or CO2 + H2). As previously men-tioned, hydrogen is an intermediate product in several biological processes and may be consumed in
the liquid medium, thus requiring inhibition of this consumption.
Anaerobic sequencing batch processes appear to be suitable treatment solution in specific cases, such as the treatment of intermittently generated industrial effluents containing poorly degradable compounds or in the case of very restrictive discharge standards. In these cases, the desired removal can be guaranteed by adjusting the operating parameters of the reactor (Zaiat et al., 2001). There are also other advantages regarding the simple configuration of the reactor, such as improved effluent quality control, the non-existence of hydraulic short circuit, no need for sta-bilization of the process in view of the discontinuous character of the process, and the absence of an influ-ent distribution system. A typical cycle of the anaero-bic reactor operated in batch and fed-batch mode consists of four steps: (i) feeding, which may have a variable filling time, defining the feed strategy as batch and/or fed-batch; (ii) the treatment itself, con-sisting of biotransforming the wastewater constitu-ents by microorganisms; (iii) sedimentation, when the biomass is in a granular form (ASBR), although when the biomass is immobilized on an inert support (AnSBBR) this step is not necessary; and (iv) dis-charge, consisting of removal of treated and clarified liquid (Zaiat et al., 2001; Dague et al., 1992; Fernandes
et al., 1993).
Within this context, the present study strived to achieve, through implementation of several opera-tional strategies, stable production of hydrogen from cheese whey wastewater, as well as to minimize methane production, using an anaerobic sequencing batch reactor containing biomass immobilized on an inert support (AnSBBR). Mixing of the liquid me-dium (substrate) and the biomass (microorganisms) was accomplished by recirculating the liquid phase. The different operating strategies used were: addition of hydrochloric acid in the feed medium; adaptation of the biomass with sucrose and lactose, pure and highly biodegradable carbohydrates; different forms of inoculation; use of skimmed milk to assess the presence of contaminants in the cheese whey; refrig-eration of the feed medium; removal of micronutri-ents and urea from the feed medium; and periodic washing of the biomass support material.
Biohydrogen from Cheese Whey Treatment in an AnSBBR: Achieving Process Stability 399
Brazilian Journal of Chemical Engineering Vol. 32, No. 02, pp. 397 - 408, April - June, 2015
generation in “small scale” production units. An additional goal was to assess the main limitations of this reactor related to: the possibility of over-load and resulting microbial inhibition; lower productivity due to sequencing charge–discharge operations; and the transient behavior inherent in batch operation.
MATERIAL AND METHODS
AnSBBR with Recirculation of the Liquid Phase and Immobilized Biomass
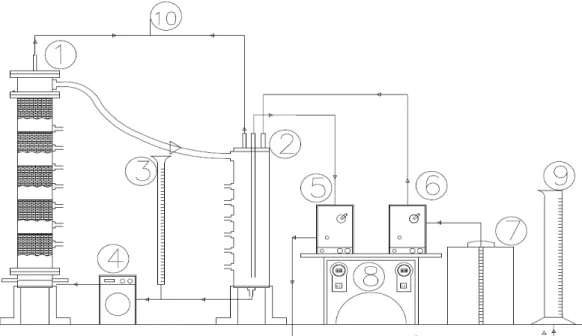
Figure 1 shows the experimental system proposed for the production of biohydrogen from the anaerobic treatment of whey. The reactor consisted of a cylin-drical acrylic flask with the following dimensions: height of 540 mm, external diameter of 100 mm and wall thickness of 3.5 mm. The lower part of the reac-tor consisted of a compartment with height of 40 mm designed to facilitate wastewater distribution. At the top of the reactor a compartment with a height of 60 mm was used as biogas collector (H2, CH4 and CO2). The total reactor volume was 4.3 L (empty volume).
The support for biomass immobilization was placed between stainless steel (grade 314) screens,
covered at the top by PVC screens, dividing the reac-tor into five compartments to prevent compaction of the bed and block passage of particles between the support compartments.
The recirculation system was composed of: (i) a lateral reservoir, which contained a volume of 2.9 L (empty volume), consisting of a cylindrical acrylic flask with the following dimensions: height of 430 mm, external diameter of 100 mm and wall thickness of 3.5 mm; and (ii) a peristaltic pump with adjustable flow, brand Ismatec, MCP model with maximum flow of 52.3 L.h-1. A 100 mL graduated cylinder was connected to the recirculation system to measure the recirculation flow. Hence, the total volume, resulting from the sum of the reactor volume (4.3 L) and the reservoir volume (2.9 L), was 7.2 L.
A control unit was used to automate feeding, dis-charge and recirculation operations. Feeding and discharge were carried out by diaphragm pumps (Prominent®, model Beta/5 with a capacity of up to 30 L.h-1 and Concept/0223 with a capacity of up to 23 L.h-1, respectively), aided by an automation system composed by timers (Coel®, model RTST/20).
To maintain a constant operation temperature (30± 1 °C), the system was kept in a chamber provided with resistances, coolers, fans, temperature sensor and controller (Lovato et al., 2012).
Brazilian Journal of Chemical Engineering Inoculation
The inoculum was obtained from previous hydro-gen production studies (Manssouri et al., 2013; Santos
et al., 2014). The support material, along with the biomass grown in these reactors, were stored in a refrigerator and used in the present work. Only in one condition was a different inoculation used. This inoculum was obtained from natural fermentation of the feed medium, prepared with tap water and kept for three days in an open container. This process favored fermentation of the medium by microorgan-isms present in the atmosphere and from the tap water used (Leite et al., 2008).
Support for Anaerobic Biomass Immobilization
Low-density polyethylene (LDPE) pellets, obtained from plastic waste recycling, were used as support for biomass immobilization. The particles were ap-proximately 5 mm long with a diameter of 3 mm.
Apparent and real densities of the support mate-rial were calculated by immersing a known mass of this material in a measuring cylinder with known volume of water. An apparent density of 470 g.L-1 and a real density of 825 g.L-1 were encountered, allowing calculation of a bed porosity of 43% (Manssouri et al., 2013; Santos et al., 2014).
Wastewater
The wastewater used in most conditions was formulated based on cheese whey (approximately 900 mg.L-1 of cheese whey). Commercial dehydrated cheese whey powder was used to prepare the waste-water and, after dissolution with tap waste-water, contained the following composition: carbohydrates (73.1%), proteins (11.2%), total fat (2.0%), fibers (0.0%), cal-cium (0.4%), sodium (0.7%), other minerals (7.6%), moisture (5.0%) and an energy value of 3540 kcal.kg-1 (15040 kJ.kg-1).
In some of the conditions investigated the sub-strate was changed in order to regain hydrogen pro-duction and inhibit methane propro-duction. The sub-strates used were sucrose and lactose (893 mg.L-1 sucrose/lactose per mgCOD.L-1).
In addition, in one of the experimental conditions sterilized skimmed milk was used, with the follow-ing composition (per 100 mL): 66 kcal of energy value; 9.9 g carbohydrate, 6.1 g protein; 263 mg sodium and 337 mg calcium (3600 mgCOD.L-1 was equivalent to 1430 mgCarbohydrates.L-1).
In some assays nitrogen, phosphorus and salts were supplemented to the wastewater (nitrogen at a
C/N ratio of 140 and phosphorus at a COD/P ratio of less than 500). This supplementation contained the following composition (Fontes Lima & Zaiat, 2012): urea/CH4N2O (11.5 mg.L-1), NiSO4.6H2O (0.5 mg.L-1), FeSO4.7H2O (2.5 mg.L-1), FeCl3.6H2O (0.25 mg.L-1), CoCl2.2H2O (0.04 mg.L-1), CaCl2.6H2O (2.06 mg.L-1), SeO2 (0.036 mg.L
-1
), KH2PO4 (5.36 mg.L -1
), K2HPO4 (1.3 mg.L-1), Na2HPO4H2O (2.7 mg.L-1) and NaHCO3 (500 mg.L-1).
Physical-Chemical Analysis
Reactor monitoring was performed by measuring the following in both influent and effluent samples: chemical oxygen demand (COD), total solids (TS), total volatile solids (TVS), total suspended solids (TSS), volatile suspended solids (VSS) and pH (APHA, 1998); partial alkalinity (PA), intermediate alkalinity (IA), total alkalinity (TA), bicarbonate alkalinity (BA) and total volatile acids (TVA) (Ripley et al., 1986); and total carbohydrates (Dubois et al., 1956).
The intermediate compounds of anaerobic metabo-lism (solvents: acetone, methanol, ethanol, n-butanol; volatile acids: acetic, propionic, butyric, isobutyric, valeric, isovaleric, and caproic acids) were analyzed with an Agilent Technologies 7890 gas chromatograph equipped with a flame ionization detector (FID), auto-matic injection (head space), GC Sampler 80, and an HP-Innowax column (30 m × 0.25 mm × 0.25 μm). Hydrogen was used as carrier gas with a flow rate of 1.56 mL.min-1. The injector temperature was 250 °C, injection volume 400 μL and split ratio 10. The oven temperature was programmed as follows: from 35 °C to 38 °C at 2 °C.min-1, from 38 °C to 75 °C at 10 °C.min-1, from 75 °C to 120 °C at 35 °C.min-1, at 120 °C for 1 min, from 120 °C to 170 °C at 10 °C.min-1 and at 170 °C for 2 min. The detector temperature was 280 °C with hydrogen flow (fuel) of 30 mL.min-1, synthetic air flow (oxidant) of 300 mL.min-1 and make up (nitrogen) flow of 30 mL.min-1. The head space method was employed in these analyses, using as internal standard crotonic acid (for volatile acids determination) and isobutanol (for determination of acetone and alcohols).
Biohydrogen from Cheese Whey Treatment in an AnSBBR: Achieving Process Stability 401
Brazilian Journal of Chemical Engineering Vol. 32, No. 02, pp. 397 - 408, April - June, 2015
isotherm for 5 min. The detector temperature was 150 °C, with a makeup (argon) flow rate of 8.33 mL.min-1.
Volumetric biogas production (VG) was measured with a Ritter Milligascounter gas meter.
At the end of each experimental condition the biomass inside the reactor was quantified. Initially, the liquid inside the reactor was drained and this volume was measured (VR). Next, all inert support containing biomass was removed from the reactor and measured (MT-IS+B), this material was homoge-nized for a sample of inert support and biomass (MS-IS+B). The pellets of this sample were “washed”, resulting in two parts, a solid phase of pellets and a liquid phase containing biomass from the reactor. In the solid phase the TS was calculated and in the liquid phase the TS and TVS. From the TS of the pellets (MS-TS) and the TVS of the liquid phase (MS-TVS) the biomass in the reactor was estimated; this informa-tion was presented in three different ways:
(i) The total amount of biomass in the reactor (MTVS - Equation (2)): measures the ability of the reactor to retain biomass; this variable was also used in other indicators, such as the applied specific or-ganic load (ASOL) and the daily specific molar pro-ductivity of hydrogen (SMPr).
S TVS T IS B
TVS B
S IS
M M .M
M
− − +
− +
= (2)
(ii) Relation between the amount of biomass and the volume of liquid medium in the reactor (CX - Equation (3)): the biomass concentration in the reac-tor and the liquid volume treated per cycle enable the measurement of the ratio between the amount of liquid medium available for treatment and the bio-mass involved in the biotransformations inherent to the biological process under investigation (CX).
TVS X
R M C
V
= (3)
(iii)Relation between the amount of biomass and the amount of support material in the reactor (CX’ - Equation (4)): the biomass concentration and the mass of inert support in the reactor enable the measurement of the ratio between the quantity of inert support available for immobilization/retention of the biomass and the biomass involved in the bio-transformations inherent to the biological process under investigation (CX’).
S TVS X
S TS M C '
M
− −
= (4)
Experimental Procedure
The assays performed in the AnSBBR with recir-culation are summarized in Table 1. After adding the inert support and inoculum to the reactor, the opera-tion was carried out as follows: in the first cycle the system was fed with 3.5 L (2.0 L in the reactor, and 1.5 L in the reservoir) in 20 min. Next, flow recir-culation was started (20 Lh-1 - recirculation rate of 0.2 cm.s-1). At the end of a cycle, the recirculation flow was turned off and 1.5 L of the medium was discharged (in 10 min) and 2.0 L was maintained in the reactor (called residual volume), i.e., the total volume of the liquid medium in the system was 3.5 L. Immediately after this discharge, a new cycle began with feeding (with a constant flow of 1.5 L of me-dium) in 10 min, followed by recirculation of the liquid phase. At the end of the cycle, recirculation was again discontinued and the reactor discharged. Thus, the cycle was repeated, characterizing a se-quencing batch.
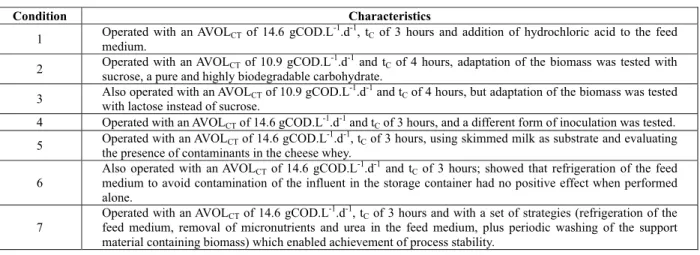
Table 1: Characteristics of each condition (selective pressures) tested to achieve process stability.
Condition Characteristics
1 Operated with an AVOLCT of 14.6 gCOD.L-1.d-1, tC of 3 hours and addition of hydrochloric acid to the feed
medium.
2 Operated with an AVOLCT of 10.9 gCOD.L-1.d-1 and tC of 4 hours, adaptation of the biomass was tested with
sucrose, a pure and highly biodegradable carbohydrate.
3 Also operated with an AVOLCT of 10.9 gCOD.L-1.d-1 and tC of 4 hours, but adaptation of the biomass was tested
with lactose instead of sucrose.
4 Operated with an AVOLCT of 14.6 gCOD.L-1.d-1 and tC of 3 hours, and a different form of inoculation was tested.
5 Operated with an AVOLCT of 14.6 gCOD.L-1.d-1, tC of 3 hours, using skimmed milk as substrate and evaluating
the presence of contaminants in the cheese whey.
6
Also operated with an AVOLCT of 14.6 gCOD.L-1.d-1 and tC of 3 hours; showed that refrigeration of the feed
medium to avoid contamination of the influent in the storage container had no positive effect when performed alone.
7
Operated with an AVOLCT of 14.6 gCOD.L-1.d-1, tC of 3 hours and with a set of strategies (refrigeration of the
Brazilian Journal of Chemical Engineering
In some experiments, profiles were taken of the following: filtered organic matter concentration (car-bohydrates and COD), bicarbonate alkalinity (BA), total volatile acids (TVA), intermediate metabolites (volatile acids and solvents), and biogas (composi-tion and produc(composi-tion), as well as pH. This enabled a better understanding of the metabolic pathways throughout a cycle. The samples for the profile were collected at 30 min intervals throughout the cycle. The total volume of the withdrawn samples did not exceed 350 mL, or less than 10% of the volume of the reaction medium.
Theoretical
The efficiencies of organic matter removal in the forms of COD and carbohydrates in unfiltered sam-ples (εST and εCT) were calculated by Equations (5) and (6), in which CCT and CST are the organic matter concentrations in the forms of COD and carbohy-drates of the unfiltered influent samples, CCT,E and CST,E are the effluent organic matter concentrations in the form of COD and carbohydrates of unfiltered samples. CT CT,E C C T T C C (%) 100 C − = ⋅
ε (5)
ST ST,E S S T T C C (%) 100 C − = ⋅
ε (6)
The efficiencies of organic matter removal in the forms of COD and carbohydrates in filtered samples (εCF and εSF) were calculated in a similar way by Equations (7) and (8).
CT CF,E C C T F C C (%) 100 C − = ⋅
ε (7)
ST SF,E S S T F C C (%) 100 C − = ⋅
ε (8)
The applied volumetric organic loads (AVOLCT or AVOLST), expressed in kgCOD.m-3.d-1 and kgCarbohydrate.m-3.d-1, are defined as the amount of organic matter in the form of COD or carbohydrate applied to the reactor per unit time and per reactor medium. For batch reactors, they are calculated by Equations (9) and (10), in which VF is the volume of wastewater fed to the reactor per cycle, N is the number of cycles per day and VR is the total volume of wastewater contained in the reactor per cycle.
F CT R CT (V .N).C AVOL V
= (9)
F ST R ST (V .N).C AVOL V
= (10)
The applied specific organic loads (ASOLCT or ASOLST), expressed in kgCOD.gSVT.d-1 and kgCarbohydrate.gSVT.d-1, are defined as the amount of organic matter in the form of COD or carbohy-drates applied to the reactor per unit time and per mass of total volatile solids in the reactor (gCOD.gTVS-1.d-1 or gCarbohydrate.gTVS-1.d-1). For batch reactors they are calculated by Equations (11) and (12), in which MTVS is the mass of total volatile solids inside the reactor.
CT F CT
TVS (V .
AS N).C
M
OL = (11)
ST F ST
TVS (V .
AS N).C
M
OL = (12)
The daily molar productivity of hydrogen (MPr), expressed in molH2.m-3.d-1, is defined by the ratio between the hydrogen produced per unit time and per volume of medium. It is calculated by Equation (13), in which nH2represents the daily molar production of hydrogen and VR is the volume of medium in the reactor.
The daily specific molar productivity of hydrogen (SMPr), expressed in mol.H2.kgSVT-1.d-1, is defined by the ratio between the hydrogen produced per unit time and per mass of total volatile solids inside the reactor. It is calculated by Equation (14).
2 H R n MPr V
= (13)
2 H TVS n SMPr M
= (14)
The molar yields per applied load, defined by the ratio between the hydrogen produced per organic matter applied in the form of COD (MYALC,m) in molH2.kgCOD-1 and in the form of carbohydrate (MYALS,m) in molH2.kgCarbohydrate-1, are calcu-lated by Equations (15) and (16), respectively.
2 H F T C,m C MY n N.V A .C
Biohydrogen from Cheese Whey Treatment in an AnSBBR: Achieving Process Stability 403
Brazilian Journal of Chemical Engineering Vol. 32, No. 02, pp. 397 - 408, April - June, 2015
2
H F T S,m
S
MY n
N.V A
.C
L = (16)
The molar yields per removed load, defined by the ratio between hydrogen produced per organic matter removed in the form of COD (MYRLC,m) in molH2.kgCOD-1 and in the form of carbohydrate (MYRLS,m) in molH2.kgCarbohydrate-1, are calculated by Equations (17) and (18), respectively.
2
H F CT CF ,
E C m
, n
N.V .(C C )
MYRL =
− (17)
2
H F ST SF ,
E S m
, n
N.V .(C C )
MYRL =
− (18)
Washing Procedure of the Support Material During Reactor Operation
During Condition 7, systematic washing of the support material was performed for a better control of the amount of biomass present in the reactor to make up for the cell growth due to metabolic charac-teristics of the acidogenic microorganisms and the high organic applied/removed load (growth kinetics). Therefore, the aim was to improve stability and effi-ciency of biohydrogen production.
The first step of the procedure consisted of dis-charging the entire liquid medium contained in the reactor and measuring the volume, total solids and total volatile solids (mBL1). After removing "inert support + biomass" contained in the reactor the total mass was measured. A small sample was collected to calculate the values of Cx and Cx’ (relation between the amount of biomass and the volume of the liquid medium and the amount of support material in the reactor, respectively) in accordance with previously described methodology.
The next step was to carry out the washing of the "inert support + biomass" by adding 1 liter of tap water and separating the washing water using a sieve. A 50 mL sample was withdrawn from this washing water for analysis of total solids and total volatile solids to calculate the biomass removed from the system (mBL2), in the same way as for the liquid discharged in the first step.
The amount of biomass removed by washing (in grams of TVS) was the sum of mBL1 (calculated by the concentration of the total volatile solids divided by the volume of the liquid discharged from the reactor) and mBL2 (calculated by the concentration of the total volatile solids divided by the volume of water
used for washing the system "biomass + inert support," i.e., one liter). From the values of Cx and Cx’ before and after washing it was possible to estimate cell growth during the experimental condition.
RESULTS AND DISCUSSION
The operation of the AnSBBR with recirculation of the liquid phase (3.5 ± 0.1 L of working volume and treating 1.5 ± 0.1 L per cycle at 30 ± 1 °C) using cheese whey as substrate (4070 ± 390 mgCOD.L-1 and 3240 ± 310 mgCarbohydrate.L-1) experienced, from the very beginning, problems to produce biohydro-gen. In order to obtain stable production of H2, as well as to minimize the production of methane, seven conditions were performed with different oper-ating strategies.
Under all conditions the efficiency of carbohy-drate conversion was always high (98 ± 2%) and that of organic matter was always low (30 ± 3%). Among the intermediate products, the highest concentrations were acetic acid, butyric acid and ethanol.
Figure 2 shows the volume of total biogas pro-duced and the daily molar production of each com-ponent. Thus, given that the operation with cheese whey for hydrogen production presented problems from the very beginning, several selective pressures were tested to achieve process stability (Table 1).
The reason for adding hydrochloric acid in Con-dition 1 was to create extreme pH conCon-ditions where the spore-forming hydrogen producing microorgan-isms would survive, while the non-spore forming methane-producing microorganisms would be elimi-nated (Kraemer & Bagley, 2007). However, this strategy had no effect and the production of CH4 occurred even at very low pH values, contradicting findings in the literature (Luo et al., 2011). It should be mentioned that the presence of methane, even at pH below 5.0, has been reported in other studies that used cheese whey in acidogenic reactors (Castelló et al., 2009; Carrillo-Reyes et al., 2012).
The strategies in which the biomass was accli-mated with pure carbohydrates (sucrose and lactose - Conditions 2 and 3, respectively) also had no effect. It should be mentioned that during the period in which the reactor was fed with pure carbohydrate, there was stable production of H2 without the pres-ence of CH4. Acclimation of the biomass was per-formed by changing reactor feeding from pure carbo-hydrate to cheese whey straightforwardly.
Brazilian Journal of Chemical Engineering
Figure 2: Volume of total biogas produced (--♦--) and daily molar production of each component of this biogas (□– CO2; ▲ - H2; ○ – CH4).
methodology proposed by Leite et al. (2008), four liters of feed medium prepared with 4250 mgCOD.L-1 were left open in the storage container for 3 days, and then introduced into the reactor in batch mode, re-maining in recirculation for an additional 3 days. Jus-tification for this procedure was to favor cultivation of spore forming microorganisms and minimize the development of non-spore forming methanogenic microorganisms. In this context, Penteado et al. (2013) studied the influence of different inoculum pretreatment methods for the production of biohydro-gen from synthetic sucrose-based wastewater and also managed to prevent the production of methane by using natural fermentation of the feed medium. However, in the present work, the elimination of methane production with this form of inoculation was not accomplished, indicating that this strategy is not totally guaranteed, and methanogens may survive the adverse conditions imposed by this type of inocu-lation, even without spore formation.
The use of commercial sterilized skimmed milk in Condition 5 was performed to test whether the problem in the hydrogen production with cheese
whey as substrate was associated with any possible contamination of the raw material used (cheese whey powder). However, this condition also resulted in zero H2 at the end of the operation, indicating that the instability in hydrogen production with cheese whey was not caused by contamination.
Storage of the feed medium in a refrigerator at 4 °C was the first positive step towards stability of hydro-gen production (Condition 6), probably because of contamination of the cheese whey in the storage container, due to its high biodegradability (Castelló
et al., 2009; Prazeres et al., 2012; Perna et al., 2013). The AnSBBR was thus fed with significant amounts of volatile acids, turning it into a methanogenic reac-tor of a combined acidogenic-methanogenic process. Table 2 contains results of some analyses carried out with the "non-refrigerated and 24 h stored" feed me-dium, showing that degradation occurred in the stor-age container. Table 3 contains some analyses with the "refrigerated and 24 h stored" feed medium showing that its characteristics were maintained, without degradation of the substrate or increase in the production of volatile fatty acids.
Table 2: Analysis of the "non-refrigerated and 24 h stored" feed medium.
“Fresh” feed medium Feed medium “after 24 h” Temperature Concentration of the
feed medium at preparation
Concentration 24 h after preparation of
the feed medium
Biodegradation
pH TVA (Total Volatile Acids)
pH TVA (Total Volatile Acids) (°C) (mgCarbohydrate.L-1) (mgCarbohydrate.L-1) (%) (u) (mgHAc.L-1) (u) (mgHAc.L-1)
35 3822 680 82 7.59 112 4.11 823
29 3679 2937 20 5.09 139 4.05 379
26 3795 1996 47 5.44 118 4.05 362
29 3795 2099 45 5.68 111 4.05 198
Table 3: Analysis of the "refrigerated and 24 h stored" feed medium.
“Fresh” feed medium Feed medium “after 24 h” Temperature Concentration of the
feed medium at preparation
Concentration 24 h after preparation of
the feed medium
Biodegradation
pH TVA (Total Volatile Acids)
pH TVA (Total Volatile Acids) (°C) (mgCarbohydrate.L-1) (mgCarbohydrate.L-1) (%) (u) (mgHAc.L-1) (u) (mgHAc.L-1)
4 3482 3439 1.2 7.69 103 7.92 108
4 3736 3696 1.1 7.62 109 7.73 109
4 3673 3521 4.1 7.54 114 7.94 116
4 3732 3647 2.3 6.28 109 6.28 109
Biohydrogen from Cheese Whey Treatment in an AnSBBR: Achieving Process Stability 405
Brazilian Journal of Chemical Engineering Vol. 32, No. 02, pp. 397 - 408, April - June, 2015
Refrigeration of the feed medium in the storage container, on the other hand, apparently resulted in H2S production; there was a characteristic odor in the reactor and formation of white substance covering the exterior of the supply hoses. This probably oc-curred due to the action of sulfate-reducing bacteria (SRB); however, specific analyses for the detection of sulfer compound have not been carried out. This would explain the decrease in hydrogen production without concomitant increase of methane. So, in order to prevent this apparent H2S production, it was decided, in Condition 7, to feed the reactor only with cheese whey and sodium bicarbonate, eliminating supplementation of urea and nutrients, because the nutrient solution used contained approximately 13 mgSO4.L-1 (from nickel sulfate and ferrous sulfate), a considerably high amount for a nutrient that is re-quired in small amounts for cell growth.
Hence, the operational strategy of Condition 7 was able to eliminate the action of sulfate-reducing bacteria (SRB), which were probably consuming hydrogen in the presence of sulfate according to the reaction
2
4 2 2 2
SO −+4H →H S+2H O+2OH− (Δ = −G 154 Jk ). Castelló et al. (2009) highlight in their work the im-portance of specific studies related to nutrient sup-plementation of cheese whey for biohydrogen pro-duction. In the specific case of the AnSBBR, supple-mentation was inadequate for the process and its removal resulted in a significant increase in hydrogen production.
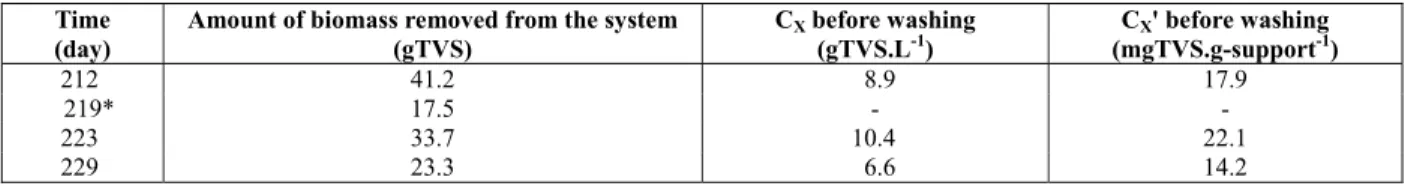
The production of biogas and hydrogen, however, began to show a gradual decrease, even without pro-duction of H2S or CH4. So, it was decided to perform systematic washings of the support material in order to minimize the concentration of biomass in the reac-tor. This procedure was performed to control cell growth by maintaining the concentrations of biomass (Cx and Cx’) at low values, as can be seen in Table 4. As a result, there was stable production of biohydro-gen (Condition 7) with minimal methane formation
(Figure 2); the success of this strategy was attributed to a probable increase in the applied specific organic load by decreasing the amount of biomass in the reactor, creating more favorable conditions for the growth of acidogenic bacteria, which have a higher growth rate than the methanogenic microorganisms (Lettinga & Haandel, 1993).
The operating strategy (Condition 7) that proved to be effective for stable production of biohydrogen in an AnSBBR treating cheese whey was the removal of the nutrient solution and urea from the feed me-dium, along with refrigeration of this medium during the storage period, as well as the periodic washing of the support material. Table 5 contains the results of biohydrogen production indicators obtained under the conditions of process stability: beginning of Con-dition 2, with sucrose feeding; beginning of ConCon-dition 3, with lactose feeding; and the end of Condition 7.
The condition with sucrose as substrate showed the best values of the biohydrogen production indica-tors in relation to the condition with lactose as sub-strate. This result was expected due to the biodegrad-ability characteristics of these carbohydrates. How-ever, the condition in which cheese whey was used as substrate also showed the best values of biohydro-gen production indicators in relation to pure lactose. This behavior may be attributed to the balanced com-position of the cheese whey, in nutritional terms, for the acidogenic microorganisms.
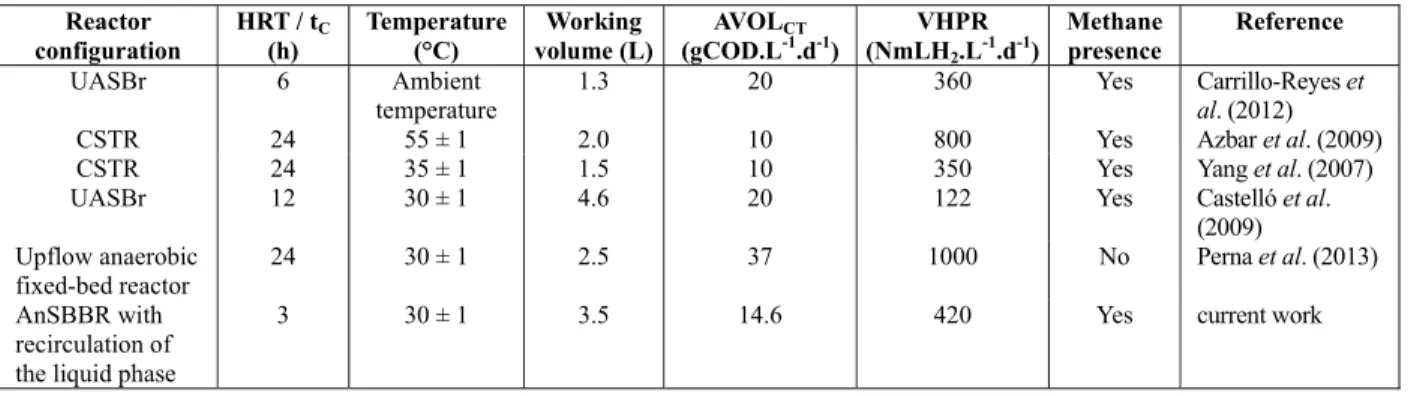
A more important comparison can be made with different reactor configurations (Table 6). There are no other studies in the specialized literature that use an AnSBBR fed with cheese whey. In addition, the reac-tor configuration used in the present work showed excellent results compared with traditional configura-tions like the UASBr or the CSTR. Another important point that should be highlighted is the stability reached by the AnSBBR in the steady-state phase, while most of the other configurations mentioned increased instability, with sharp peaks and valleys.
Table 4: Biomass in the reactor related to the washing procedure of the support material.
Time (day)
Amount of biomass removed from the system (gTVS)
CX before washing
(gTVS.L-1)
CX' before washing
(mgTVS.g-support-1)
212 41.2 8.9 17.9
219* 17.5 - -
223 33.7 10.4 22.1
229 23.3 6.6 14.2
Brazilian Journal of Chemical Engineering
Table 5: Biohydrogen production indicators under the conditions with sucrose, lactose and cheese whey.
MYRLS,n nH2 MPr SMPr MYALC,m MYALS,m MYRLC,m MYRLS,m
Substrate
(
molH2)
kgCarbohydrate
( )
2
molH
d
( )
2 3
molH
m .d
(
)
2
molH
kgTVS.d
(
)
2
molH
kgCOD
(
)
2
molH
kgCarbohydrate
(
)
2
molH
kgCOD
(
2)
molH kgCarbohydrateSucrose 1.54 0.11 31.1 - 3.32 3.71 16.4 4.45
Lactose 0.48 0.04 10.5 2.08 1.19 1.31 6.92 1.41
Cheese whey 0.60 0.07 18.1 4.32 1.37 1.72 4.50 1.74
Intermediate product Metabolic pathway Theoretical
MYRLS,n
Theoretical MYALS,m
Acetic acid C12H22O11 + 5 H2O → 4 CH3COOH + 4 CO2 + 8 H2 8 23.4
Butyric acid C12H22O11 + 2 H2O → 2 CH3CH2CH2COOH + 4 CO2 + 4 H2 4 11.7 Influent concentration of 4070 ± 390 mgCOD.L-1
and 3240 ± 310 mgCarbohydrate.L-1 . Effluent concentration of 2830 ± 170 mgCOD.L-1
and 51 ± 4 mgCarbohydrate.L-1 . Conversion of COD and carbohydrates of 30 ± 3% and 98 ± 3%, respectively. Influent pH of 7.7 ± 0.2 and Effluent pH of 4.3 ± 0.3.
Temperature of 30 ± 1 °C.
Working volume of 3.5 ± 0.1 L and treating 1.5 ± 0.1 L in 3 h cycle.
Table 6: Comparison between different reactor configurations using cheese whey as substrate.
Reactor configuration
HRT / tC
(h)
Temperature (°C)
Working volume (L)
AVOLCT
(gCOD.L-1.d-1)
VHPR (NmLH2.L-1.d-1)
Methane presence
Reference
UASBr 6 Ambient
temperature
1.3 20 360 Yes Carrillo-Reyes et
al. (2012)
CSTR 24 55 ± 1 2.0 10 800 Yes Azbar et al. (2009)
CSTR 24 35 ± 1 1.5 10 350 Yes Yang et al. (2007)
UASBr 12 30 ± 1 4.6 20 122 Yes Castelló et al.
(2009) Upflow anaerobic
fixed-bed reactor
24 30 ± 1 2.5 37 1000 No Perna et al. (2013)
AnSBBR with recirculation of the liquid phase
3 30 ± 1 3.5 14.6 420 Yes current work
CONCLUSIONS
The use of cheese whey for the production of bio-hydrogen in an AnSBBR (3.5 L of working volume and treating 1.5 L in 3 or 4 h cycles at 30 °C) was studied by analyzing the influence of the following selective pressures on process stability: acclimation of the biomass with pure carbohydrates (sucrose and lactose), pH control at very low values, supplementa-tion of nutrients, a different form of inoculasupplementa-tion (natu-ral fermentation of the feed medium), refrigeration of the feed medium at 4 °C during storage and system-atic washing of the support material. Favorable oper-ating conditions for achieving stable hydrogen pro-duction with a very small amount of methane (36% H2; 62% CO2; 2% CH4) were: the refrigeration strat-egy, preventing substrate degradation in the storage recipient and consequent acidification of the influent, eliminating nutrient supplementation to prevent the action of sulfate-reducing bacteria and periodic washing of the support material to increase the spe-cific ratio of feeding and minimize the action of
homoacetogenic microorganisms. The best results for biohydrogen production were obtained using cheese whey as a substrate with an applied volumetric organic loading of 14.6 gCOD.L-1.d-1 (3 h cycle and influent concentration of 4070 mgCOD.L-1 and 3240 mgCarbohydrate.L-1) in relation to pure lactose (0.60 and 0.48 molH2.molCarbohydrate-1, respectively), demonstrating the potential of this wastewater. Furthermore, the AnSBBR fed with cheese whey showed excellent biohydrogen production results of 420 NmLH2.L-1.d-1 in the steady state (conversions of carbohydrates and COD were 98% and 30%, respectively), compared with other classic reactor configurations using the same substrate.
ACKNOWLEDGMENTS
Biohydrogen from Cheese Whey Treatment in an AnSBBR: Achieving Process Stability 407
Brazilian Journal of Chemical Engineering Vol. 32, No. 02, pp. 397 - 408, April - June, 2015
Tecnológico – CNPq (Process 308497/2010-4).
NOMENCLATURE
AnSBBR Anaerobic Sequencing Batch Biofilm Reactor
TS Total solids concentration (mgTS.L-1) TVS Total volatile solids concentration
(mgTVS.L-1)
TSS Total suspended solids concentration (mgTSS.L-1)
VSS Volatile suspended solids concentration (mgVSS.L-1)
pH Hydrogen ion potential (u)
CCT Concentration based on organic matter for unfiltered samples in the influent
(mgCOD.L-1)
CST Concentration based on carbohydrates for unfiltered samples in the influent
(mgCarbohydrate.L-1)
CCT,E Concentration based on organic matter for unfiltered samples in the effluent
(mgCOD.L-1)
CCF,E Concentration based on organic matter for filtered samples in the effluent
(mgCOD.L-1)
CST,E Concentration based on carbohydrates in the influent for unfiltered samples (mgCarbohydrate.L-1)
CSF,E Concentration based on carbohydrates for filtered samples in the effluent
(mgCarbohydrate.L-1)
AVOLCT Applied volumetric organic load based on organic matter (gCOD.L-1.d-1)
AVOLST Applied volumetric organic load based on carbohydrate (gCarbohydrate.L-1.d-1) ASOLCT Applied specific organic load based on
organic matter (gCOD.gSVT-1.d-1) ASOLST Applied specific organic load based on
carbohydrate (gSAC.gSVT-1.d-1)
CX Relation between the amount of biomass and the volume of liquid medium in the reactor (gTVS.L-1)
CX’ Relation between the amount of biomass and the amount of support material present in the reactor
(mgTVS.g-support-1)
εCT Removal efficiency based on organic matter (COD) for unfiltered samples (%)
εCF Removal efficiency based on organic matter (COD) for filtered samples (%)
εST Removal efficiency based on
carbohydrates for unfiltered samples (%) SF
ε Removal efficiency based on
carbohydrates for filtered samples (%) MT-IS+B Total mass of the inert support and the
biomass in the reactor (g)
MS-IS+B Sample mass of the inert support and the biomass in the reactor (g)
MS-TS Total solids mass (TS) of the biomass sample (g)
MS-TVS Total volatile solids mass (TVS) of the biomass sample (g)
MTVS Total biomassin the reactor in total volatile solids (gTVS)
mBL1 Concentration of total volatile solids divided by the volume of the liquid discharged from the reactor (gTVS) mBL2 Concentration of total volatile solids
divided by the volume of water used for washing the system "biomass + inert support," i.e., one liter (gTVS) N Number of cycles per day
nCH4 Daily molar production of methane (mmolH2.d-1)
nCO2 Daily molar production of carbon dioxide (mmolH2.d-1)
nH2 Daily molar production of hydrogen (mmolH2.d
-1 )
MPr Daily molar productivity of hydrogen (molH2.m-3.d-1)
SMPr Daily specific molar productivity of hydrogen (molH2.kgTVS-1.d-1)
MYRLS,n Molar yield per removed load based on carbohydrates, expressed as moles (molH2.molCarbohydrate
-1 )
MYALS,m Molar yield per applied load based on carbohydrates expressed as kg (molH2.kgCarbohydrate-1)
MYRLS,mMolar yield per removed load based on carbohydrates expressed as kg
(molH2.kgCarbohydrate-1)
MYALC,mMolar yield per applied load based on organic matter expressed as kg (molH2.kgCOD-1)
MYRLC,mMolar yield per removed load based on organic matter expressed as kg
(molH2.kgCOD-1)
UASBr Up-flow Anaerobic Sludge Blanket Reactor
tC Cycle length (h.Cycle-1)
VF Volume of wastewater fed during the cycle (L.Cycle-1)
VR Volume of liquid medium in the reactor (L) VG Volume of total biogas produced in the TP
(NmL.d-1)
VHPR Volumetric hydrogen production rate (NmLH2.L
Brazilian Journal of Chemical Engineering REFERENCES
APHA, Standard Methods for the Examination of Water and Wastewater. New York: American Public Health Association (1998).
Azbar, N., Dokgöz, F. T. Ç., Keskin, T., Korkmaz, K. S., Syed, H. M., Continuous fermentative hydro-gen production from cheese whey wastewater under thermophilic anaerobic conditions. Interna-tional Journal of Hydrogen Energy, 34, 7441-7447 (2009).
Calli, B., Yukselen, M. A., Anaerobic treatment by a hybrid reactor. Environmental Energy Science, 19, 143-150 (2004).
Carrillo-Reyes, J., Celis, L. B., Alatriste-Mondragón, F., Razo-Flores, E., Different start-up strategies to enhance biohydrogen production from cheese whey in UASB reactor. International Journal of Hydrogen Energy, 37, 5591-5601 (2012).
Castelló, E., Garcia Santos, C., Iglesias, T., Paolino, G., Wenzel, J., Borzacconi, L., Etchebehere, C., Feasibility of biohydrogen production from cheese whey using a UASB reactor: Links between mi-crobial community and reactor performance. In-ternational Journal of Hydrogen Energy, 34, 5674-5682 (2009).
Dague, R. R., Habben, C. E., Pidaparti, S. R., Initial studies on the anaerobic sequencing batch reactor. Water Science Technology, 26, 2429-2432 (1992). Dubois, S. M., Gilles, K. A., Hamilton, J. L., Rebers, P. A., Smith, F., Colorimetric methods for deter-mination of sugar and related substance. Analitical Chemistry, 228, 13-21 (1956).
Fernandes, L., Kennedy, K. J., Ning, Z., Dynamic modeling of substrate degradation in sequencing batch anaerobic reactors (SBAR). Water Research, 27, 1619-1628 (1993).
Ghaly, A. E., Ramkumar, D. R., Sadaka, S. S., Rochon, J. D., Effect of reseeding and pH control on the performance of a twostage mesophilic anaerobic digester operating on acid cheese whey. Canadian Agricultural Engineering, 42, 173-183 (2000). Köpke, M., Held, C., Hujer, S., Liesegang, H., Wiezer,
A., Wollherr, A., Ehrenreich, A., Liebl, W., Gottschalk, G., Dürre P., Clostridium ljungdahlii
represents a microbial production platform based on syngas. PNAS, 107, 13087-13092 (2010). Lima, D. M. F., Zaiat, M., The influence of the degree
of back-mixing on hydrogen production in an anaerobic fixed-bed reactor. International Journal of Hydrogen Energy, 37, 9630-9635 (2012). Kraemer, J. T., Bagley, D. M., Improving the yield
from fermentative hydrogen production. Biotech-nology Letters, 29, 685-695 (2007).
Leite, J. A. C., Fernandes, B. S., Pozzi, E., Barboza,
M., Zaiat M., Application of an anaerobic packed-bed bioreactor for the production of hydrogen and organic acids. International Journal of Hydrogen Energy, 33, 579-586 (2008).
Lettinga, G., Haandel, A. C., Anaerobic Digestion for Energy Production and Environmental Protection. In: Renewable Energy - Sources for Fuels and Electricity, T. B. Johansson, et al. (Editors). Is-land Press, London, 817-839 (1993).
Liou, J., Balkwill, D. L., Drake, G. R., Tanner, R. S.,
Clostridium carboxidivorans sp. nov., a solvent-producing clostridium isolated from an agricul-tural settling lagoon, and reclassification of the acetogen Clostridium scatologenes strain SL1 as Clostridium drakei sp. International Journal of System and Evolution Microbiology, 55, 2085-2091 (2005).
Luo, G., Karakashev, D., Xie, L., Zhou, Q., Angelidaki, I., Long-term effect of inoculum pretreatment on fermentative hydrogen production by repeated batch cultivations: Homoacetogenesis and methano-genesis as competitors to hydrogen production. Biotechnology and Bioengineering, 108, 1816-1827 (2011).
Lovato, G., Bezerra, R. A., Rodrigues, J. A. D., Ra-tusznei, S. M., Zaiat, M., Effect of feed strategy on methane production and performance of an AnSBBR treating effluent from biodiesel produc-tion. Applied Biochemical and Biotechnology, 166, 2007-2029 (2012).
Manssouri, M., Rodrigues, J. A. D., Ratusznei, S. M., Zaiat, M., Effects of organic loading, influent concentration and feed time on biohydrogen pro-duction in a mechanically stirredAnSBBR treat-ing sucrose based wastewater. Applied Biochemi-cal and Biotechnology, 171, 1832-1854 (2013). Mawson, A. J., Bioconversion for whey utilisation
and waste abatement. Bioresource Technology, 47, 195-203 (1994).
Ntaikou, I., Gavala, H. N., Kornaros, M., Lyberatos, G., Hydrogen production of sugars and sweet sor-ghum biomass using Ruminococcus albus. Inter-national Journal of Hydrogen Energy, 33, 1221-1231 (2008).
Penteado, E. D., Lazaro, C. Z., Sakamoto, I. K., Zaiat, M., Influence of seed sludge and pretreatment method on hydrogen production in packed-bed anaerobic reactors. International Journal of Hy-drogen Energy, 38, 6137-6145 (2013).