ISSN 0104-6632 Printed in Brazil
www.abeq.org.br/bjche
Vol. 32, No. 02, pp. 357 - 365, April - June, 2015 dx.doi.org/10.1590/0104-6632.20150322s00003675
Brazilian Journal
of Chemical
Engineering
OPTIMIZATION OF THE OPERATING
CONDITIONS FOR RHAMNOLIPID PRODUCTION
USING SLAUGHTERHOUSE-GENERATED
INDUSTRIAL FLOAT AS SUBSTRATE
W. S. Borges
*, A. A. O. Moura, U. Coutinho Filho, V. L. Cardoso and M. M. Resende
Faculty of Chemical Engineering, Uberlândia Federal University P.O. Box 593, Av. João Naves de Ávila 2121, Campus Santa Mônica - Bloco 1K, CEP: 38400-902, Uberlândia - MG, Brazil.
Phone: +55 (34) 3239-4249, Fax: +55 (34) 3239-4188 *
E-mail: [email protected]
E-mail: [email protected]; [email protected]; [email protected]; [email protected]
(Submitted: February 12, 2014 ; Revised: July 28, 2014 ; Accepted: September 12, 2014)
Abstract - Biosurfactants have a wide range of applications in emulsions, separations, and solubilization because these chemicals reduce the surface tension and viscosity of solutions. This work studied rhamnolipid production using a batch bioreactor with a working volume of 1.5 liters, Pseudomonas aeruginosa ATCC (American Type Culture Collection) 10145 strain, and the greasy effluent from the slaughter of poultry and pigs as the substrate. The main goal of this research was to evaluate the level of aeration, agitation speed and inoculum concentration using a Central Composite Design (CCD). Experimental conditions were selected using the surface response technique obtained from the CCD, and the results were validated to test the reproducibility. The following operating conditions were selected: 1.2 vvm level of aeration, 600 rpm agitation speed, and 1.0 g/L biomass inoculum concentration. Under these conditions, the following results were obtained: the rhamnose production, surface tension and emulsifying index were 5.37 g/L, 25.6 dyne/cm and 100%, respectively.
Keywords:Biosurfactant; Agitation speed; Aeration level; Rhamnolipid.
INTRODUCTION
Surfactants are surface-active molecules that, be-yond serving other functions, allow the growth of microorganisms in water-immiscible substrates by reducing the surface tension, which makes the sub-strate available for assimilation and metabolism by the microorganisms (Kronemberger, 2007).
Biosurfactants can be classified according to their biochemical composition and the microorganism used for production (Banat, 2000). According to Tuleva et al. (2002), rhamnolipids are biosurfactants that belong
to the glycolipids class and are produced mainly from hydrocarbons by the bacterium Pseudomonas aeruginosa (Gram-negative). Rhamnolipids are effi-cient in the bioremediation of soils polluted by oily compounds (Santa Anna et al., 2007). According to Pirollo (2006) and Moussa et al (2014), rhamnolipids consist of one or two rhamnose molecules and one or two fatty acid chains of 8 to 12 carbon atoms, which may be saturated or unsaturated.
bio-degradability standards. Unlike biosurfactants, chemi-cal surfactants are not biodegradable and create environmental problems due to toxicity and accumu-lation in natural ecosystems (Kronemberger, 2007).
Nitschke and Pastore (2002) report that biosurfac-tants have a wide range of applications in emulsions, separations, and solubilization because these chemi-cals reduce the surface tension and viscosity of solu-tions. These features allow biosurfactants to be used widely in the food, agricultural, textile and pharma-ceutical industries. According to Barbosa and Peace (2007) and Gallert and Winter (2002), biosurfactants have the properties of a detergent, which makes these biomolecules versatile products for reducing environmental pollution.
Several authors have also studied the operating conditions for biosurfactant production. Benincasa et al. (2002) studied rhamnolipid production by Pseu-domonas aeruginosa using agitation speeds from 500 to 800 rpm in a 2 L Biostat B reactor (B. Braun Biotech International) with a working volume of 1.2 L. The process also had a foam recycling system and was aerated using a sparger at 3 L air/min. For each agitation speed, the O2 solution transfer coefficients, KLa, were calculated. Lee et al. (2004) observed rhamnolipid production in batch and fed-batch fer-mentation using Pseudomonas aeruginosa, and the agitation speed and aeration rate in the batch culture ranged from 100 to 250 rpm and 1.0 to 3.0 L/min. The optimum conditions for the batch culture, using a 7-L jar fermentor, were an agitation speed of 200 rpm and an aeration rate of 2.0 L/min.
According to Mulligan (2005) and Rahman and Gakpe (2008), biosurfactants are used in bioremedia-tion processes to degrade substrates that are insolu-ble in water, fats and oils. These factors suggest the possibility of biosurfactant production from indus-trial float from the slaughterhouse. The slaughter-house effluent is usually subjected to physical and chemical treatments, such as flotation and centrifu-gation. The organic compost produced from this treat-ment is called industrial float.
These floats have high percentages of crude pro-tein (44.03%), ether extract (32.74%), and dry matter (35.12%), and approximately 1 million tons of indus-trial float is produced per year (Zimmer and Klein, 2011).
Therefore, this study aimed to optimize rham-nolipid production with the fermentation of industrial float obtained from an effluent treatment plant for pig and poultry slaughterhouses. A Central Composite Design (CCD) was used to evaluate the experimental parameters, which were the level of aeration, agita-tion speed, and initial inoculum concentraagita-tion. The
optimization of the operating conditions was per-formed using the response surface technique ob-tained from the results of the CCD.
MATERIAL AND METHODS
Microorganisms
The strain Pseudomonas aeruginosa ATCC 10145, obtained from Culture Collection's Tropical André Tosello Foundation, Campinas-SP, Brazil, was used in this study.
Culture Medium for Maintenance of Strains and Growth Conditions
The bacterial cultures were grown in inclined test tubes with a nutrient agar medium containing 20.0 g/L sucrose, 3.0 g/L meat extract, 5.0 g/L bacteriological meat peptone, and 20.0 g/L bacteriological agar. This medium was adjusted to pH 7 and sterilized at 121 °C for 15 min.
The growth medium (inoculum) was prepared ac-cording to Lima et al. (2007) and Santos et al. (2002) and contained 10.0 g/L glucose, 11.0 g/L brewery residual yeast, 5.7 g/L NH4NO3, 0.2 g/L MgSO4.7H2O, 7.0 g/L Na2HPO4, and 3.0 g/L KH2PO4. The medium containing the inoculum was adjusted to pH 7 and sterilized at 121 °C for 15 min.
The fermentation medium used for biosurfactant production was prepared according to Lima et al. (2007) and contained 0.2 g/L MgSO4.7H2O, 7.0 g/L Na2HPO4, and 3.0 g/L KH2PO4. The concentrations (in g/L) selected for the fat, ammonium nitrate and residual brewery yeast were 12, 0 and 15, respectively, according to Borges et al. (2012).
Characterization of Industrial Float from the Slaughterhouse
In the preliminary tests, the fat percentage and ni-trogen concentration of the industrial float from the slaughterhouse was determined. The Bligh-Dyer method, presented by Cecchi (1999), was used to de-termine the fat percentage and the total nitrogen con-centration was determined by the Kjeldahl method, according to Apha et al. (1998).
Bioreactor and Statistical Analyses
total volume of 2.0 L and a working volume of 1.5 L. The bioreactor was composed of a mechanical shaker to control agitation, an aeration flow meter to control dissolved oxygen and a cooling jacket with a water inlet to maintain the temperature at 30 ± 0.5 °C during the 48-hour fermentation period, as reported by Lima et al. (2009).
A Central Composite Design (CCD) was used to maximize the production of the biosurfactant by selecting operating conditions for the aeration levels (X1), agitation (X2) and microorganism inoculum concentration (X3). This CCD was performed for a total of 15 experiments – three replicates at the cen-tral point, six experiments at the cencen-tral point, and six experiments at the orthogonal (α) of 1.3533. In this CCD, the aeration level ranged from 0.03 to 1.37 vvm, agitation from 94 to 906 rpm and inoculum concentration from 0.32 to 1.68 g/L. All the experi-ments were performed in duplicate, for a total of 34 experiments.
The Central Composite Design is needed to opti-mize the process, to develop formulations within the established parameters and to evaluate the effects and impacts that factors have in relation to the de-sired response. Proper planning and use of the scien-tific method enabled the reliable completion of the experiments. These steps should be followed during experimental analyses: the completion of the plan-ning and statistical analysis of the data (Rodrigues and Iemma, 2005). This methodology of planning experiments coupled to an analysis of the response surfaces allows us to statistically verify the individual effects and interactions between variables and to evaluate the experimental errors and the empirical equation results (Box et al., 1978).
The response surface technique is a set of statistical techniques used to model processes where these responses are influenced by input factors, which are the independent variables. This method is based on a full factorial design over a schedule with replicas at the midpoint. In planning, the input variables are coded (Lopera et al., 2012).
All the studied variables were made dimensionless (coded) using Equation (1),
(
0)
n
1 1
X X
X
X X
2
+ −
− =
−
⎡ ⎤
⎢ ⎥
⎣ ⎦
(1)
whereX is the coded value of the variable (n = 1, n 2...), X is the value of the variable to be calculated,
0
X is the value of the variable at the central point,
1
X+ is the value of the variable at the top level, and
1
X− is the value of the variable at the lower level.
Statistical calculations were performed using Sta-tistica 7.1 software (StatSoft, Inc.; Tulsa, Oklahoma, USA), and the responses were maximized using the surface response technique together with an algo-rithm implemented in Maple 9.5 (Cybernet Systems Co, Japan).
After maximizing the results using the CCD, the best conditions for biosurfactant production, with respect to rhamnose concentration, surface tension and the emulsifying index, were determined in this experimental work.
Kinetics of Rhamnose Production in Optimized Conditions
Kinetics were investigated when the conditions (aeration level, agitation speed, and inoculum con-centration) reached the optimal point, as determined by the CCD. The fermentation medium used for biosurfactant production is described above. The reaction kinetics were monitored every 6 hours for a total period of 78 hours. The medium was contained in a reactor with a 1.5 L working volume, and 5 to 30 mL samples were taken from the reactor at 0, 6, 12, 18 and 24 hours. Two additional brews were tested in the same reactor and under the same conditions. Aliquots were fermented for 24, 30, 36, 42 and 48 hours and then again for 48, 54, 60, 72 and 78 hours, respectively.
Analytical Procedures
The rhamnose concentration was determined according to the method described by Rahman et al. (2002).
The surface tension was determined using a pre-viously calibrated tensiometer (Fisher Scientific Co., model 21 Tensiomat, Hanover Park, Illinois, USA). Centrifugation was performed on 30 mL samples of fermented medium in a Beckman Coulter centrifuge (Model Avanti J-25, Beckman Coulter do Brasil, Santana de Parnaíba- SP – Brasil.) at 12500 rpm (cor-responding to a relative centrifugal field of 18900 x g) at 25 °C for 20 minutes to sediment the cells. The su-pernatant was removed, and aliquots of approxi-mately 10 mL were placed in petri dishes and ana-lyzed in the tensiometer. The tensiometer was used with a platinum-iridium ring 2 cm in diameter and 6.0 cm in height. The ring was immersed in each of the three Petri dishes that contained the samples, and the results are expressed as the mean value of these readings.
RESULTS AND DISCUSSION
Characterization of Greasy Wastewater
The concentration of fat in the greasy effluent was 19.48 ± 1.5%, and the residue had 0.2 ± 0.02 g/L of nitrogen.
Central Composite Design (CCD) for the Operating Conditions: Aeration Level, Agitation Speed and Inoculum Concentration
The results obtained from the CCD for aeration level (X1), agitation speed (X2), inoculum concentra-tion (X3), rhamnose concentraconcentra-tion (RM), surface tension (ST), and emulsifying index (EI) are shown in Table 1.
Table 1: Results of rhamnose production, surface tension and emulsifying index with respect to the operating conditions – level of aeration, agitation speed and inoculum concentration.
Exp. Aeration (vvm)
Agit. (rpm)
Inoc. (g/L)
RM (g/L)
ST (dyne/cm)
EI (%)
1 0.2 (-1) 200 (-1) 0.5 (-1) 0.91 31.8 67.5 2 0.2 (-1) 200 (-1) 1.5 (+1) 0.97 32.1 72.2 3 0.2 (-1) 800 (+1) 0.5 (-1) 1.85 30.3 84.2 4 0.2 (-1) 800 (+1) 1.5 (+1) 2.17 29.3 89.4 5 1.2 (+1) 200 (-1) 0.5 (-1) 2.15 29.9 86.0 6 1.2 (+1) 200 (-1) 1.5 (+1) 2.72 29.1 90.0 7 1.2 (+1) 800 (+1) 0.5 (-1) 4.29 26.3 100.0 8 1.2 (+1) 800 (+1) 1.5 (+1) 5.57 25.3 100.0 9 0.03 (-α) 500 (0) 1 (0) 1.66 30.4 75.3 10 1.37 (+α) 500 (0) 1 (0) 4.12 26.5 100.0
11 0.7 (0) 94 (-α) 1 (0) 1.37 30.7 75.3
12 0.7 (0) 906 (+α) 1 (0) 3.49 27.7 99.0 13 0.7 (0) 500 (0) 0.32 (-α) 2.46 29.2 93.0 14 0.7 (0) 500 (0) 1.68 (+α) 3.35 27.2 100.0 15 0.7 (0) 500 (0) 1 (0) 3.95 27.8 100.0 16 0.7 (0) 500 (0) 1 (0) 3.91 27.3 99.0 17 0.7 (0) 500 (0) 1 (0) 3.93 27.2 100.0 Agit. – agitation speed; Inoc. – inoculum concentration; RM – rhamnose concentration; ST – surface tension; EI – emulsifying index.
Analysis of the CCD
To analyze the data presented in Table 1, a 5% re-jection probability for the null hypothesis in Stu-dent’s t-test was used for the following independent variables: rhamnose concentration, surface tension and emulsifying index.
Equations (2), (3) and (4) describe the empirical models adjusted for rhamnose concentration, surface tension and emulsifying index, respectively, with respect to the tested variables. For these equations, the determination coefficients (R2) were 0.96, 0.97 and 0.98 for rhamnose concentration, surface tension and emulsifying index, respectively. These results indicate that 96%, 97% and 98% of the experimental
data fit the models presented in Equations (2), (3) and (4), respectively.
1 2 3
1 1 2 2
3 3 1 2
Rhamnose 3.748 1.041X 0.857X 0.295X
–0.345X X – 0.596X X
–0.335X X 0.355X X
= + + +
+
(2)
1 2
3 1 1
2 2 3 3
1 2
Surface tension 27.466 – 1.559X – 1.351X
–0.446X 0.514X X
0.924X X 0.378X X
–0.388X X
=
+
+ + (3)
1 2
3 1 1
2 2
Emulsifying index 98.411 8.236X 7.711X
2.013X – 5.955X X
–6.228X X
= + +
+ (4)
The positive values for the coefficients of X1, X2 and X3 in Equations (2) and (4) and the negative values for these coefficients in Equation (3) indicate that, when the fermentation is performed at higher values of aeration, agitation speed and inoculum con-centration, the rhamnose production and the emul-sifying index increase, whereas the surface tension decreases. This result is illustrated by comparing experiments 1 and 8 listed in Table 1.
used soybean oil as the substrate and Pseudomonas aeruginosa MR01 and produced 5.5 g/L rhamnolipid in a 48-hour period.
The optimized rhamnose concentration of 5.26 g/L can be compared to the results reported by Wu et al. (2007), who produced 7.5 g/L rhamnolipid using Pseudomonas aeruginosa EM1, glucose and glycerol as substrates and an agitation speed of 200 rpm. Santos et al. (2002) reported producing a large amount of rhamnolipids when working with high values of a mixture of glycerol and vegetable oils, reaching up to 7.4 g/L rhamnolipids using Pseudomonas aeruginosa PA1.
To optimize the results generated by the Maple 9.5 algorithm, the best conditions for the minimiza-tion of the surface tension occurred at the following operating conditions: level of aeration = 1.8 vvm, agi-tation speed = 897 rpm and inoculum concentration = 7 g/L. The experiment resulted in a surface tension of 25.8 dyne/cm, a rhamnose concentration of 5.35 g/L and an emulsifying index of 95%. The surface ten-sion value of 25.8 dyne/cm characterizes a more efficient rhamnolipid than a surfactant with a surface tension of 26.5 dyne/cm, which was the surface ten-sion of a biosurfactant produced by Wu et al. (2007) from glucose and glycerol using Pseudomonas aerugi-nosa EM1 at 200 rpm.
The optimal conditions for rhamnose concentra-tion, surface tension and emulsifying index were 5.25 g/L, 25.3 dyne/cm and 90%, respectively, and these conditions are consistent with the results ob-tained from the models presented in Equations (2), (3) and (4). According to Reiser et al. (1993), the mini-mum value for surface tension is in the range of 25 to 28 dyne/cm.
Yin et al. (2009) reported that a reduction in sur-face tension from 72 dyne/cm to 33.9 dyne/cm oc-curred for biosurfactant production by Pseudomonas aeruginosa S6 in wastewater containing oil. A de-crease in surface tension was also reported by Nawawi et al. (2010), who studied biosurfactant production from palm oil with 21% to 25% fatty acids by fer-mentation at 180 rpm and 30 °C in a mixed culture of micro-organisms. The surface tension of the initial production medium was 54.5 mN/m before inocula-tion. A decrease in surface tension, which had a mini-mum value of 30.1 mN/m, was actually coupled with microbial growth.
With a subroutine added to the program in the Maple 9.5 software, the emulsifying index was maxi-mized at 100% for a level of aeration of 1.0 vvm, an agitation speed of 661 rpm and an inoculum concen-tration of 1.3 g/L. Experiments conducted under these conditions resulted in an emulsifying index of 100%,
a rhamnose concentration of 4.91 g/L and a surface tension of 26.5 dyne/cm. When the coded values (X1, X2 and X3) for this condition were substituted into the model equations for rhamnose concentration (Equation (2)), surface tension (Equation (3)) and the emulsifying index (Equation (4)), the results were 4.71 g/L, 26.0 dyne/cm and 100%, respectively. These model results show good agreement with the experi-mental results. High emulsifying index values were also reported by Barros et al. (2007), who obtained an 80% emulsifying index for a biosurfactant pro-duced by a bacterial strain of Bacillus that was grown in manipueira.
Oliveira et al. (2009) studied the emulsification potential of a biosurfactant produced by Rhodococ-cus sp. with various hydrocarbons as carbon sources (substrate). The biosurfactant showed an emulsifying index of up to 90% when palm oil was used as a substrate. The authors reported that the emulsifying index of a biosurfactant depends on the direct inter-action of the hydrophobic portion of the biosurfac-tant with the substrates (hydrocarbons).
Figures 1, 2 and 3 show the contour curves for rhamnose concentration, surface tension and emulsi-fying index for the studied operating variables. These curves allow us to simultaneously evaluate the best working range for the studied responses.
From Figure 1, the maximum rhamnose concen-tration occurs when the aeration level is from 1.2 vvm to 2.4 vvm and the agitation speed is from 600 to 1200 rpm. This range corresponds to a rhamnose concentration of 4.91 g/L on the contour curve. Within this range the surface tension is 25.7 dyne/cm when the aeration level is from 1.2 to 2 vvm and the agita-tion speed is between 600 and 1000 rpm. The emul-sifying index is 100% when the aeration is from 0.8 to 1.4 vvm and the agitation is from 550 to 850 rpm. According to Cooper and Zajic (1980), surfactants are compounds with a surface tension below 40 dyne/cm; therefore, the effectiveness of a biosurfac-tant with a surface tension below 35 dyne/cm must be proven.
Figure 2 shows that the maximum rhamnose con-centration and the minimum surface tension values occur when the level of aeration is from 1.2 to 2 vvm and the inoculum concentration is from 1 to 1.5 g/L. This track has a rhamnose concentration of 5.33 g/L and surface tension of 25.3 dyne/cm. The charts for this dataset show that a 99% emulsifying index occurs when the inoculum concentration is greater than or equal to 1 g/L and the aeration is from 0.7 to 1.4 vvm.
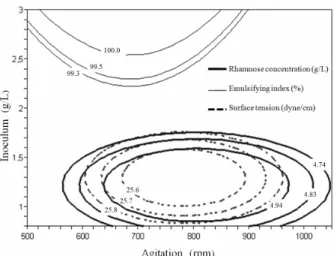
inoculum concentrations ranging from 0.6 to 1.6 g/L. By adopting a narrower range of agitation speed and inoculum concentration, a higher rhamnose concen-tration and lower emulsifying index can be obtained. As expected, the rhamnose concentration increased to 4.94 g/L and the surface tension decreased to 25.6 dyne/cm. A higher emulsifying index is favored when working with a higher inoculum concentration and agitating the broth from 500 to 900 rpm. The surface tension values for all the experiments in the CCD were less than or equal to 32.1 dyne/cm. These values are close to the minimum surface tension value of 28 dyne/cm found by Oliveira et al. (2009) for rhamnolipid production by a strain of Pseudomo-nas alcaligenes using palm oil as the carbon source.
Figure 1: Surface response and contour curves for the surface tension, emulsifying index and rhamnose concentration relative to the level of aeration and agitation speed.
Figure 2: Surface response and contour curves for the surface tension, emulsifying index and rhamnose concentration relative to the level of aeration and inoculum concentration.
Figure 3: Surface response and contour curves for the surface tension, emulsifying index and rhamnose concentration relative to the agitation speed and in-oculum concentration.
Table 2 summarizes the ranges of the variables (level of aeration, agitation speed and inoculums con-centration) that provided the best results according to the response surfaces (Figures 1, 2 and 3). This sum-mary helps facilitate a comparison of the data and to determine the most satisfactory condition according to a joint analysis of all the variables and responses.
Table 2: Best tracks for the operating conditions – level of aeration (X1), agitation speed (X2) and
in-oculum concentration (X3) – obtained from Figures
1, 2 and 3.
Responses studied X1 Aeration
(vvm)
X2
Agitation (rpm)
X3 Inoculum
(g/L) Fig. 1 1.2 – 2.4 600 - 1200 -
Fig. 2 1.2 – 2.0 - 1.0 – 1.5
Rhamnose
Fig. 3 - 600 - 1000 0.6 – 1.6
Fig. 1 1.2 – 2.0 600 - 1000 -
Fig. 2 1.2 – 2.0 - 1.0 – 1.5
Surface Tension
Fig. 3 - 600 - 1000 0.6 – 1.6
Fig. 1 0.8 – 1.4 500 - 850 -
Fig. 2 0.7 – 1.4 - ≥1.0
Emulsifying Index
Fig. 3 - 500 - 900 ≥2.2
The following conditions were selected within the range of process variables studied to optimize the minimum cost of biosurfactant production: a level of aeration of 1.2 vvm, an agitation speed of 600 rpm and an inoculum concentration of 1.0 g/L Pseudomo-nas aeruginosa. These conditions were selected to perform a kinetic study.
An agitation speed of 600 rpm was selected be-cause the effect of aeration was determined to be superior to the effect of agitation speed. Therefore, an agitation speed of 600 rpm could likely be se-lected (lower than the value of 800 rpm (+1)) at a level of aeration of 1.2 vvm and still produce good results for the responses studied.
Kinetic Study to Evaluate the Optimized Conditions of Aeration, Agitation and Inoculum Concentration
The kinetic study was conducted for a 1.2 vvm level of aeration, 600 rpm agitation speed and 1.0 g/L inoculum concentration. This condition was selected from the analysis of the response surfaces. For this condition, the experimentally determined rhamnose concentration, surface tension and emulsi-fying index were 5.37 g/L, 25.6 dyne/cm and 100%, respectively. The rhamnose concentration, surface tension and emulsifying index, as calculated from the models in Equations (2), (3) and (4) for the selected conditions, were 4.8 g/L, 25.6 dyne/cm and 100%, respectively.
The results show that the selected conditions met expectations because the values were near the high-est values determined during planning, as shown by the responses of experiment number 8 presented in Table 1 (1.2 vvm level of aeration, 800 rpm agitation speed and 1.5 g/L inoculum concentration). The data represent 48 hours of fermentation. This kinetic study shows the importance of analyzing the vari-ables since obtaining similar results was possible at a more economical agitation speed and a lower inocu-lum concentration.
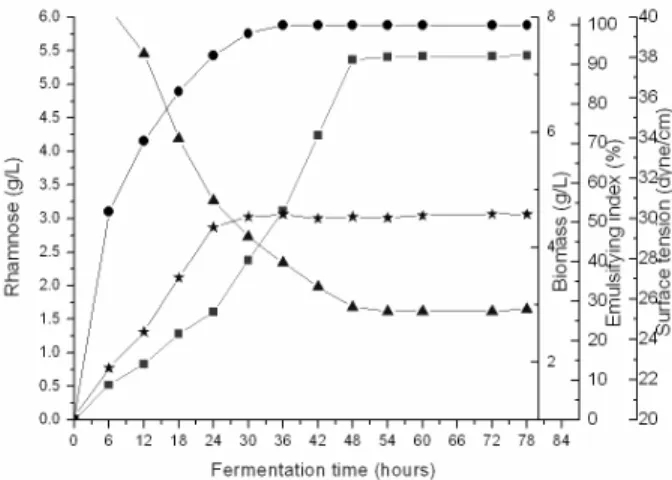
Figure 4 shows that cell growth occurred in the first 24 hours of fermentation and that the rhamnose concentration increased for up to 48 hours; therefore, cell growth is partly associated with biosurfactant production. The experiments were performed with the industrial float without the addition of nitrogen to the fermented medium. According to Santos et al. (2002), consumption of nitrogen influences the syn-thesis of the biosurfactant and can indirectly interfere with microbial growth. Several researchers have studied rhamnolipid synthesis in the early stationary phase of growth and by exhaustion of the nitrogen source (Ramana and Karanth, 1989; Guerra-Santos
et al., 1984; Mulligan and Gibbs, 1989). Significant increases in rhamnolipid production were observed in nitrogen-limited conditions (Ochsner and Reiser, 1995; Lang and Wullbrandt, 1999). Syldatk et al. (1985) showed that nitrogen limitation is responsible not only for the increase in biosurfactant production, but also for changing the composition of the biosur-factant produced. At 24 hours, the rhamnose concen-tration was only 1.61 g/L, whereas at 48 hours the concentration had increased to 5.37 g/L. This result shows that most of the rhamnolipid production oc-curred after the growth phase. These results for rham-nose concentration were higher than those previously reported in the literature (Lima et al. 2007; Lang and Wullbrandt, 1999; Lofabad et al., 2010; Oliveira et al., 2009; Nawawi et al., 2010).
Figure 4: Fermentation kinetics for the selected condi-tion in the region of optimizacondi-tion; the level of aeracondi-tion, agitation speed and inoculum concentration for the responses rhamnose concentration (■), surface tension (▲), emulsifying index (●) and biomass concentration in dry mass ( ); Fermentation at 30 ± 0.5 °C.
CONCLUSIONS
ACKNOWLEDGMENTS
The financial support of FAPEMIG (Research Support Foundation of the state of Minas Gerais), CNPq (National Counsel of Technological and Sci-entific Development) and CAPES–Brazil (Coordina-tion for the Improvement of Higher Educa(Coordina-tion Per-sonnel), Faculty of Chemical Engineering, Uber-lândia Federal University is gratefully acknowledged.
REFERENCES
Abalos, A., Viñas, M., Sabaté, J., Manresa, M. A. Solanas, A. M., Enhanced biodegradation of Casa-blanca crude oil by a microbial consortium in pres-ence of a rhamnolipid produced by Pseudomonas aeruginosa AT10. Biodegradation 15, Kluwer Academic Publishers, Netherlands, p. 249-260 (2004).
APHA, American Public Health Association, AWWA, American Water Works Association, WEF, Water Enviromment Federation. Standard Methods for the Examination of Water and Wastewater, 20 Ed. APHA, Washington, DC (1998).
Banat, I. M. Biosurfactants, more in demand than ever. Biofutur, 198(20), p. 44-47 (2000).
Barbosa, M. M. C., Paz, M. C. de F., Produção de Biossurfactantes por Chromobacterium viola-ceum utilizando como substrato óleo vegetal. II Congresso de Pesquisa e Inovação da Rede Norte Nordeste de Educação Tecnológica, 2, João Pessoa, PB, p. 1-9 (2007). (In Portuguese).
Barros, F. F. C., Quadros, C. P. de Marostica Júnior, M. R., Pastore, G. M., Surfactina: Propriedades químicas, tecnológicas e funcionais para aplica-ções em alimentos. Quím. Nova, [Online], 30(2), p. 409-414 (2007). (In Portuguese).
Benincasa, M., Accorsini, F. R., Pseudomonas aerugi-nosa LBI production as an integrated process using wastes from sunflower-oil refining as a substrate. Bioresource Technology, 99, p. 3843-3849 (2008).
Benincasa, M., Contiero, J., Manresa. M. A., Moraes, I. O., Rhamnolipid production by Pseudomonas aeruginosa LBI growing on soapstock as the sole carbon source. Journal of Food Engineering, 54 (4), p. 283-288 (2002).
Borges, W. da S., Cardoso, V. L., Resende, M. M. de, Use of a greasy effluent floater treatment station from the slaughterhouse for biosurfactant produc-tion. Biotechnology and Applied Biochemistry, 59(3), p. 238-244 (2012).
Box, G. E. P., Hunter, W. G., Hunter, J. S., Statistics for Experimenters: An Introduction to Design, Data
Analysis and Model Building. John Wiley, New York (1978).
Cecchi, H. M., Fundamentos Teóricos e Práticos em Análise de Alimentos. Faculdade de Engenharia de Alimentos da Unicamp, Editora da Unicamp, p. 212 (1999). (In Portuguese).
Cooper, D. G., Goldenberg, B. G., Surface-active agents from two Bacillus species. Applied and Environ-mental Microbiology, 53(2)p. 224-229 (1987). Cooper, D. G., Zajic, J. E., Surface-active
com-pounds from microorganism. Advances in Ap-plied Microbiology, v. 26, p. 229-252 (1980). Faria, S., Vieira, P. A., Resende, M. M., Ribeiro, E.
J., Cardoso, V. L., Application of a model using the phenomenological approach for prediction of growth and xanthan gum production with sugar cane broth in a batch process. LWT-Food Science and Technology, 43(3), p. 498-506 (2010). Gallert, C., Winter, J., Solid and liquid residues as
raw materials for biotechnology. Journal, Natur-wissenschaften, Springer, Heidelberg, 89(11), p. 483-496 (2002).
Guerra-Santos, L., Käppeli, O., Fiechter, A., Pseu-domonas aeruginosa biosurfactant production in continuous culture with glucose as carbon source. Applied and Environmental Microbiology, 48(2), p. 301-3005 (1984).
Kronemberger, F. de A., Produção de ramnolipídeos por Pseudomonas aeruginosa PA1 em biorreator com oxigenação por contactor de membranas. D.Sc. Thesis, Universidade Federal do Rio de Ja-neiro, p. 153 (2007). (In Portuguese).
Lang, S., Wullbrandt, D., Rhamnose lipid – biosyn-thesis, microbial production and application po-tential. Applied Microbiology and Biotechnology, 51, p. 22-32 (1999).
Lee, K. M., Hwang, S-H., Ha, S. D. Jang, J-H, Lim, D.-J., Kong, J.-Y., Rhamnolipid production in bath and fed-bath fermentation using Pseudomo-nas aeruginosa BYK-2 KCTC 18012P. Biotech-nology and Bioprocess Engineering, 9(4), p. 267-273 (2004).
Lima, C. J. B., de França, F. P., Sérvulo, E. F. C., Resende, M. M., Cardoso, V. L., Enhancement of rhamnolipid production in residual soybean oil by an isolated strain of Pseudomonas aeruginosa. Applied Biochemistry and Biotechnology, v. 136-140(1-12), 463-470 (2007).
Lima, C. J. B., Ribeiro, E. J., Sérvulo, E. F. C., Resende, M. M., Cardoso, V. L., Biosurfactante production by Pseudomonas aeruginosa grown in residual soybean oil. Applied Biochemistry and Biotechnology, 152(1), p. 156-168 (2009).
G., Vali, H., Noghabi, K. A., Structural charac-terization of a rhamnolipid-type biosurfactant produced by Pseudomonas aeruginosa MR01: Enhancement of di-rhamnolipid proportion using gamma irradiation. Colloids and Surfaces B: Bio-interfaces, 81(2), p. 397-405 (2010).
Lopera, J. E. P., Alfaro, S. C. A., Motta, J. M. S. T., Modelagem empírica da transferência goticular projetada em processos de soldagem GMAW. Sol-dagem & Inspeção, 17(4), p. 335-346 (2012). (In Portuguese).
Moussa, T. A. A., Mohamed, M. S. and Samak, N., Production and characterization of di-rhamnolipid produced by Pseudomonas aeruginosa TMN. Brazilian Journal of Chemical Engineering, 31(4), p. 867-880 (2014).
Mulligan, C. N., Environment applications for bio-surfactants. Environmental Polluition, 133(2), p. 183-198 (2005).
Mulligan, C. N., Mahmourides, G., Gibbs, B. F., Biosurfactant production by a chloramphenicol tolerant strain of Pseudomonas aeruginosa. Jour-nal of Biotechnology, 12(1), p. 37-44 (1989). Nawawi, W. M. F. W., Jamal, P., Alam, Md. Z.,
Utilization of sludge palm oil as a novel substrate for biosurfactant production. Bioresource Techno-logy, 101(23), p. 9241-9247 (2010).
Nitschke, M., Pastore, G. M., Biossurfactantes: Pro-priedades e Aplicações. Revista Química Nova, 25(5), p. 772-776 (2002). (In Portuguese).
Ochsner, U. A., Reiser, J., Autoinducer-mediated regulation of rhamnolipid biosurfactant synthesis in Pseudomonas aeruginosa. Proc. Natl. Acad. Sci. USA, 92, p. 6424-6428 (1995).
Oliveira, F. J. S., Vazquez, L., de Campos, N. P., de França, F. P., Production of rhamnolipids by a Pseudomonas alcaligenes strain. Process Bioche-mistry, 44(4), p. 383-389 (2009).
Pirôllo, M. P. S., Estudo da produção de biossur-factantes utilizando hidrocarbonetos. Dissertação de Mestrado, Instituto de Biociências, Universi-dade Estadual Paulista Júlio de Mesquita Filho, p. 61 (2006). (In Portuguese).
Rahman, K. S. M. P., Banat, I. M., Thahira, J., Thayumanavan, T., Lakshmanaperumalsamy. P., Bioremediation of gasoline contaminated soil by a bacterial consortium amended with poultry litter, coir pith and rhamnolipid biosurfactant. Biore-source Technology, 81(1), p. 25-32 (2002). Rahman, K. S. M. P., Gakpe, E., Production,
charac-terization and applications of biosurfactants –
Re-view. Asian Network for Scientific Information, Pakistan, Biotechnology, 7(2), p. 360-370 (2008). Ramana, K. V., Karanth, N. G., Factors affecting
biosurfactant production using Pseudomonas aeruginosa CFTR-6 under submerged conditions. Journal of Chemical Technology and Biotechnol-ogy, 45(4), p. 249-257 (1989).
Reiser, J., Koch, A. K., Ochsner, U. A. and Fiechter, A., Biosurfactants: Production, Properties, Appli-cation, In: N. Kosaric (Ed.), p. 231-249, Marcel Dekker, INC, NY (1993).
Rodrigues, M. I., Iemma, A. F., Planejamento de Expe-rimentos e Otimização de Processos: uma Estratégia Sequencial de Planejamentos. Casa do Pão Editora, 1ª, Ed. Campinas-SP (2005). (In Portuguese). Santa Anna, L. M., Soriano, A. U., Gomes, A. C.,
Menezes, E. P., Gutarra, M. L. E., Freire, D. M. G., Pereira Jr. N., Use of biosurfactant in the re-moval of oil from contaminated sandy soil. Jour-nal of Chemical Technology and Biotechnology, 82(7), p. 687-691 (2007).
Santos, A. S., Sampaio, A. P. W., Vasquez, G. S., Santa Anna, L. M., Pereira Jr. N., Freire, D. M. G., Evaluation of different carbon in nitrogen sources in production of rhamnolipids by a strain Pseudomonas aeruginosa. Applied Biochemistry and Biotechnology, v. 98-100, p. 1025-1035 (2002). Syldatk, C., Lang, S., Wagner, F., Chemical and
physical characterization of four interfacial-active rhamnolipids from Pseudomonas sp. DSM 2874 grown on n-alkanes. Zeitschrift für Naturforsch C, 40, p. 51-60 (1985).
Tuleva, B. K., Ivanov, G. R., Christova, N. E., Biosurfactant production by a new Pseudomonas putida strain. Zeitschrift für Naturforsch C, 57, p. 356-360 (2002).
Wu, J.-Y., Yeh K-L., Lu W-B., Lin C-L., Chang J-S., Rhamnolipid production with indigenous Pseudo-monas aeruginosa EM1 isolated from oil-con-taminated site. Bioresource Technology, 99(5), p. 1157-1164 (2007).
Yin, H., Qiang, J., Jia, Y., Ye, J., Peng, H., Qin, H., Zhang, N., He, B., Characteristics of biosurfac-tant produced by Pseudomonas aeruginosa S6 isolated from oil-containing wastewater. Process Biochemistry, 44(3), p. 302-308 (2009).