Reaction intermediates of ethanol electro-oxidation on platinum
investigated by SFG spectroscopy
Janaina F. Gomes
a, Kleber Bergamaski
b,1, Melissa F.S. Pinto
b,2, Paulo B. Miranda
b,⇑ aInstituto de Química de São Carlos, Universidade de São Paulo, C.P. 780, São Carlos, SP 13560-970, BrazilbInstituto de Física de São Carlos, Universidade de São Paulo, C.P. 369, São Carlos, SP 13560-970, Brazil
a r t i c l e
i n f o
Article history:
Received 16 November 2012 Revised 25 February 2013 Accepted 27 February 2013 Available online 9 April 2013
Keywords: SFG spectroscopy DFT
Electro-oxidation Ethanol Platinum
Adsorbed intermediates
a b s t r a c t
Although electrochemical oxidation of simple organic molecules on metal catalysts is the basic ingredient of fuel cells, which have great technological potential as a renewable source of electrical energy, the detailed reaction mechanisms are in most cases not completely understood. Here, we investigate the eth-anol–platinum interface in acidic aqueous solution using infrared–visible sum frequency generation (SFG) spectroscopy and theoretical calculations of vibrational spectra in order to identify the intermedi-ates present during the electro-oxidation of ethanol. The complex vibrational spectrum in the fingerprint region imply on the coexistence of several adsorbates. Based on spectra in ultra-high-vacuum (UHV) and electrochemical environment from the literature and our density functional theory (DFT) calculations of vibrational spectra, new adsorbed intermediates, never before observed with conventional infrared (IR) spectroscopy, are proposed here:g2-acetaldehyde,
g2-acetyl, ethylidyne, monodentate acetate, methoxy,
tertiary methanol derivative, COH residue,g2-formaldehyde, mono and bidentate formate, CH 3and CH2
residues. In addition, we present new evidences for an ethoxy intermediate, a secondary ethanol deriv-ative and an acetyl species, and we confirm the presence of previously observed adsorbates: a tertiary ethanol derivative, bidentate acetate, and COad. These results indicate that the platinum surface is much
more reactive, and the reaction mechanism for ethanol electro-oxidation is considerably more complex than previously considered. This might be also true for many other molecule-catalyst systems.
Ó2013 Elsevier Inc. All rights reserved.
1. Introduction
Electrochemical oxidation of simple organic molecules on metal catalysts is at the heart of fuel cells, which have great technological potential as a renewable source of electrical energy. Direct alcohol fuel cells, especially those using ethanol as a fuel, are becoming a very attractive alternative energy source for fossil fuels due to sev-eral advantages: (i) easier and safer transportation and storage of liquid fuels when compared to gases; (ii) the theoretical mass en-ergy density of alcohols such as methanol and ethanol is high and comparable to gasoline[1,2], and the thermodynamic efficiency of fuel cells is much higher than internal combustion engines; (iii) ethanol can be mass-produced by renewable sources, is less pollu-tant than fossil fuels, and can share the available gasoline distribu-tion infrastructure [3]; (iv) ethanol is a good candidate for polymeric electrolyte membrane fuel cell (PEMFC) due to its low
permeability through polymeric membranes and also for leaving less toxic by-products [2]. However, before they become widely available, a few technological issues need to be overcome. In regard to the electrochemical reaction, the main problems that need to be addressed are the high overpotential for the oxidation reaction due to the presence of poisoning adsorbed intermediates at low poten-tials and the formation of partially oxidized products. The solution to them necessarily demands a thorough understanding of the de-tailed reaction mechanisms, which are in most cases not com-pletely understood. Therefore, the possible application of ethanol as a fuel for direct alcohol fuel cells continues to motivate research aimed at developing a mechanistic understanding of the electro-oxidation of ethanol.
Fundamental studies of ethanol electro-oxidation in acid media were mostly performed on platinum and its alloys[4–8]. Among various Pt-based binary catalysts, PtASn has been reported as the most effective for the electro-oxidation of ethanol[4,9]. Palladium has been studied less actively in acid media due its relatively low performance. On the other hand, in alkaline media, palladium ap-pears to be quite active for ethanol oxidation[10]. Palladium-based alloys in alkaline media have also received significant attention [11], even though the ethanol oxidation on a pure palladium elec-trode has not yet been fully understood.
0021-9517/$ - see front matterÓ2013 Elsevier Inc. All rights reserved. http://dx.doi.org/10.1016/j.jcat.2013.02.024
⇑ Corresponding author.
E-mail address:[email protected](P.B. Miranda).
1 Current address: Departamento de Química, Universidade Federal de Sergipe,
Rod. Marechal Randon, s/n, São Cristóvão, SE 49100-000, Brazil.
2 Current address: Departamento de Física – ICEB, Universidade Federal de Ouro
Preto, Campus Morro do Cruzeiro, Ouro Preto, MG 35400-000, Brazil.
Contents lists available atSciVerse ScienceDirect
Journal of Catalysis
Concerning the ethanol oxidation on Pt electrodes, although it is well-known that it follows parallel reaction pathways leading to acetaldehyde, acetic acid and CO2[9,12–15], the mechanism of this
reaction remains unclear. There is not yet a consensus concerning the adsorbed intermediates that lead to the formation of these products. From Differential Electrochemical Mass Spectrometry (DEMS) investigations, it was concluded that the CO2can originate
from either the alcohol or the methyl groups of the ethanol[12,16]. However, the available data related to the dissociation of the CAC bond are contradictory. On one hand, Willsau and Heitbaum[12] suggested that the adsorbed intermediate contains the intact CAC bond of ethanol. On the other hand, Bittinscattaneo et al. [16] proposed that the ethanol adsorbs mainly dissociatively in form of one carbon atom species. In 1994, the Fourier Transform Infrared (FTIR) and DEMS results published by Iwasita and Pastor [17]showed that the presence of an acetyl residue could not be discarded. This partially agrees with the idea of Willsau and Heit-baum[12]. Nevertheless, it was demonstrated that the acetyl was not the only adsorbed species formed [17]. Adsorbed CO was clearly evident. In addition, it was proposed that the secondary alcohol derivative (PtACHOHACH3) could be the precursor for
the formation of the adsorbed CO via an acetyl species. However, no direct evidence of the
m
(CAOH) band of a secondary alcohol [18]was observed in that work[17]. Based on Electrochemically Modulated Infrared Reflectance Spectroscopy (EMIRS), different models for the adsorbed species were discussed, including the adsorption of an ethoxy species[19]. Acetaldehyde[20], acetic acid [21], and acetyl[22]were also proposed as adsorbed intermediates of ethanol oxidation.Undoubtedly, the studies described above have contributed enormously to the elucidation of the complex mechanism of the ethanol oxidation on platinum. However, it is important to empha-size that in all these studies, the electro-oxidation of ethanol was investigated by linear spectroscopic techniques. The disadvantage of using this kind of spectroscopic probe is that it is impossible to completely discriminate features from adsorbates and contribu-tions from bulk species. Eliminating the contribution from the bulk is critical when the adsorbed intermediates and the bulk products contain the same functional groups, as for the partially oxidized products acetaldehyde and acetic acid. In such cases, it is difficult to differentiate between bulk and adsorbed species and hence dif-ficult to make unambiguous identifications of adsorbed intermedi-ates. Sum-Frequency Generation (SFG) spectroscopy can be used as a powerful tool to obtain vibrational spectra of adsorbed species without contribution from the bulk [23,24]. Since SFG is a sec-ond-order non-linear optical process that occurs only at media where the inversion symmetry is broken, it is allowed only at the interface between two centrosymmetric materials, making it pos-sible to detect adsorbed species without any contribution from the bulk. Because of this major advantage, SFG spectroscopy has al-ready been used by several groups to investigate the electrochem-ical interface, notably on Pt electrodes. However, these studies are usually limited to vibrations with high dipole moment and polariz-ability derivatives, such as adsorbed CO or CN[25–32]. One excep-tion is the formaexcep-tion of PtAOH detected by SFG spectroscopy[33]. Very recently, Kutz et al.[34]have investigated ethanol electro-oxidation on polycrystalline Pt using SFG spectroscopy. They only detect adsorbed CO and acetate ions (and (bi)sulfate ions, for the case of sulfuric acid supporting electrolyte). Furthermore, using
13C-labeled ethanol, they demonstrate the cleavage of the C
AC bond upon electrochemical adsorption. It should be also men-tioned the very recent SFG study by Braunschweig et al.[35]of ace-tic acid electrochemical adsorption onto Pt and Au electrodes, where they also found adsorbed acetate ions, as in Ref. [34]. Although these studies have further advanced our understanding of the electro-oxidation of simple molecules on Pt electrodes, the
detection and identification of other species, including those previ-ously suggested by IR spectroscopy, is still lacking.
In this work, we will present the first SFG spectra of ethanol in acidic medium at a polycrystalline platinum surface over a wide spectral range (1000–3300 cm1). The main purpose of the present
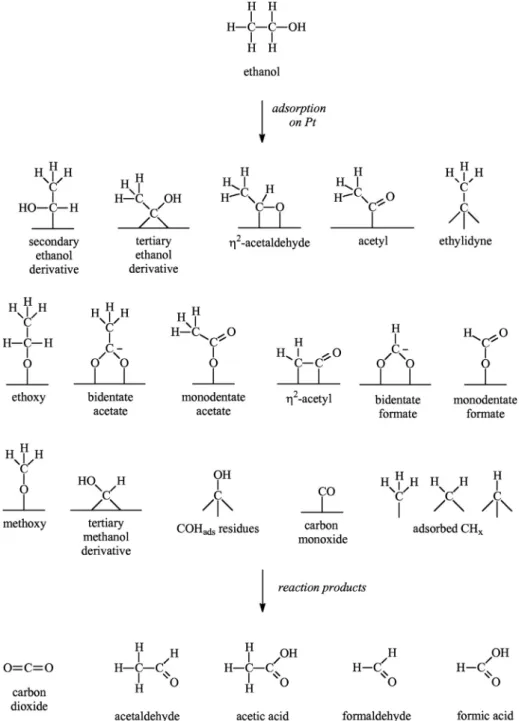
work is to identify adsorbed intermediates of the ethanol oxidation on Pt using SFG spectroscopy and DFT calculations of their vibra-tional spectra. In contrast to previous SFG experiments, our results indicate the coexistence of several adsorbates. In addition to pre-senting new evidences for previously suggested intermediates and confirming the presence of adsorbates already observed by IR and SFG spectroscopies, we identify new adsorbed intermedi-ates. As an aid to the reader,Fig. 9(at the end of Section3.4) dis-plays the structure of potential adsorbates that will be discussed in the text.
2. Methodology
2.1. Experimental section
Similar to previous work[25,28], the SFG experiments were performed in a three electrode spectro-electrochemical cell with an IR and visible transparent 2 mm CaF2window attached to the
top of the cell. The working electrode was a polished polycrystal-line platinum disk 12 mm in diameter. A platinized platinum wire and a reversible hydrogen electrode were used as the counter and reference electrodes, respectively. A movable piston supports the working electrode. A platinum wire connected to the working elec-trode passes through the piston and keeps the electric contact. Be-fore each experiment, the working electrode was annealed in a H2
flame for approximately 15 min, cooled to room temperature in an inert N2 atmosphere and then protected with a drop of water to
prevent contamination before being transferred to the spectro-electrochemical cell. The working electrode was introduced at open circuit potential to the spectro-electrochemical cell contain-ing 0.1 M ethanol and 0.5 M HClO4and subsequently polarized at
0.05 V. SFG spectra were taken in the region between 1000 cm1
and 3300 cm1, at potentials increasing from 0.05 V to 1.1 V vs.
RHE (0.05 V steps), waiting about 1 min after setting each poten-tial. The complete range of wavenumbers was scanned in four dif-ferent experiments. During the acquisition of the SFG spectra, the working electrode was pressed against the CaF2window to obtain
a thin liquid film in order to minimize the absorption of the infra-red beam by the electrolytic solution. The maximum attenuation of the reflected IR beam in the spectral range from 1000 to 2100 cm1
occurs at 1650 cm1, and it varied from 60% to 90% (crossing the
liquid film twice), which corresponds to a single pass attenuation of37–68%. The SFG spectra were not corrected for this effect. From these measurements, the thickness of the thin electrolyte layer is estimated to be 2.65 ± 0.75
l
m. However, the stronger IR absorption of water in the OH stretch range attenuated most of the IR energy, making the SFG spectra unreliable above 3200 cm1 (or between 2350 cm1 and 2700 cm1, forexperi-ments with deuterated water). From 1250 cm1 to 1000 cm1,
the IR transmittance decreases from 95% to 60% due to bulk IR absorption of the 2 mm CaF2window. Our results were also not
corrected for this effect.
The SFG spectrometer (Ekspla, Lithuania) consists of a flash-lamp-pumped Nd+3:YAG laser that generates 25 ps pulses at
1064 nm with a repetition rate of 20 Hz. A 532 nm beam is pro-duced by second harmonic generation (SHG) and a tunable IR beam (2.5–10
l
m, bandwidth3 cm1) is produced by an opticalon the sample and SFG signal detection) was optimized on a refer-ence sample of intense nonresonant signal (quartz or ZnS), which was then replaced by the sample of interest. The p-polarized 532 nm and IR beams overlapped temporally and spatially on the sample with spot sizes and angles of incidence of1.0 mm and
0.5 mm, and 61°and 55°, respectively. The p-polarized SFG signal of the platinum–solution interface was normalized to the IR pulse energy, which was monitored before reaching the sample and re-corded simultaneously with data acquisition. Each data point in the SFG spectrum is an average of 125 shots. The energies of visible and IR pulses were about 40
l
J and 50l
J, respectively.2.2. Theoretical section
We have used the density functional theory (DFT) approach to perform calculations of vibrational spectra to support peak assign-ments of the experimental SFG spectra. For that purpose, we have compared the calculated vibrational spectra of several potential intermediates adsorbed on a Pt cluster to the observed SFG reso-nances. This demanded a high accuracy in the calculation of vibra-tional frequencies, since the SFG peaks were quite closely spaced (20–50 cm1). The Pt cluster was constructed using the
crystallo-graphic data reported by Waseda et al.[36]for FCC platinum with space group Fm-3m, with cell parametersa=b=c= 392.42 pm and
a
=b=c
= 90°. In this configuration, the distance between the Ptatoms is 277.5 pm [36]. The cluster was arranged to model the Pt(1 1 1) surface, with the first layer consisting of ten platinum atoms and the second layer having six platinum atoms, as shown
in Fig. 1. The third layer was discarded because it has minimal
influence on properties under study, as well as to minimize the computational effort in electronic structure calculations. The plat-inum cluster was maintained fixed and we carried out fully relaxed geometry optimizations of the ethanol-derived adsorbates, which were attached to the central Pt atom of the first layer. Calculations also showed that, within the extent and arrangement of our Pt(1 1 1) model, the position of a second bond for bidentate adsor-bate has minimal effect on spectroscopic assignments.
The potential adsorbates investigated were the following: CO, secondary and tertiary ethanol derivative, acetyl, bidentate acetate, ethoxy and
g
2-acetaldehyde. The interactions between thesederivatives of ethanol and the Pt(1 1 1) model surface have been studied using density functional theory (DFT) approach, with the hybrid functional B3LYP associated with effective core potential (ECP) type basis set[37], using the GAUSSIAN 03 program[38]. In the B3LYP hybrid functional scheme, the nonlocal Hartree–Fock (HF) approach is mixed into the energy functional of the general-ized gradient approximation (GGA), in which are included three parameters of Becke[39–41]for exchange energy estimation and the Lee–Yang–Parr correlation energy[42]. The Lan2DZ basis in-cludes Dunning–Huzinaga full double zeta (DZ) basis functions for the first row and Los Alamos effective core potentials (ECPs)
for heavy elements. This basis was chosen for this study because it incorporates relativistic effects for Pt (and other heavy metals), thus describing more efficiently their properties, and it is also com-patible with the elements of ethanol derivatives (H, C, O). In addi-tion, reports in the literature on platinum complexes using B3LYP/ LanL2DZ level showed that it is able to reproduce with satisfactory agreement spectroscopic experimental data[43–46].
Infrared and Raman spectra calculations were carried out for all simulated adsorbates, since the SFG selection rules require that the vibrational modes must be active in both spectra. Despite the broad range of calculated spectra (up to 3500 cm1), we will
dis-cuss only the range from 1000 to 1500 cm1
, which is the most prominent in the experimental spectra and is the most sensitive to molecular structure (vibrational fingerprint region).
3. Results and discussion
3.1. Vibrational spectra of adsorbates
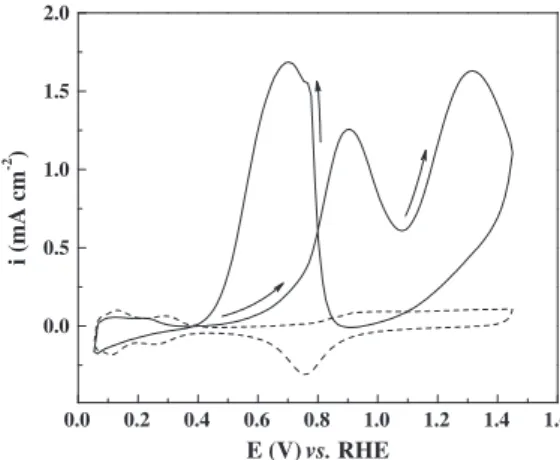
Before exploring the vibrational spectra of adsorbates of the ethanol oxidation on Pt in acidic medium, the cyclic voltammo-gram of the polycrystalline platinum electrode in 0.5 mol L1
HClO4+ 0.1 mol L1ethanol is introduced inFig. 2. In the
positive-going scan, the oxidation of ethanol begins close to 0.40–0.50 V and the current peaks at 0.90 V and 1.30 V. In the negative-going sweep, the current starts to increase at 0.90 V, reaches a maximum at 0.65 V, and then decreases to nearly zero at 0.40 V. These results are in accord with those previously observed for 0.1 mol L1
ethanol over polycrystalline platinum in acidic medium[20].
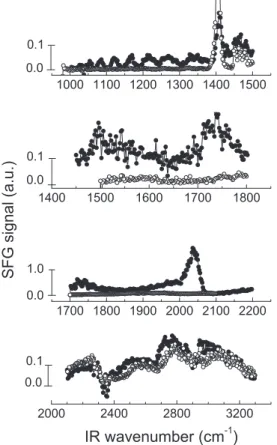
Fig. 3shows the SFG spectra (from 1000 cm1
to 3300 cm1
) of the 0.5 mol L1HClO
4+ 0.1 mol L1ethanol–Pt interface at 0.30 V
(filled circles), below the onset of the first oxidation current peak. In these spectra, different features assigned to adsorbed species can be clearly observed. The most pronounced features are at 1056 cm1, 1084 cm1, 1122 cm1, 1168 cm1, 1214 cm1,
1270 cm1, 1408 cm1, 1432 cm1, and 2056 cm1. There are also
three broad features, one between 1310 cm1and 1380 cm1,
an-other between 1450 cm1 and 1625 cm1, and a third around
1736 cm1. Based on spectra taken at other potentials (data shown
inFig. 5, Section3.2), these features are most likely comprised of
overlapping bands, at 1330 cm1, 1348 cm1 and 1370 cm1 for
the first, and at 1475 cm1, 1496 cm1and 1546 cm1for the
sec-ond. An overlapping peak at 1288 cm1
and a weak feature at 1030 cm1 can also be distinguished. The SFG spectra from
2100 cm1 to 3300 cm1 is relatively more complex to analyze,
Fig. 1.Side view of the Pt(1 1 1) cluster model.
0.0 0.2 0.4 0.6 0.8 1.0 1.2 1.4 1.6
0.0 0.5 1.0 1.5 2.0
i (mA cm
-2 )
E (V) vs. RHE
Fig. 2.Cyclic voltammogram of a polished polycrystalline platinum electrode in 0.5 mol L1HClO
since it contains weak and broad features interfering with a few narrow peaks. Among them, we clearly observe a broad band from 2650 cm1to 3200 cm1, which may be assigned to OH stretches,
as will be discussed below. In order to verify that the observed bands are indeed vibrations of adsorbates on Pt derived from eth-anol, we have scanned the same frequency ranges with a solution containing only the electrolyte (0.5 mol L1 HClO
4). As seen in
Fig. 3(empty circles), most of the SFG peaks vanish, except for a
prominent peak at 1408 cm1, a band between 1445 cm1 and
1490 cm1, and weak bands in the region 2650–3300 cm1. Since
there is no organic molecule in solution, these resonances must come from water or the electrolyte. The latter bands may be due to OH stretches of water molecules or the hydronium ion (H3O+)
[47–50]interacting with the Pt surface by hydrogen bonding (not
chemisorbed). However, the peak at 1408 cm1and the broad
fea-ture at1475 cm1cannot be attributed to perchlorate, water, or
hydronium. We will show below that they are not due to molecular adsorbates on Pt. Therefore, except from these two spurious peaks, all other features of the SFG spectra inFig. 3are due to adsorbed intermediates of the electro-oxidation of ethanol on Pt. This sur-prising result implies that there are a lot more molecular adsor-bates than previously thought, revealing a very complex reaction mechanism and making a definite assignment of all vibrational bands a formidable task. After presenting the dependence of the SFG spectra on electrochemical potential in Section3.2and SFG spectra with isotopically labeled reagents in Section3.3, we will discuss in more detail a tentative assignment of these peaks in Sec-tion3.4. For now, it suffices to say that peaks in the fingerprint range (from 1000 cm1to 1500 cm1) are due to coupled
vibra-tions of the molecular skeleton of adsorbates, such as CAC and CAO stretches, and CH, OH, and CACAO angular deformations [18]. A broad band at1700 cm1is due to the hydrogen bonded
C@O stretch of adsorbates [9,15], while the intense peak at 2056 cm1is the well known C
„O stretch of linearly bonded CO on Pt[13,16,19].
Since the peaks in the frequency range from 1000 cm1 to
1500 cm1are so numerous and appear to be regularly spaced, at
first one could imagine that they could result from interference ef-fects in the thin liquid film sandwiched between two reflective sur-faces: the CaF2window and the Pt electrode. As mentioned above,
this can be ruled out by the spectrum for the pure electrolyte/Pt interface shown inFig. 3(empty circles), where most of the reso-nances disappear, except for the narrow peak at 1408 cm1and a
broad feature at1475 cm1. Additional evidence for the absence
of interference effects in the thin liquid film is the comparison of the SFG spectrum taken with a 15
l
m thick Teflon spacer between the window and the Pt electrode with that SFG spectrum taken without any spacer[51]. It is observed that they present similar peak positions, although with considerably reduced SFG intensities for the spectrum taken with a 15l
m thick Teflon spacer due to IR absorption by water (broad OH bending at1650 cm1and OH libration below 900 cm1) in this thicker electrolyte layer. If the
spectra resulted from optical interference effects, the peak spacing should have beenD
m
= 1/(2ndcosc
), wherec
is the beam angle with respect to the surface normal within the liquid film,nis the elec-trolyte refractive index, and d is the liquid layer thickness (in cm). Since the inverse relation ofDm
and spacer thickness is not ob-served, interference cannot explain the observed SFG spectra be-low 1500 cm1.We will now turn to the origin of the SFG bands at 1408 cm1
and1475 cm1. As will be shown in Section3.2, the intensity of
these signals remains constant as function of the applied potential. This behavior is quite different than that observed for all other bands in the SFG spectra shown inFig. 3. In order to investigate whether these peaks are originated at the CaF2/solution interface,
Fig. 4displays the SFG spectra for the following interfaces: CaF2/
Fig. 3.SFG spectra (polarization combination PPP) of the 0.5 mol L1HClO 4(empty circles) and 0.5 mol L1HClO
4+ 0.1 mol L1ethanol (filled circles)–polycrystalline platinum interface at 0.30 V vs. RHE.
1000 1100 1200 1300 1400 1500
E
D
C
B
A
air / CaF2 air / Pt
CaF2 / air / Pt CaF2 / HClO4 / Pt
SFG signal
(a.u.)
IR wavenumber (cm
-1)
CaF2 / ethanol + HClO4 / Pt
Fig. 4.SFG spectra from 1000 cm1to 1500 cm1of the following interfaces: CaF 2/ 0.1 mol L1ethanol + 0.5 mol L1HClO
(0.1 mol L1ethanol + 0.5 mol L1HClO
4)/Pt at 0.05 V vs. RHE (A),
CaF2/0.5 mol L1 HClO4/Pt at 0.05 V vs. RHE (B), CaF2/air/Pt (C),
air/Pt (D), and air/CaF2(E). It is important to emphasize that the
acquisition of the SFG spectra for the CaF2/air/Pt, air/Pt, and air/
CaF2interfaces was performed in this sequence, on the same
com-ponents, and immediately after a rigorous cleaning of the CaF2
window (with KMnO4/KOH and H2O2/H2SO4 solutions, followed
by copious rinsing with Milli – Q water) and H2-flame-annealing
the Pt electrode. For the air/CaF2interface, the visible pulse energy
was increased from 40 to 900
l
J to increase the experimental sen-sitivity. It can be noted inFig. 4that the peak at1408 cm1andthe broad band between 1445 cm1 and 1490 cm1are present
in the SFG spectra of the CaF2/ethanol + HClO4/Pt, CaF2/HClO4/Pt,
and CaF2/air/Pt interfaces. Nothing is evidenced in the spectra of
the air/Pt and air/CaF2interfaces.
The presence of these bands in the spectrum for the CaF2/air/Pt
(in the absence of the electrolytic solution!) and their absence for the air/Pt and air/CaF2interfaces clearly show that these signals are
not due to any organic contamination and are also not originated from molecular resonances of adsorbates from the solution. In-stead, they only appear when the CaF2window is in close contact
with the Pt electrode. A plausible explanation would be that these bands are due to adsorbed species on the CaF2window, most likely
the OH bending mode of surface CaOH groups, since hydroxyapa-tite – Ca5(PO4)3(OH) – presents a vibration just above 1400 cm1
[52]. These vibrations would only become apparent when in con-tact with a rough Pt surface due to local enhancement of the opti-cal field on the metal surface asperities, which would significantly increase the SFG sensitivity. However, this explanation is also un-likely, since the wavenumber of this band did not redshift in pres-ence of deuterated reagents (as shown inFig. 7, Section3.3). The origin of these signals at 1408 cm1 and
1475 cm1 is a very
interesting question and clearly more experimental and theoretical work is needed to clarify this issue. Here, we will not investigate this further, since this is not directly relevant to the present study. A more detailed discussion of possible origins of these features can 1000 1100 1200 1300 1400 1500
0.0 0.2
0.9 V
IR wavenumb er (cm-1) 1000 1100 1200 1300 1400 1500 0.0
0.2
0.6 V
SFG
s
ig
n
al
(a
.u
.)
1000 1100 1200 1300 1400 1500 0.0
0.2
0.3 V
1000 1100 1200 1300 1400 1500 0.0
0.2
* (l)
(k) (j) (i)
(h) (g) (f) (e) (d) (c) (b ) (a)
0.05 V
*0 3
0.8 V
IR wavenumber (cm-1) 0
3
0.7 V
0 3SF
G
s
ig
n
a
l (
a
.u
.) 0 3
1700 1800 1900 2000 2100 2200
1700 1800 1900 2000 2100 2200
1700 1800 1900 2000 2100 2200
1700 1800 1900 2000 2100 2200
1700 1800 1900 2000 2100 2200 0
3
0.5 V
0.3 V
0.1 V
0 .0 0 .2 0 .4
0.9 V
IR wavenumber (cm-1) 0 .0
0 .2 0 .4
0.7 V
0 .0 0 .2 0 .40.5 V
SFG
s
ig
n
a
l
(a
.u
.) 0 .0 0 .2 0 .4
2000 2200 2400 2600 2800 3000 3200 3400 2000 2200 2400 2600 2800 3000 3200 3400
2000 2200 2400 2600 2800 3000 3200 3400
2000 2200 2400 2600 2800 3000 3200 3400
2000 2200 2400 2600 2800 3000 3200 3400 0 .0
0 .2 0 .4
0.3 V
0.05 V
0.00.3
IR wavenumber (cm-1) 0.0
0.3 0.0 0.3
S
F
G
s
ig
n
a
l (
a.u
.) 0.0 0.3
1400 1500 1600 1700 1800
1400 1500 1600 1700 1800
1400 1500 1600 1700 1800
1400 1500 1600 1700 1800
1400 1500 1600 1700 1800 0.0
0.3
0.9 V
0.7 V
0.5 V
0.3 V
0.05 V
Fig. 5.SFG spectra (1000–3300 cm1) of the (0.1 mol L1ethanol + 0.5 mol L1HClO
be found elsewhere [51]. Hereafter, we will no longer mention these bands in the discussion, since they are not related to adsor-bates on the Pt surface.
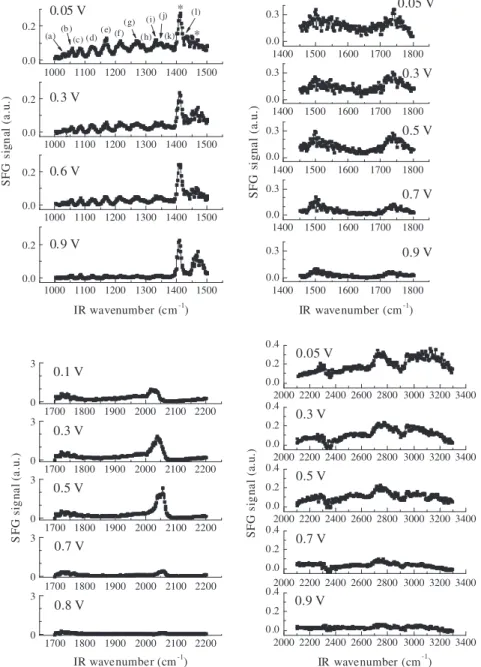
3.2. Effect of the applied potential on the SFG spectra
Fig. 5shows a set of SFG spectra for the (0.1 mol L1ethanol
+0.5 mol L1HClO
4)/Pt interface as a function of the applied
poten-tial. The SFG spectra were taken during the first series of increasing
potential steps from 0.05 V up to 0.90 V (0.05 V steps) in the wave-number range between 1000 cm1and 3300 cm1.
The SFG spectrum taken at 0.05 V presents more clearly some
bands in the wavenumber range between 1000 cm1 and
1500 cm1that are less evident in the spectra taken at relatively
more positive potentials. Particularly in the wavenumber region between 1000 cm1 and 1440 cm1, SFG bands are observed at:
(a) 1030 cm1, (b) 1056 cm1, (c) 1084 cm1, (d) 1122 cm1, (e)
1168 cm1, (f) 1214 cm1, (g) 1270 cm1, (h) 1288 cm1, (i)
1330 cm1, (j) 1348 cm1, (k) 1370 cm1, and (l) 1432 cm1.
In general, it can be noted inFig. 5 that the intensity of the
majority of the bands evidenced between 1000 cm1
and 1800 cm1and between 2100 cm1and 3300 cm1decreases with
increasing potential from 0.05 V to 0.90 V vs. RHE. Differently, the intensity of the band assigned to the C„O stretching mode of the linear-bonded CO molecules (2050 cm1) gradually increases
un-til 0.50 V and then starts to decrease. Most of the SFG signals in the wavenumber range from 1000 cm1to 3300 cm1are significantly
reduced at 0.90 V. As previously mentioned in Section3.1, the intensity of the peak at 1408 cm1 and the broad band at 1475 cm1(not from adsorbates) remains nearly constant with
the increasing potential. The broad bands at 1500 cm1 and 1740 cm1 are also reduced with increasing potential, but are
still noticeable at 0.9 V.
It is noteworthy to mention that the frequency of the C„O stretching vibration of the linear-bonded CO molecules noticeably blueshifted as function of the increasing potential from 0.1 V to 0.9 V as a result of the vibrational Stark effect[53,54], back-dona-tion mechanism[55], and dipole–dipole coupling effect [28,56]. Due to the high complexity of the SFG spectra ranging from 1000 cm1to 1800 cm1and from 2100 cm1to 3300 cm1, it is
unclear whether the bands other than that at 2050 cm1 are
shifting with the electric field, although any shift may be at most a few wavenumbers.
In order to quantitatively evaluate the effect of the applied po-tential on the SFG resonances and the nonresonant background from the Pt electrode, the SFG spectra between 1000 cm1 and
1500 cm1
and between 1700 cm1
and 2200 cm1
of the (0.1 mol L1 ethanol + 0.5 mol L1 HClO
4)/Pt interface (data
pre-sented inFig. 5) were fitted to the standard Lorentzian model:
ISFG/ Bei/þ
X
q
Aq
x
IRx
qþiC
q
2
ð1Þ
whereAq,
x
q, andCqare the strength, resonance frequency and line width of theqth vibrational mode, while/andBare the phase and amplitude of the nonresonant contribution, respectively. In order to reduce the number of adjustable parameters and reduce their uncertainty, all SFG spectra in a given frequency range were fitted simultaneously with the same/,x
q, andCq(only B andAqwere al-lowed to vary with potential, except for the CO peak at2050 cm1, which also has a potential-dependent frequency). The SFG spectra between 1700 cm1and 2200 cm1were fitted with two resonant
signals at1750 and2050 cm1. For the frequency range between
1000 cm1 and 1500 cm1, the data were first corrected for the
absorption of the CaF2window (see Section2.1), since this would
make it difficult to fit with aconstantnonresonant background plus resonances. It was then fitted with ten different peaks at 1033 cm1,
1056 cm1, 1086 cm1, 1127 cm1, 1169 cm1, 1218 cm1,
1271 cm1, 1344 cm1, 1409 cm1, and 1457 cm1. Some of these
peaks have contributions from more than one resonance, but they were considered to be a single peak to simplify the theoretical fits, therefore reducing parameter uncertainty. However, peak strengths in SFG spectroscopy are proportional toðAq=CqÞ. As a result of this, the relative amplitudes Aq from the theoretical fits of the SFG resonances between 1000 cm1and 1500 cm1 are not accurate,
(a)
(b)
Fig. 6.(a) Normalized amplitudes of the nonresonant background and SFG resonances between 1000 cm1and 1500 cm1, and from 1700 to 2200 cm1(from the theoretical fits of the SFG spectra presented inFig. 5) as a function of the applied potential. (b) Amplitudes of the various SFG resonances at low potentials.
0 200 400 600 800 1000 0.00
0.05 0.10 0.15 0.20 0.25
0.80 V
0.05 V
SFG signal (a.u.)
time (s)
1214 cm-1
1190 cm-1
0.05 V
because they also depend on the bandwidthCq. The amplitude vs. potential behavior is however truthful within the error bars. To fit the two broad bands in the frequency range between 1450 cm1
and 1800 cm1, it was necessary to include four broad and
overlap-ping peaks, leading to a very large parameter uncertainty. There-fore, they are unreliable and will not be presented or discussed further.Fig. 6a presents the amplitudes of the SFG resonances be-tween 1000 cm1and 1500 cm1, at
1750 cm1and the CO peak
at2050 cm1as a function of the applied potential, normalized
to their values at low potentials. Since the peaks from 1000 cm1
to 1400 cm1have the same potential dependence within the
fit-ting uncertainty, they are represented with an average curve la-beled as ‘‘low
x’’. It also displays the potential dependence of the
nonresonant background obtained from the spectra between 1700 cm1and 2200 cm1, since it is determined more accuratelyin that frequency range.Fig. 6b presents theAqfor the various res-onances at low potentials, to show their relative magnitudes.
The quantitative behavior of the resonant amplitudes as func-tion of the applied potential (as seen inFig. 6a) shows that the intensity of the CO band increases up to about 0.50 V and then de-creases, while the low frequency peaks initially stay constant, but then decrease with increasing potential above 0.70 V vs. RHE. In addition to that, it can be observed inFig. 6that the intensity of the nonresonant background also decreases with increasing poten-tial. However, the decrease in the nonresonant contribution is more gradual than that of the low frequency resonant signals, indi-cating that their potential dependence is not determined by the nonresonant contribution, giving further support to the conclusion that these multiple low frequency peaks are not due to interfer-ence effects[51].
Surprisingly, the major part of the adsorbed intermediates of the ethanol electro-oxidation reaction over platinum in acidic medium is formed at 0.05 V. These results show that the platinum surface is highly reactive, even at potential as low as 0.05 V. In the potential range between 0.05 V and 0.40–0.50 V, the small varia-tion of the faradaic current (Fig. 2) shows that adsorbed species are not forming the final products of the reaction. However, in this potential region, there is a gradual increase in the amplitude for the band related to the C„O stretching vibration of the linearly-bonded CO molecules. This suggests that the CO layer may be formed from the progressive consumption of part of the adsorbed species formed at 0.05 V, although the reduction of amplitudes for the low frequency SFG peaks (Fig. 6) is not obvious (given the large uncertainties), perhaps because there are so many adsorbed spe-cies that only a small fraction of each needs to be converted to CO. Therefore, it seems that the adsorbed species formed at 0.05 V are partially transformed into CO with the increasing potential.
At around 0.40–0.50 V, we observe the onset of the faradaic cur-rent (Fig. 2). Thus, from this potential, the adsorbed species are re-moved from the surface, originating the reaction products. In agreement with our results, Wang et al. [57] demonstrated on the basis of Differential Electrochemical Mass Spectrometry (DEMS) data that the formation of acetaldehyde (m/z= 29) begins at 0.40 V vs. RHE, just at the onset potential of the faradaic current. Moreover, they observed that acetaldehyde is produced in a wide range of potentials, including the reserve cycle, whereas the carbon dioxide (m/z= 22) is produced only in the region of potentials be-tween 0.50 V and 0.90 V vs. RHE[57]. This is exactly the potential range where we observe a decrease in the CO peak at 2056 cm1,
supporting the picture that CO2is produced mostly from further
oxidation of adsorbed CO.
In the oxidation region (between 0.5 V and 0.90 V), we do not observe a dynamic equilibrium between the adsorbed species and the species in the solution. We could expect that the free plat-inum sites would be replaced by other ethanol molecules as the
oxidation of the adsorbed species begins (above 0.50 V). In this way, the reaction would occur dynamically and the intensity of the bands would remain constant as function of the increasing po-tential. In contrast to this expected behavior, we observe a progres-sive decrease in the band intensities. This result could be interpreted in three different ways:
(i) The gradual decrease in the SFG band intensities in the oxi-dation region could be explained by the consumption (at rel-atively high potentials) of ethanol in the thin layer of electrolytic solution between the platinum electrode and the CaF2 window, which would then not be available to
replenish the adsorbed species after reaction. In this picture, we consider that the rate of ethanol transport from the bulk to the thin layer of electrolytic solution is negligible in com-parison with the rate of oxidation of the adsorbed species, leading to the ethanol exhaustion in the thin layer. (ii) Another possibility is that the electrochemical surface
reac-tion rate is much faster than the diffusion rate of ethanol from the thin layer of electrolyte to the electrode surface. In this case, the steady state concentration of adsorbates would be very low, being below the sensitivity limit of our SFG spectra.
(iii) Alternatively, as the oxidation of the adsorbed intermediates begins, these species are removed from the surface and the free platinum sites are partially reoccupied by different spe-cies that are not SFG active in the spectral range we have explored. In this case, these species would poison the plati-num surface and act as an ethanol oxidation inhibitor.
Considering the scenario (i) above, we now estimate the time re-quired to consume most of ethanol molecules in the thin layer vol-ume by electrochemical oxidation at 0.80 V. The initial current density in a chronoamperometry curve for potentials in the ethanol oxidation peak (0.8 V) is of the order of 1 mA/cm2.[34]Therefore,
the faradaic charge that passes through the working electrode (area
1 cm2) during one second is
1 mC, which corresponds to 1.04108
mol of electrons. According to Wang et al. [57], the product yield of the 0.1 mol L1ethanol oxidation reaction on
plat-inum in acidic medium (over a full potential cycle) is equivalent to: 1.3%, 55% and 44% for carbon dioxide, acetaldehyde and acetic acid, respectively. Considering these product yields and the number of electrons produced in each reaction (12 e, 2 eand 4 efor etha-nol?CO2, ethanol?acetaldehyde and ethanol?acetic acid,
respectively), the average number of electrons produced per oxi-dized ethanol molecule is 3. With that, 1.04108mol of electrons
will be produced in the electro-oxidation of 3.47109mol of
eth-anol molecules. For estimating the electrolytic solution volume, we take the thin layer thickness as 1
l
m, which yields a volume of 1104cm3. At 0.1 mol L1, the amount of ethanol present in thethin layer is 1108
mol. Therefore, this crude estimate indicates that it would take about 3 s to consume all the ethanol in the thin layer of solution between the electrode and the CaF2window. We
will describe below an experiment designed to investigate the time evolution of the SFG spectra upon a potential step, which may ad-dress this issue.
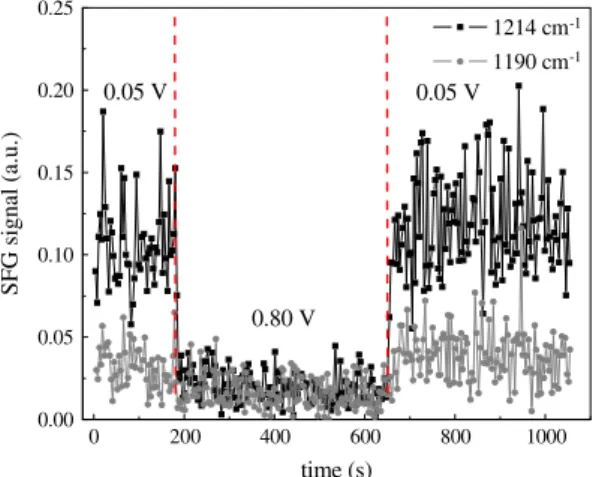
Fig. 7shows the intensity of the SFG signals at 1190 cm1and
1214 cm1as function of time. The curves were acquired
simulta-neously, with the OPA tuned back and forth between the two fre-quencies, and the time interval between two subsequent points in each curve is about 3 s. In this experiment, the electrode potential was changed from 0.05 V to 0.80 V and then, after almost 500 s, from 0.80 V back to 0.05 V. The SFG signals at 1190 cm1 and
1214 cm1correspond to a valley between two nearby resonances
nonresonant signal of the platinum electrode at 0.05 V and 0.80 V. On the other hand, the signal at 1214 cm1, related to adsorbed
intermediates of the ethanol oxidation over platinum, monitors the lifetime of the adsorbed species when the potential is changed from 0.05 V to 0.80 V and also the time required to re-establish the layer of adsorbed molecules when the potential is changed from 0.80 V to 0.05 V.
It can be noted inFig. 7that the intensity of the SFG signals at 1190 cm1and 1214 cm1remains constant as function of time at
0.05 V and quickly decreases when the potential is changed from 0.05 V to 0.80 V. The abrupt change in the SFG signal is consistent with an instantaneous jump, within the temporal resolution of the measurement (3 s). The ratio between the intensities of the SFG signal at 0.05 V and 0.80 V is equal to 2 and 6.5 for the nonresonant signal of the platinum (1190 cm1) and the SFG signal at
1214 cm1, respectively. When the potential is changed from
0.80 V to 0.05 V, the original situation is instantaneously retrieved (again, within the temporal resolution of the measurement,3 s). This experiment was repeated in triplicate and the obtained results were in accord with those presented in Fig. 7. Also, the same behavior was observed for the SFG signal at 1120 cm1.
Although the fast decrease in the SFG signal at 1214 cm1is
consistent with the hypothesis of ethanol consumption and our estimate of its timescale, the similarly fast recovery of this signal would not be expected, since it would take place in the much slower timescale of the diffusion of ethanol from the bulk solution into the thin layer of electrolyte. On the other hand, if our estimate of the timescale for ethanol consumption in the thin layer is too short, we should then have observed a gradual decrease in the SFG signal upon increasing the potential from 0.05 V to 0.8 V. Thus, we can rule out the exhaustion of the ethanol molecules in the thin layer of electrolyte as the reason for the decrease in the intensity of the most of the SFG bands at the wavenumber range between 1000 cm1to 3300 cm1from 0.50 V to 0.90 V (Fig. 5).
We believe the most appropriate explanation is given by sce-nario (iii) above, that is, the adsorbed intermediates from ethanol oxidation are gradually oxidized with increasing potential, and the free platinum sites are not re-occupied only by ethanol mole-cules, but also by other species that poison the catalyst surface, suppressing the dynamic oxidation reaction via adsorbed interme-diates. This is in fact what is observed in chronoamperometry experiments, where a marked reduction in the oxidation current is observed at a fixed potential within the ethanol oxidation peak [34]. However, these poisoning species are not detected by SFG spectroscopy, probably because their vibrations are below 1000 cm1(e.g., Pt
AO). As the potential increases, the relative cov-erage of ethanol adsorbates to the poison species decreases, and at 0.90 V, most of the adsorbed intermediates were completely re-moved from the platinum surface (very weak SFG signals in
Fig. 5), and the faradaic current starts to decrease in the cyclic
vol-tammogram shown inFig. 2. The immediate recovery of the SFG signal when the potential is changed from 0.8 V back to 0.05 V shows that the poison is readily reduced and leaves the Pt surface ready for ethanol readsorption. Additionally, the reduction of the SFG peak intensities could also be due to a low dynamic coverage of the intermediates during the oxidation reaction, as a result of a faster oxidation turnover with respect to local ethanol diffusion and adsorption (scenario (ii)). However, this cannot be the only mechanism to explain the reduction in SFG signal at 0.8 V, since this would imply on a constant oxidation current, which is incon-sistent with chronoamperometry experiments.
At this point, another interesting question appears: if we do not observe most of the SFG bands related to the adsorbed intermedi-ates of the ethanol electro-oxidation reaction on platinum above 0.90 V, how could we explain the second oxidation peak (at around 1.30 V) in the cyclic voltammogram shown inFig. 2, which
corre-sponds to a reactivation of the electrode for ethanol oxidation? Above 0.90 V, it is possible that the adsorbed reaction intermedi-ates are different than those observed at relatively lower poten-tials. The conversion of part of the adsorbed intermediates (formed at 0.05 V) to other adsorbed species, in particular linear-bonded CO, is a proof that the reaction mechanism depends on the applied potential. Additional evidences were reported by Wang et al.[57]and Iwasita[58]. They investigated the volatile products (acetaldehyde and carbon dioxide) of the ethanol electro-oxidation over platinum using DEMS and they observed that only acetalde-hyde is formed above 1.10 V. In this potential region, probably the adsorption of ethanol molecules and the CAC bond breaking are inhibited by the presence of other species adsorbed on the plat-inum surface. As a result, the intermediates are weakly adsorbed (little residence time at the surface) and quickly transformed into partially oxidized products. In such a manner, we do not observe the SFG bands associated with the reaction intermediates in the potential range between 1.10 V and 1.30 V due to their low stea-dy-state surface coverage, below the sensitivity of our SFG appara-tus. Therefore, we are not able to explore these adsorbed species and offer a mechanistic view of the Pt reactivation at 1.10 V. It is important to mention that Ohmic drop effects could affect the re-gion of faradaic current, above 0.5 V vs. RHE, increasing the applied potential necessary to attain the desired electrode potential E. Therefore, when we use 0.9 V in the thin film geometry, it may actually correspond to a lower electrode potential vs. RHE. We did not correct our results for the ohmic drop. However, neglecting this correction does not affect our qualitative analysis on the for-mation/reactivity of adsorbed intermediates of the ethanol elec-tro-oxidation on Pt.
Finally, we discuss the thermodynamic implications of our find-ings. At first, it seems quite surprising that several adsorbates coexist simultaneously at low potentials, as implied by the com-plex SFG spectra in the 1000–1400 cm1range. This would require
that many adsorbates would have similar adsorption free energies, so that their equilibrium surface coverages are comparable. How-ever, this unlikely conclusion assumes thermodynamic equilibrium between the adsorbates and ethanol in solution. If the adsorption energies are high enough when compared to the thermal energy, the adsorption would be ‘‘irreversible’’ (at a fixed potential), and the surface coverages would not be determined by thermodynamic equilibrium, but rather by the kinetics of adsorption and reaction. In this way, all adsorbates that have high adsorption energies would have appreciable coverage, despite any difference in their energy values.
3.3. Results with isotopically labeled ethanol
In order to assist the peak assignment of the SFG spectra, espe-cially in the fingerprint region, we have performed experiments with deuterium labeled reagents (water and ethanol) and also
13C labeled ethanol.Fig. 8shows the SFG spectra from 1000 cm1
to 1800 cm1and from 2100 cm1to 3300 cm1of the following
interfaces: (0.1 mol L1 CH
3CH2OH + 0.5 mol L1 HClO4)/Pt and
(0.1 mol L1 CD
3CD2OD/D2O + 0.5 mol L1 HClO4/D2O)/Pt. All SFG
spectra presented inFig. 8were taken at 0.3 V vs. RHE. SFG spectra ranging from 1000 cm1to 1500 cm1of the (0.1 mol L1CH
3CH
2-OH + 0.5 mol L1HClO
4)/Pt interface and (0.1 mol L1CH3A13CH
2-OH + 0.5 mol L1 HClO
4)/Pt interface at 0.05 V vs. RHE are
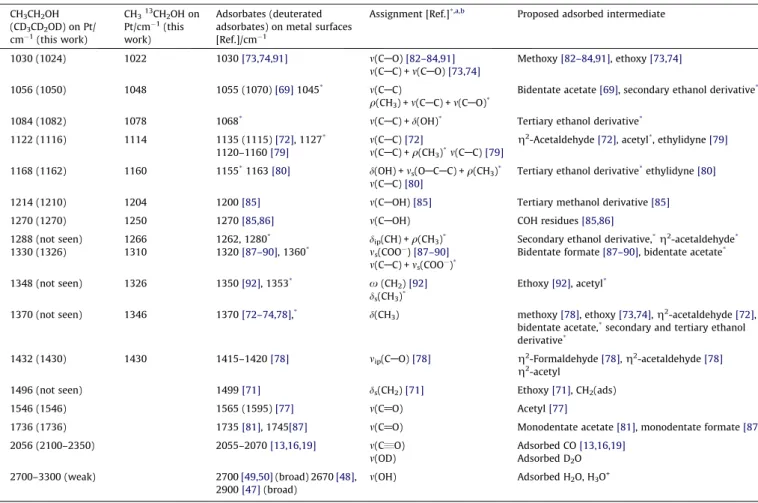
presented inFig. 9.Table 1summarizes the wavenumbers of the main bands evidenced in the SFG spectra presented inFigs. 8 and 9. It also includes possible band assignments that will be discussed in Section3.4.
As seen inFig. 8, the SFG spectrum for CD3CD2OD + HClO4/Pt
presents most of the bands observed in the wavenumber region between 1000 cm1and 1450 cm1for the CH
spectrum, except the SFG bands at 1288 cm1, 1348 cm1 and
1370 cm1. From 1450 cm1 to 1800 cm1, the main change in
the CD3CD2OD + HClO4/Pt spectrum compared to the CH3CH
2-OH + HClO4/Pt interface spectrum is the absence of the band at
around 1496 cm1. In the wavenumber range between
2100 cm1 and 2500 cm1 for the deuterated solution (only the
HClO4 was protonated), it can be noted a broad band (from
2100 cm1to 2350 cm1centered at
2250 cm1), which may be
due to the OD stretch of water molecules interacting with the Pt surface by hydrogen bonding, that is, the same band at 2700– 3300 cm1for CH
3CH2OH + HClO4/Pt but red shifted upon
deuter-ation. Finally, between 2500 cm1
and 3300 cm1
, the CD3CD2
OD + HClO4/Pt spectrum presents relatively less intense bands than
the CH3CH2OH + HClO4/Pt spectrum, since the H abundance in the
solution is much smaller. In presence of CH3A13CH2OH (as shown
in Fig. 9), bands in the wavenumber range between 1000 cm1
and 1500 cm1are red shifted with respect to the band positions
for CH3CH2OH + HClO4/Pt.
The results with isotopically labeled ethanol are extremely important for the identification of the adsorbed intermediates of the ethanol electro-oxidation on Pt in acidic medium. On one hand, the bands present in both CH3CH2OH/Pt and CD3CD2OD/Pt spectra
definitively correspond to CAC and CAO vibrational modes of the adsorbed intermediates. On the other hand, the bands that disap-pear in the presence of deuterated ethanol and D2O are surely
re-lated to CAH and OAH vibrational modes. The 13C results indicate that most of the adsorbed intermediates detected between 1000 cm1 and 1500 cm1 present the carbon atom initially
attached to the OH group of the ethanol (
a
carbon), although the partial overlap between the displaced bands (13C) and the originalbands (12C) may allow a contribution from species containing only 12C (thebcarbon of ethanol).
3.4. Tentative Assignment of the Vibrational Bands and Identification of Reaction Intermediates
Based on the results with isotopically labeled ethanol, which were presented in the last section, we have discussed only the gen-eral assignment of the vibrational SFG bands observed in the pres-ent work. The detailed discussion of them is relatively more complex. For this reason, we need support from literature and the-oretical calculations.
In order to have supporting information for the assignment of the observed peaks in the SFG spectra for the ethanol solution/Pt interface (listed inTable 1), we theoretically evaluated the infrared and Raman spectra of some of the possible adsorbed intermediates of the ethanol electro-oxidation on Pt. The species considered here were: carbon monoxide, a secondary ethanol derivative (PtACHOHACH3), a tertiary ethanol derivative [(Pt)2@COHACH3],
acetyl, bidentate acetate, ethoxy and
g
2-acetaldehyde. Althoughthe accurate computation of IR and Raman intensities is notori-ously difficult, the theoretical results for fundamental frequencies usually show satisfactory agreement (within a few tens of cm1)
with the experimental data[44,59]. As a benchmark calculation, we have computed the infrared and Raman spectra for an isolated ethanol molecule to compare them with experimental results for 0.0
0.2 0.4
CD3CD2OD + HClO4 CH3CH2OH + HClO4
IR wavenumber (cm-1) 2100 2200 2300 2400 2500
2100 2200 2300 2400 2500 0.0
0.2 0.4
SFG signa
l (a
.u.)
1500 1600 1700 1800 1500 1600 1700 1800
0.0 0.2 0.4
CD3CD2OD + HClO4
*
IR wavenumber (cm-1) *
CH3CH2OH + HClO4
0.0 0.2 0.4
SFG signal (a.u.)
2600 2800 3000 3200 2600 2800 3000 3200
0.0 0.2 0.4
CD3CD2OD + HClO4 CH3CH2OH + HClO4
IR wavenumber (cm-1) 0.0
0.2 0.4
SFG signal (a.u.)
0.0 0.1
0.2 CD3CD2OD + HClO4 *
IR wavenumber (cm-1) *
1000 1100 1200 1300 1400
1000 1100 1200 1300 1400 0.0
0.1 0.2
SFG signal (a.u.)
CH3CH2OH + HClO4
Fig. 8.SFG spectra (1000–1800 cm1and 2100–3300 cm1) of the following interfaces: (0.1 mol L1CH
(liquid) ethanol[60–62]and check the accuracy of our method. The theoretical results are shown inTables 2 and 3.
Table 2 presents experimental and calculated wavenumbers
corresponding to ethanol vibrations. In addition, the differences between experimental and calculated wavenumbers (considering
the scale factor or not) are also presented inTable 2. In both cases, it can be noted that the differences between experimental and cal-culated wavenumbers are not uniform for low and high wavenum-ber regions. By analyzing these differences without the scale factor, it can be seen that the calculation obtains frequency values closer to those observed experimentally in the region corresponding to the CAC and CAO vibrations. Therefore, in the following discussion of SFG peak assignments (Table 1) we have not used the scale fac-tor in comparisons between experimental and calculated wave-numbers for vibrations involving CAC and CAO stretches. On the other hand, in the wavenumber regions corresponding to CH vibra-tions, the unscaled calculation overestimates the experimental fre-quencies and the scaled calculated wavenumbers show good agreement with experiment. In this way, for CH vibrations, we have used the scaled calculated frequencies when comparing to experimental peaks listed inTable 1. It is important to mention that for OH vibrations, the calculation estimates wavenumber val-ues very far from those observed experimentally (considering the scale factor or not). This is obviously due to the fact that hydrogen bonding of the OH group to other ethanol or water molecules is not taken into account in our calculations. Therefore, theoretical fre-quencies which involve OH vibrations will not be used for compar-isons with experiments.
As shown inTable 3, there is satisfactory agreement between the theoretical results for CO on Pt (2002 cm1) with the
experi-mental data (2056 cm1), especially considering that this vibration
is coverage- and potential-dependent, effects which have not been Table 1
Wavenumber of the main bands observed in the SFG spectra shown inFig. 8andFig. 9.
CH3CH2OH (CD3CD2OD) on Pt/ cm1(this work)
CH313CH2OH on Pt/cm1(this work)
Adsorbates (deuterated adsorbates) on metal surfaces [Ref.]/cm1
Assignment [Ref.]*,a,b Proposed adsorbed intermediate
1030 (1024) 1022 1030[73,74,91] m(CAO)[82–84,91] Methoxy[82–84,91], ethoxy[73,74]
m(CAC) +m(CAO)[73,74]
1056 (1050) 1048 1055 (1070)[69]1045* m(C
AC) Bidentate acetate[69], secondary ethanol derivative*
q(CH3) +m(CAC) +m(CAO)*
1084 (1082) 1078 1068* m(C
AC) +d(OH)* Tertiary ethanol derivative*
1122 (1116) 1114 1135 (1115)[72], 1127* m(C
AC)[72] g2-Acetaldehyde[72], acetyl*, ethylidyne[79]
1120–1160[79] m(CAC) +q(CH3)*m(CAC)[79]
1168 (1162) 1160 1155*1163[80] d(OH) +m
s(OACAC) +q(CH3)* m(CAC)[80]
Tertiary ethanol derivative*ethylidyne[80]
1214 (1210) 1204 1200[85] m(CAOH)[85] Tertiary methanol derivative[85]
1270 (1270) 1250 1270[85,86] m(CAOH) COH residues[85,86]
1288 (not seen) 1266 1262, 1280* d
ip(CH) +q(CH3)* Secondary ethanol derivative,*g2-acetaldehyde*
1330 (1326) 1310 1320[87–90], 1360* m
s(COO)[87–90] Bidentate formate[87–90], bidentate acetate* m(CAC) +ms(COO)*
1348 (not seen) 1326 1350[92], 1353* x(CH
2)[92] Ethoxy[92], acetyl* ds(CH3)*
1370 (not seen) 1346 1370[72–74,78],* d(CH
3) methoxy[78], ethoxy[73,74],g2-acetaldehyde[72], bidentate acetate,*secondary and tertiary ethanol derivative*
1432 (1430) 1430 1415–1420[78] mip(CAO)[78] g2-Formaldehyde[78],g2-acetaldehyde[78]
g2-acetyl
1496 (not seen) 1499[71] ds(CH2)[71] Ethoxy[71], CH2(ads)
1546 (1546) 1565 (1595)[77] m(C@O) Acetyl[77]
1736 (1736) 1735[81], 1745[87] m(C@O) Monodentate acetate[81], monodentate formate[87]
2056 (2100–2350) 2055–2070[13,16,19] m(C„O) Adsorbed CO[13,16,19]
m(OD) Adsorbed D2O
2700–3300 (weak) 2700[49,50](broad) 2670[48], 2900[47](broad)
m(OH) Adsorbed H2O, H3O+
*Wavenumbers and assignments from theoretical calculations carried out in the present work. aNotation used for mode description:m, stretching;d, deformation;x, wagging;q, rocking.
b Subscripts indicate the type of mode: s – symmetric, as – asymmetric, op – out-of-plane vibration, ip – in-plane vibration.
Table 2
Experimental results and theoretical predictions for ethanol. Only the resonances that are intense in both IR and Raman spectra are listed.
Experimental [60–62] (cm1)
Theoretical
wavenumbers unscaled (scaled)a(cm1)
Assignmentb,c D exp.
-unscaled
D- exp.
- scaled
882 896 (860) ms(CCO) 14 +22
1051 1034 (993) ma(CCO) +17 +58
1094 1094 (1050) ms(CO) 0 +44
1320 1270 (1219) d(COH) +50 +101
1383 1449 (1391) x(CH2),
ds(CH3)
66 8
1454 1502 (1442) das(CH3) 48 +12
2877 2963 (2844) ms(CH2) 86 +33
2890 2989 (2869) ma(CH2) 99 +21
2928 3017 (2896) ms(CH3) 89 +32
2974 3082 (2959) ma(CH3) 108 +15
2974 3089 (2965) ma(CH3) 115 +9
3350 3794 (3642) ms(OH) 444 292
aScale factor 0.96[93].
included in the calculations. This validates the methodology em-ployed in the present work. However, the most important conclu-sion from the theoretical results is that no single adsorbate (nor a small set of them) can explain the very complex vibrational spectra
ofFig. 8in the 1000–1400 cm1range, particularly knowing that
most of these bands are CAC or CAO stretches (as discussed in Sec-tion 3.3). We must conclude that it is originated from several adsorbates being present on the Pt surface, even at low potentials. The implications of this finding will be discussed later.
Next, we will discuss in detail the tentative assignments of the SFG bands observed in the present work. These band assignments will be based on our theoretical calculations and on electrochemi-cal and UHV studies previously reported in the literature. We orga-nize the band assignments in following Sections 3.4.1–3.4.4.
3.4.1. Water, hydronium and OD (bands between 2300 cm1and 3300 cm1)
The broad band from 2650 cm1to 3200 cm1may be due to
OH stretches of water molecules or hydronium ions (H3O+) [47–
50] interacting with the Pt surface by hydrogen bonding (not chemisorbed). This band was previously reported in SFG studies
[49,50]and assigned to the OH stretching vibration of the water
molecules in the double layer. Indeed, the OH stretching vibration frequency of the water molecules in the double layer may be rela-tively different compared to that observed for liquid water (3400 cm1)[63]. However, we disagree with this interpretation
for two reasons: (i) the profile of the SFG band related to water in the double layer has been previously reported[23,24]and it is not exactly the one we observe; (ii) the dependence of the band inten-sity with the potential is not the one expected for water in the dou-ble layer. From a negatively charged surface (at low potential) to a positively charged surface (at high potential), we should have ob-served a decreasing, and then increasing, band intensity, which is also not the case.
3.4.2. Adsorbed intermediates previously proposed at electrochemical environment with basis on electrochemical evidences (ClO
4, tertiary ethanol derivative, bidentate acetate, and CO)
The band at 1120 cm1
is extensively reported in the literature
[14,20,64,65]and has been assigned to the asymmetric stretching
of perchlorate anions in solution. Nevertheless, in the present work, this band presents atypical behavior as a function of the po-tential (data shown inFig. 5), compared to previous work[66]. Spe-cifically, the SFG spectra show that the band at 1120 cm1 is
present even at potential as low as 0.05 V. Further, its intensity de-creases with positive going potential, in contrast to what we can expect for an anion [66]. In fact, another band at 980 cm1 has
been observed with SFG spectroscopy and was assigned to ab-sorbed perchlorate anions [33]. Therefore, the feature at 1120 cm1is more likely to be related to another adsorbed species.
The tentative assignment of this feature will be presented later in Sections 3.4.3 and 3.4.4.
According to our calculations, the bands at 1084 cm1 and
1168 cm1 correspond, respectively, to the
m
(CAC) +d(OH) and thed(OH) +
m
s(OACAC) +q
(CH3) modes of a tertiary ethanolderiv-ative, (Pt)2@COHACH3. The latter mode has a strong contribution
of the OH bending vibration. For this reason, the scaled theoretical wavenumber inTable 3is more appropriate than the unscaled one. However, the wavenumber shift in presence of deuterated reac-tants is only 6 cm1(Table 1), not as important as we should
ex-pect for a mode including a hydrogen atom. With basis on our calculations, we explain this conflicting behavior in terms of the geometry of the adsorbed tertiary ethanol intermediate and the important contribution of the OACAC stretching to the mode at 1168 cm1
. The OH bond is almost parallel to the platinum surface. Then, although the OH bending is very strong, it contributes not much to the observed peak intensity, according to the infrared selection rule that allows only those vibrations with dipole changes perpendicular to the surface to be observed. Consequently, the character of OACAC stretching mode, which does not involve any H atom, prevails over the character of OH bending. Therefore, deuteration of the OH group would decouple it from this mixed vibrational mode, without affecting its frequency significantly. Ter-tiary ethanol derivative was previously proposed by Iwasita and Pastor based on a band at 1257 cm1assigned to its C
AOH stretch [17]. Iwasita and Pastor mentioned that this frequency was slightly higher than that one expected for tertiary ethanol in solution be-tween 1205 cm1 and 1125 cm1. Therefore, we agree with the
possible formation of this intermediate, but disagree on the assign-ment of the band at 1257 cm1(see Section 3.4.4).
Table 3
Theoretical predictions for CO, secondary and tertiary ethanol derivative, acetyl, bidentate acetate, ethoxy and g2-acetaldehyde adsorbed on Pt(1 1 1). Only the resonances that are intense in both IR and Raman spectra are listed. Underlined values will be considered in comparison with experimental peaks (see text for details).
Adsorbates Theoretical
wavenumbers unscaled (scaled)a(cm1)
Assignmentb,c
CO 2002 (1922) m(C„O)
Secondary ethanol 1035 (994) m(CAC) +d(CH3) +d(OH)
1045 (1003) q(CH3) +m(CAC) +m(CAO)
1188 (1140) Strongdop
(CH) +d(OH) + weakq(CH3) 1229 (1180) Strongd(OH) +dop
(CH) + weakq(CH3) 1315 (1262) Strongdip(CH) + weak
q(CH3) 1430 (1373) ds(CH3) 1493 (1433) Strongdas(CH3) 1499 (1439) das(CH3)
Tertiary ethanol 1017 (976) qop(CH3) +d(OH)
1066 (1023) qip(CH3) +d(OH) 1068 (1025) m(CAC) +d(OH)
1203 (1155) d(OH) +ms(OACAC) +q(CH3) 1426 (1369) ds(CH3)
Acetyl 1037 (996) q(CH3)
1127 (1082) m(CAC) +q(CH3) 1409 (1353) Strongds(CH3) 1753 (1683) m(C@O) +das(CH3)
Bidentate acetate 1360 (1306) ms(COO) +m(C AC)
1407 (1351) Strongmas(COO) +d(CH3) 1428 (1371) ds(CH3)
Ethoxy 1027 (986) m(CAC) +m(CAO)
1115 (1070) q(CH3)
1271 (1220) s(CH2)
1370 (1315) x(CH2)
1419 (1362) ds(CH3) 1498 (1438) das(CH3)
1508 (1448) ds(CH2) + weakds(CH3)
g2-acetaldehyde
1101 (1057) m(CAC)
1159 (1113) q(CH3) +qop(CH) 1333 (1280) strongd(CH) + weakq(CH3) 1425 (1368) ds(CH3)
3024 (2903) ms(CH3)
a Scale factor 0.96[93].
b Notation used for mode description:m, stretching;d, deformation;x, wagging; s, twisting;q, rocking andsci, scissoring.
c Subscripts indicate the type of mode: s – symmetric, as – asymmetric, op –