Article
Printed in Brazil - ©2016 Sociedade Brasileira de Química0103 - 5053 $6.00+0.00*e-mail: [email protected]
Contribution of Irradiation and Dihydroxybenzenes on Iron(III) Reduction in
Fenton Process
Beatriz Costa e Silva and Raquel F. P. Nogueira*
Departamento de Química Analítica, Instituto de Química, Universidade Estadual Paulista “Júlio de Mesquita Filho” (UNESP), CP 355, 14801-970 Araraquara-SP, Brazil
The contribution of irradiation and the dihydroxybenzenes (DHB), catechol (CAT) and hydroquinone (HQ), added or formed as phenol oxidation intermediates, was evaluated for the reduction of FeIII and for phenol degradation via Fenton processes. The formation of CAT and HQ was observed during phenol degradation starting with Fe2+ or Fe3+ in the presence or absence of irradiation and their presence increased the rate of phenol degradation, more remarkably when initially added. Initial phenol degradation rate in the presence of DHB in the dark was much higher in comparison to their absence due to the initial higher and faster formation of Fe2+. However, degradation slows down due to the rapid oxidation of DHB, while under irradiation of free iron or citrate complex much higher mineralization is achieved in shorter time.
Keywords: catechol, hydroquinone, complex, phenol
Introduction
One of the most promising advanced oxidation processes (AOPs) for treatment of efluents containing recalcitrant contaminants is that based on Fenton reaction. They are carried out during the decomposition of H2O2 with
free, complexed or insoluble FeII species, due mainly to
the fast generation of highly oxidizing and non selective
species, hydroxyl radical (•OH; E0 = 2.8 V, vs. normal
hydrogen electrode) which may promote the oxidation of a variety of organic contaminants. Other important advantages are the relatively low cost of the reagents involved, the mild operation conditions employed, absence of iron toxicity and the environmentally benign character of H2O2 at the concentrations used.1,2 Despite the high
oxidation power of the process, an important limiting step is the regeneration of FeII in the catalytic FeII/FeIII cycle, due
to the quick oxidation of FeII to FeIII, which accumulates
in solution due to the much slower reaction between FeIII
and H2O2 (equations 1 and 2), decreasing considerably the
rate of •OH generation.
FeII + H
2O2→ FeIII + HO• + HO− k = 76 M−1 s−1 (1)
FeIII + H
2O2→ FeII + HO•2 + H+ k = 0.01 M−1 s−1 (2)
High concentrations of FeII increase the rate of
oxidation process, however catalytic amounts of FeII or
FeIII are preferred to avoid the formation of FeIII hydroxides
sludge. Therefore, the degradation eficiency of organic
contaminants are strongly dependent on reduction of FeIII
species, which can be overcome by the use of radiation (photo-Fenton process), increasing drastically the eficiency of the overall process through the photolysis of FeIII species,
such as aqua and some organic complexes, which dissociate in the excited state to yield FeII and oxidized ligand.1,3,4
Photolysis of ferric complexes with organic ligands as oxalate, citrate or tartrate greatly enhances FeIII reduction
rates due to an effective ligand to metal charge transfer and by the shift of absorption toward longer wavelengths in relation to the aqua complexes.5-8
In the dark, reduction rates of FeIII species depend on
the redox potential of the reaction medium, but can be also signiicantly affected by the presence of reducing
organic species. Orto- and para-dihydroxybenzene (DHB)
compounds, such as catechol (CAT) and hydroquinone (HQ),
have capacity to reduce iron(III)9-11 as can other phenol
derivatives.12 Considering that one of the irst steps in
It has been proposed that CAT and HQ are oxidized to the respective semiquinones (SQ•) in a one-step electron transfer, reducing FeIII to FeII; in a second step, SQ• is
oxidized to quinone either by another FeIII or O
2, which
can also act as the electron acceptor, and be reduced by the semiquinone radical to superoxide/hydroperoxide radicals,O2•−/HO2•, that can be converted to H2O2.9,10,15,16
Considering these two main iron reduction mechanisms, the objective of this study was to compare the contribution of DHB, added or formed as phenol degradation products,
on reduction of FeIII in the dark and under irradiation
(photoreduction) in the presence and absence of citrate as iron complexing agent, using identical reaction conditions (initial pH, FeIII, H
2O2 and phenol concentration).
Experimental
Reagents
Phenol (Vetec, Rio de Janeiro, RJ, Brazil) was used to
prepare aqueous solution of 40 mg L−1. Fe(NO
3)3 9H2O
(J. T. Baker, Tokyo, Japan) and FeSO4 7H2O (F. Maia,
Cotia, SP, Brazil) were used to prepare aqueous iron stock
solution of 0.25 mol L−1. Citric acid (Synth, Diadema,
SP, Brazil) was used as iron ligand. Hydroquinone from CAAL (São Paulo, SP, Brazil) and catechol from
Sigma-Aldrich (St. Louis, MO, USA) were used. H2O2 (30%, m/m;
Synth, Diadema, SP, Brazil) was used as received after standardization. Bovine liver catalase from Sigma-Aldrich (St. Louis, MO, USA) was used for residual hydrogen peroxide consumption. Ammonium metavanadate (Vetec,
Rio de Janeiro, RJ, Brazil) 0.06 mol L−1 was prepared in
0.36 mol L−1 H
2SO4 (Merck & Co., Inc., Kenilworth, NJ,
USA) and used for hydrogen peroxide determination. Methanol (J. T. Baker, Tokyo, Japan), acetic acid (Vetec, Rio de Janeiro, RJ, Brazil) and ultrapure water (Gehaka, São Paulo, SP, Brazil) were used for high-performance liquid chromatography (HPLC) analysis.
Degradation procedures
Experiments under irradiation and in the dark were
carried out in an up low reactor previously described.17
The irradiation source was a 15 W black-light lamp with maximum emission at 365 and 410 nm. When irradiation was employed, the lamp was only switched on once the reactor was completely illed and the time started to be monitored. Experiments in the dark were performed in the same reactor but with the lamp switched off. The pH of the solution was then adjusted to 2.5 with addition of 1 mol L−1 H
2SO4 solution, pH in the optimum range of
photo-Fenton process.17,18 After pH adjustment, the iron
salt was added to result in 0.10 mmol L−1 concentration.
Iron citrate complex (Fecit) was prepared in situ by the
addition of citric acid to iron nitrate solution at 1:1 iron to
ligand molar ratio. Appropriate volume of H2O2 was then
added to result in 2.5 mmol L−1 solution while magnetically
stirred, and the solution was immediately pumped into the reactor. The irradiated volume of the reactor was 280 mL
and the total volume 500 mL. Phenol solution (40 mg L−1;
0.42 mmol L−1) was recirculated at 80 mL min−1 low rate,
using a peristaltic pump (Masterlex 7518-12, Cole-Parmer Instrument Co. Ltd., London, UK). These concentrations
of phenol, iron and H2O2 were chosen after preliminary
tests to enable the detection and quantiication of CAT and HQ, besides of phenol. Catechol and HQ were added at
concentrations ranging from 0 to 1.50 mmol L−1 to evaluate
their effect on iron reduction and on phenol degradation.
Chemical analysis
The concentration of phenol, CAT and HQ during the experiments was determined using reversed-phase HPLC (LC-20AT Prominence, Shimadzu, Kyoto, Japan) coupled to a diode array detector (DAD) SPD-M20A. The injection volume was 40 µL and a Gemini 5 mm C18 column (150 × 4.6 mm; Phenomenex, Torrance, CA, USA) was used with a mixture of methanol:acetic acid 1.0% (25:75, v/v)
as mobile phase at 1.0 mL min−1 low rate. Under these
conditions, retention time of phenol, CAT and HQ were 8.3, 4.6 and 2.6 min detected at 270, 276 and 289 nm wavelength, respectively. Before HPLC analysis, 35 µL of catalase
solution (0.1 g L−1) were added to 5 mL aqueous sample
after pH adjustment to 6-7. This procedure was adopted to interrupt the Fenton reaction by the decomposition of residual H2O2 and iron precipitation.19 The samples were then iltered
through 0.45 µm polyvinylidene luoride (PVDF) membrane
(Millipore, Billerica, MA, USA) before HPLC analysis. Mineralization of organic matter during phenol degradation was evaluated by measuring the decay of the total organic carbon concentration (TOC) using a TOC analyzer (TOC-5000A, Shimadzu, Kyoto, Japan). TOC was measured immediately after the sample withdrawal without previous treatment.
The residual hydrogen peroxide concentration was determined spectrophotometrically (UV Mini 1240, Shimadzu, Kyoto, Japan) by measuring the absorption at
450 nm after reaction with ammonium metavanadate.20
The concentration of ferrous ions generated during the degradation experiments was measured using the spectrophotometric method employing 1,10-phenanthroline,
Results and Discussion
Phenol was used as a model compound to verify the effect of dihydroxybenzenes on degradation rate, since it has been previously observed that CAT and HQ are two isomers formed as initial products as a consequence
of hydroxyl radical attack to benzenic ring.9,22 Control
experiments under only irradiation or in the presence of
only H2O2, Fe2+ or Fe3+ showed no decrease of phenol
concentration. However, irradiation in the presence of Fe2+
resulted in 10% phenol oxidation with no mineralization after 90 min.
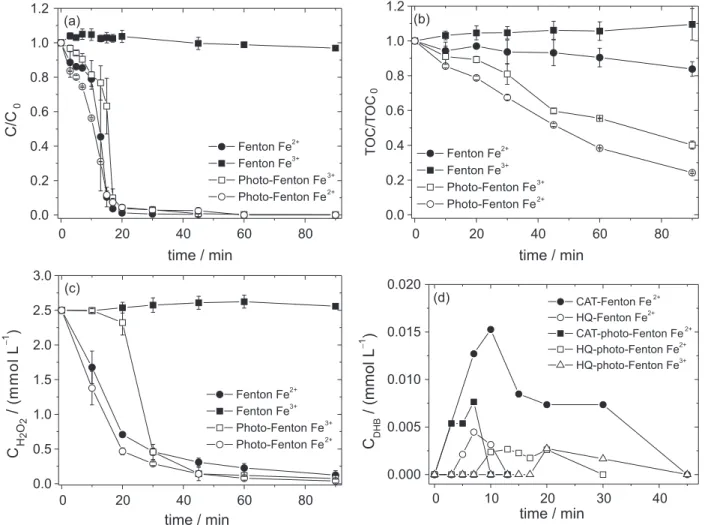
Phenol degradation in the dark in the presence of Fe2+
and H2O2 started with a low rate resulting in a phenol
decrease of only 0.8 mg L−1 min−1 in the irst 10 min, while
the degradation rate increased about 3 times, reaching
2.5 mg L−1 min−1 degradation after 15 min of reaction.
Similar behavior was observed under irradiation, however with higher initial rate due to the contribution of irradiation
on Fe2+ regeneration, achieving 1.4 mg L−1 min−1 after
7 min and 3.1 mg L−1 min−1 after 15 min. In both cases,
over 98% phenol degradation was observed after 30 min in the dark and under irradiation (Figure 1a).
Phenol degradation in the presence of Fe3+ and H
2O2
under irradiation started also with a low rate up to 13 min, achieving a removal rate of only 0.7 mg L−1 min−1, while it
was accelerated achieving 3.8 mg L−1 min−1 up to 20 min.
However, in the dark, no phenol degradation occurred due
to the much lower rate of H2O2 decomposition with Fe3+
in comparison to Fe2+. Similar behavior was previously
observed during the same experimental time, but starting with 2 mmol L−1 phenol.9
In relation to TOC removal, a different behavior was observed. Since in the absence of irradiation using Fe2+, 16%
removal was achieved after 90 min due to total conversion of Fe2+ to Fe3+. On the other hand, the TOC removal under
irradiation achieved 76 and 60% of mineralization after 90 min with Fe2+ and Fe3+, respectively (Figure 1b).
The H2O2 consumption presented similar behavior when
compared to phenol oxidation (Figure 1c). However, the consumption of H2O2 (mols of H2O2 consumed per mols
of phenol oxidized) when Fe2+ was used under irradiation
was slightly higher than in the dark: 5.0 after 20 min, while it was 4.3 in the dark. This indicates that under irradiation
part of H2O2 was thermally decomposed without generation
of hydroxyl radical, since mineralization was very similar up to 10 min.
During phenol degradation, both CAT and HQ were monitored to investigate if their generation in solution could be correlated with the change in the reaction rate of phenol degradation observed (Figure 1a). HQ was irst
detected after 5 min, achieving a maximum concentration
(0.0045 mmol L−1) after 7 min when Fe2+ was used in the
dark, while CAT achieved 0.015 mmol L−1 after 10 min
(Figure 1d). This concentration of CAT corresponds to approximately 4% phenol conversion. In the presence of irradiation, CAT was detected after 3 min achieving a
maximum concentration after 7 min (0.0077 mmol L−1)
and after 10 min HQ was detected, achieving 0.0027 after 13 min. It is important to mention that these are the measured concentrations and both CAT and HQ can be formed and degraded continuously.
When Fe3+ was used under irradiation, only HQ was
detected, achieving 0.0027 mmol L−1 after 20 min and
increasing phenol degradation up to 30 min, when HQ started to be degraded. It can be observed that after the maximum concentration of CAT and HQ were achieved, the rate of phenol degradation was increased, which suggests that the DHB formed strongly inluenced phenol
degradation rate, probably by the regeneration of Fe2+
(Figure 1a). The process was slower with Fe3+ since it must
be irstly reduced by irradiation for further reaction with
H2O2, which delayed hydroquinone formation occurring
only after 20 min (Figure 1d).
Considering that the detection of CAT and HQ during phenol degradation indicated their inluence in the increase of phenol degradation rate, the effect of addition of these compounds to phenol solution in the beginning of reaction was evaluated at concentrations ranging from 0.05 to 1.50 mmol L−1.
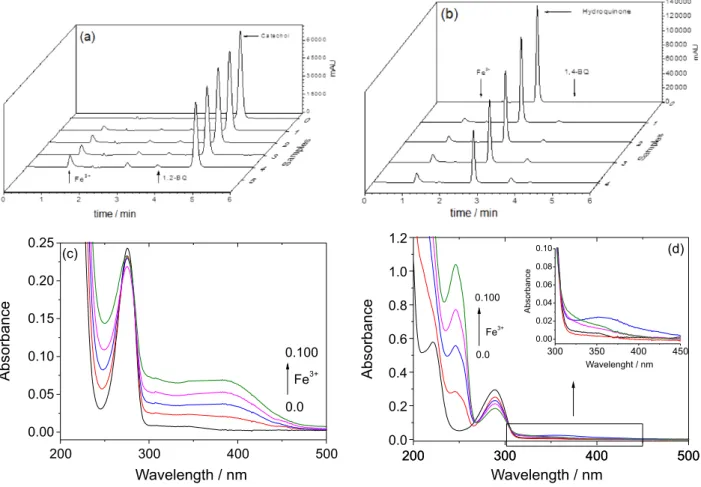
After addition of CAT or HQ to phenol solution, other peaks were detected in chromatographic analysis carried out immediately after DHB addition, with retention times (tr) of
3.4 and 3.7 min, respectively. It was also observed that the area of these peaks increased with increasing concentration
of Fe3+ (Figures 2a and 2b, indicated by an arrow) and
that the area of CAT (tr = 4.5 min) and HQ (tr = 2.6 min)
peak decreased in relation to the concentration initially added to the solution (Figures 2a and 2b). The ultraviolet visible (UV-Vis) absorption spectra of the solutions of
CAT and HQ with increasing concentrations of Fe3+
were registered and showed an increase of absorption at 386 and 246 nm, respectively, suggesting the oxidation of DHB to the corresponding quinones in the dark
and absence of H2O2, since the absorption spectrum of
1,2-benzoquinone and 1,4-benzoquinone have a maximum
wavelength at 385 and 248 nm, respectively.23 On the
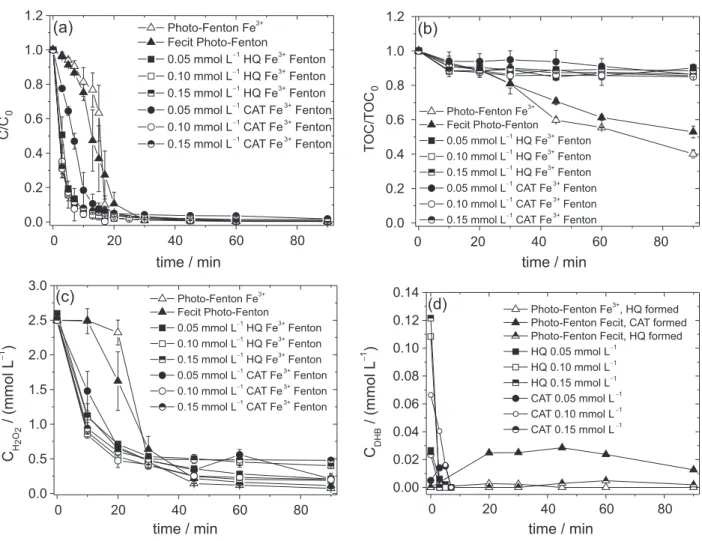
When catechol and hydroquinone were initially added to phenol solution in the presence of Fe3+, phenol degradation
followed a irst order kinetics and the rate constants were calculated for the different initial concentrations of the DHB
(Table 1). The addition of 0.05, 0.10 and 0.15 mmol L−1
increased the initial oxidation rate of phenol independently of the concentration added. The addition of HQ and CAT resulted in more than 95% phenol oxidation after 13 and 20 min, respectively. In relation to mineralization, very similar results were observed in the presence of either CAT or HQ, about 10 to 15% TOC removal after 10 min, with no further mineralization, probably due to the total conversion of these compounds.
The Fecit complex was used as iron source to compare the eficiency of free and complexed iron in the reduction
of Fe3+ and to verify if the complexed iron affected the
formation of DHB. Phenol degradation in the presence of Fecit and irradiation started with a low rate up to 7 min, achieving 0.8 mg L−1 min−1 but achieving 2.3 mg L−1 min−1
up to 20 min, higher oxidation rate than with free FeIII,
but lower than with added DHB (Figure 3a). The H2O2
consumption presented a behavior similar to the phenol oxidation (Figure 3c). Organic compounds degradation in the presence of citrate under irradiation at pH 2.5 ± 0.2 may be attributed to the formation of complexes such as FeIII-citrate and FeIIIH-citrate, which represent about
80 and 5% of the total iron species, respectively (calculated by Visual Minteq 3.1 software).24 In the presence of citrate,
FeIII is reduced under irradiation due to a ligand to metal
charge transfer, exhibiting higher photoactivity to produce •OH under irradiation than in the absence of citrate.25
In the presence of citrate, CAT was formed only after
20 min, achieving 0.25 mmol L−1, indicating that the
formation of CAT started after partial degradation of citrate, as can be observed by TOC concentration (Figure 3).
Fe2+ was determined during phenol degradation to
compare the reduction of Fe3+ by CAT, HQ, citrate and
irradiation in the absence of H2O2 to avoid Fe2+ oxidation
(Figure 4). FeIII initially present was completely and
immediately reduced after the addition of DHB, forming
0 20 40 60 80
0.0 0.2 0.4 0.6 0.8 1.0 1.2
C/C
0
time / min
Fenton Fe2+
Fenton Fe3+
Photo-Fenton Fe3+
Photo-Fenton Fe2+
(a)
0 20 40 60 80
0.0 0.2 0.4 0.6 0.8 1.0 1.2
T
OC/T
OC
0
time / min
Fenton Fe2+
Fenton Fe3+
Photo-Fenton Fe3+
Photo-Fenton Fe2+
(b)
0 20 40 60 80
0.0 0.5 1.0 1.5 2.0 2.5 3.0
C H
2
O2
/
(m
m
o
l
L
−
1 )
time / min
Fenton Fe2+
Fenton Fe3+
Photo-Fenton Fe3+
Photo-Fenton Fe2+
(c)
0 10 20 30 40
0.000 0.005 0.010 0.015 0.020
C D
H
B
/
(m
m
o
l
L
−
1 )
time / min
CAT-Fenton Fe2+
HQ-Fenton Fe2+
CAT-photo-Fenton Fe2+
HQ-photo-Fenton Fe2+
HQ-photo-Fenton Fe3+
(d)
Figure 1. Inluence of irradiation and iron species on phenol oxidation (a); mineralization (b); H2O2 consumption (c); and catechol (CAT) and hydroquinone
(HQ) formed (d) in the dark or under irradiation. Initial conditions: Cphenol = 40 mg L−1, CFe = 0.1 mmol L−1, CH2O2 = 2.5 mmol L−1, pH 2.5. Error bars of
Fe2+ as previously observed.11,26 Irradiation of free iron and
Fecit complex also lead to FeIII reduction, however at much
lower rate. Irradiation of citrate complex resulted in higher rate of Fe2+ generation when compared to irradiation of free
iron, but has reached a plateau, probably due to degradation of citrate and of CAT generated and, thus, reduction of
Fe3+ ends. These results evidence the higher ability of HQ
and CAT for the conversion of Fe3+ to Fe2+ in the dark
when compared to irradiation of free and complexed iron,
probably also due to the contribution of quinones formed on further Fe3+ reduction as previously observed.12
Conclusions
The results of this work indicate that phenol degradation is strongly affected by the presence of catechol or hydroquinone, since reaction kinetics changes drastically after their detection in the dark. Addition of these DHB in the beginning of reaction accelerated signiicantly phenol degradation due to strong iron reducing capacity of these
compounds, conirmed by the immediate detection of Fe2+
after addition of Fe(NO3)3 solutions, much higher than Fe2+
generated in the photolysis of Fecit complex and free iron. However, despite this fast oxidation of phenol to DHB and subsequent oxidation to quinones, the irradiation of free iron or Fecit complex lead to much more eficient TOC removal independent of DHB, indicating the importance of the continuous effect of irradiation both on iron reduction and on phenol mineralization. Although the addition of DHB is not feasible in a practical application to wastewater treatment by Fenton process, the presence of contaminants
Figure 2. Chromatograms of catechol (CAT) 0.1 mmol L−1 (a) and hydroquinone (HQ) 0.1 mmol L−1 (b); and absorption spectra of CAT (c) and HQ (d)
with increasing Fe3+ concentrations: 0, 0.025, 0.050, 0.075 and 0.100 mmol L−1, pH 2.5. 1,2-BQ: 1,2-benzoquinone; 1,4-BQ: 1,4-benzoquinone. Inset:
approximation of spectra from 300 to 450 nm.
Table 1. First order rate constant of phenol degradation in the dark in the presence of catechol (CAT) or hydroquinone (HQ)
Dihydroxybenzene Concentration / (mmol L−1)
Rate constant / min−1
CAT
0.05 0.18 ± 0.10
0.10 0.32 ± 0.04
0.15 0.31 ± 0.02
HQ
0.05 0.31 ± 0.05
0.10 0.34 ± 0.01
0.15 0.34 ± 0.02
0 20 40 60 80 0.0 0.2 0.4 0.6 0.8 1.0 1.2 C/C 0
time / min
Photo-Fenton Fe3+
Fecit Photo-Fenton
0.05 mmol L−1
HQ Fe3+Fenton
0.10 mmol L−1
HQ Fe3+Fenton
0.15 mmol L−1
HQ Fe3+Fenton
0.05 mmol L−1
CAT Fe3+Fenton
0.10 mmol L−1
CAT Fe3+Fenton
0.15 mmol L−1
CAT Fe3+Fenton
(a)
0 20 40 60 80
0.0 0.2 0.4 0.6 0.8 1.0 1.2 T OC/T OC 0
time / min
Photo-Fenton Fe3+
Fecit Photo-Fenton
0.05 mmol L−1
HQ Fe3+Fenton
0.10 mmol L−1
HQ Fe3+Fenton
0.15 mmol L−1
HQ Fe3+Fenton
0.05 mmol L−1
CAT Fe3+Fenton
0.10 mmol L−1CAT Fe3+Fenton
0.15 mmol L−1
CAT Fe3+
Fenton
(b)
0 20 40 60 80
0.0 0.5 1.0 1.5 2.0 2.5 3.0 C H 2 O2 / (m m o l L − 1 )
time / min
Photo-Fenton Fe3+
Fecit Photo-Fenton
0.05 mmol L−1HQ Fe3+Fenton
0.10 mmol L−1
HQ Fe3+
Fenton
0.15 mmol L−1
HQ Fe3+Fenton
0.05 mmol L−1
CAT Fe3+Fenton
0.10 mmol L−1
CAT Fe3+Fenton
0.15 mmol L−1CAT Fe3+Fenton
(c)
0 20 40 60 80
0.00 0.02 0.04 0.06 0.08 0.10 0.12 0.14 C D H B / (m m o l L − 1 )
time / min
Photo-Fenton Fe3+, HQ formed
Photo-Fenton Fecit, CAT formed Photo-Fenton Fecit, HQ formed
HQ 0.05 mmol L−1
HQ 0.10 mmol L−1
HQ 0.15 mmol L−1
CAT 0.05 mmol L−1
CAT 0.10 mmol L−1
CAT 0.15 mmol L−1
(d)
Figure 3. Inluence of catechol (CAT) and hydroquinone (HQ) on oxidation (a); mineralization of phenol (b); H2O2 consumption (c); and dihydroxybenzenes
(DHB) concentration (d). Initial conditions: Cphenol = 40 mg L−1, CFe3+ = 0.1 mmol L−1, Ccitric acid = 0.1 mmol L−1, CH2O2 = 2.5 mmol L−1, pH 2.5. Error bars
of triplicate experiments are shown.
Figure 4. Generation of FeII during phenol degradation under different
conditions in the absence of H2O2. Error bars of triplicate experiments
are shown. HQ: Hydroquinone; CAT: catechol.
0 20 40 60 80
0.00 0.03 0.06 0.09 0.12 C F e 2 + / (m m o l L − 1 )
time / min
HQ Fe3+Fenton
CAT Fe3+Fenton
Fecit Photo-Fenton
Fe3+Photo-Fenton
Fe3+Fenton
with phenolic groups or other iron reducing organic compounds may strongly affect the initial degradation kinetics, favoring its application.
Acknowledgments
The authors thank CNPq for support of this work and CAPES for a scholarship awarded to B. Costa e Silva.
References
1. Legrini, O.; Oliveros, E.; Braun, A. M.; Chem. Rev. (Washington, DC, U. S.)1993, 93, 671.
2. Pignatello, J. J.; Oliveros, E.; MacKay, A.; Crit. Rev. Environ. Sci. Technol. 2006, 36, 1.
3. Balzani, V.; Carassiti, V.; Photochemistry of Coordination of Compounds, 1st ed.; Academic Press: London, 1970.
4. Faust, B. C.; Hoigne, J.; Atmos. Environ. 1990, 24, 79. 5. Abrahamson, H. B.; Rezvani, A. B.; Brushmiller, J. G.; Inorg.
Chim. Acta1994, 226, 117.
7. Safarzadeh-Amiri, A.; Bolton, J. R.; Cater, S. R.; Sol. Energy
1996, 56, 439.
8. Nogueira, R. F. P.; Silva, M. R. A.; Trovó, A. G.; Sol. Energy
2005, 79, 384.
9. Chen, R.; Pignatello, J. J.; Environ. Sci. Technol.1997, 31, 2399. 10. Aguiar, A.; Ferraz, A.; Contreras, D.; Rodríguez, J.; Quim. Nova.
2007, 30, 623.
11. Du, Y.; Zhou, M.; Lei, L.; J. Hazard. Mater. 2006, B136, 859. 12. Aguiar, A.; Ferraz, A.; Chemosphere2007, 66, 947.
13. Nichela, A. A.; Donadelli, J. A.; Caram, B. F.; Haddou, M.; Nieto, F. J. R.; Oliveros, E.; Einschlag, F. S. G.; Appl. Catal., B
2015, 170, 312.
14. Devi, L. G.; Rajashekhar, K. E.; Raju, K. S. A.; Kumar, S. G.;
Desalination2011, 270, 31.
15. Contreras, D.; Rodríguez, J.; Freer, J.; Schwederski, B.; Kaim, W.; JBIC, J. Biol. Inorg. Chem. 2007, 12, 1055. 16. Chen, F.; Ma, W. H.; He, J. J.; Zhao, J. C.; J. Phys. Chem. A
2002, 106, 9485.
17. Nogueira, R. F. P.; Guimarães, J. R.; Water Res. 2000, 34, 895. 18. Pignatello, J. J.; Environ. Sci. Technol. 1992, 26, 944.
19. Malato, S.; Blanco, J.; Cáceres, J.; Fernandez-Alba A. R.; Agüera, A.; Rodriguez, A.; Catal. Today2002, 76, 209. 20. Nogueira, R. F. P.; Oliveira, M. C.; Paterlini, W. C.; Talanta
2005, 66, 86.
21. Fortune, W. B.; Mellon, M. G.; Ind. Eng. Chem., Anal. Ed.1938,
10, 60.
22. Scheck, C. K.; Frimmel, F. H.; Water Res.1995, 29, 2346. 23. http://srdata.nist.gov/gateway/gateway?substance=quinone&s
ubft=Submit&rddesc=desc accessed on December 2015. 24. Gustafsson, J. P.; Visual MINTEQ ver. 3.1; KTH Royal Institute
of Technology, Sweden, 2014.
25. Guo, J.; Du, Y.; Lan, Y., Mao, J.; J. Hazard. Mater. 2011, 186, 2083.
26. Jiang, C.; Gao, Z.; Qu, H.; Li, J.; Wang, X.; Li, P.; Liu, H.;
J. Hazard. Mater. 2013, 250, 76.
Submitted: September 16, 2015
Published online: January 25, 2016