STRUCTURAL TRANSFORMATION AND
SPECIALIZATION PATTERNS IN THE PRODUCT
SPACE
–
ASSESSING CHINA AND INDIA
Rui Jorge da Costa Neves - #434
A Project carried out on the Economics Master, under the supervision of:
Luís Catela Nunes and Miguel Lebre de Freitas
2
Structural Transformation and Specialization Patterns in the Product Space
–
Assessing China and India
Rui Jorge da Costa Neves
Abstract
This paper assesses the specialization patterns of China and India, studies the
goods that are related to the core of capabilities of the countries, and then investigates
the products that allow the referred countries to
improve the average “income content”
of their export basket. Following Hausmann et al. (2007) we compute indicators of
“income content” of a country's export basket and measures of “density” which assess
the likelihood of a country developing comparative advantage in one good given the
current specialization pattern. The results obtained suggest that both countries are
making their structural transformation into two main sectors, “Machinery” and
“Chemicals, plastics, rubbers”, are becoming specialized in higher “income content”
goods, and are abandoning traditional sectors like “Footwear and Clothing” and
agricultural products.
Keywords:
Revealed Comparative Advantage, Structural Transformation, Upscale
3
1. Introduction
For the last couple of decades the World has seen a
“catch
-
up” of the emerging
economies to the so called “rich”
countries. Leading the spectacular, and surprising,
growth by these economies is China, closely followed by India, OECD (2010, 2011).
These emerging economies were mainly countries specialized in low-skilled labour
intensive goods, but that now are having a structural change that allow them to
specialize in higher
“income content”
goods.
This paper assesses the specialization patterns of China and India, studies the
goods that are related to the core of capabilities of the countries, and then investigates
the products that allow the referred countries to
improve the average “income content”
of their export basket. We follow Hausmann et al. (2007), which conducted studies on
the relationship between pairs of products and the effects of those relations on economic
performance. Also Hidalgo et al. (2007), following the work done by Hausmann and
Klinger (2006, 2007), assessed the impact of the RCA
on a country’s specialization
pattern and in the process of structural transformation, which is basically the shifting of
a specific country specialization pattern towards a more “sophisticated”
basket of goods.
4
comparison at country level, the authors created an index called EXPY, which is the
average sophistication level of a country’s export basket of goods.
This measure
presents the international situation of a country.
Then we move on to assess how valuable the productive experience with one
specific product is to produce other products. To do so, Hausmann and Klinger (2006,
2007) and Hidalgo et al. (2007) created a measure that allow the study of possible
relations between pairs of products, basically measures the probability of a specific
country to develop Revealed Comparative Advantage (RCA) in pairs of goods. The
authors used a conditional probability estimation method, which basically gives the
probability of a country developing RCA in one product given that it has RCA in
another product. This gave them the information to construct a measure called
“density”
, which measures the
“
relatedness
”
of a specific product with the specialization
pattern of a country, basically how close is one specific product to all the products
which the country already develop RCA. The authors found evidence that this density
index is highly significant in predicting the future of specialization patterns of nations,
suggesting that countries move their specialization patterns towards goods more
“
related
”
to the current productive experience.
5
In section 2 we describe the data used in our analysis and we explain the
methodology and indexes of our work. In section 3 we assess the specialization patterns
of both China and India and discuss their consistency. In section 4 we look into the
upscale products that could allow the nations to achieve a structural transformation.
Conclusions are made in section 5.
2. Data and Methodology
Our calculations use international trade data at the product level (HS-4), from
the UN-COMTRADE database and per capita GDP levels (in PPP) by the IMF, World
Economic Outlook Database, April 2007. The data refers to the year of 2005 and covers
1245 products of 93 countries with population larger than 2 million people.
2.1. The PRODY index
Hausmann et al. (2007) suggested an indicator which assesses the sophistication
level,
or the “income content”,
of a specific product. The PRODY index is defined as
the weighted average of the per capita incomes of the countries exporting that product,
where the used weights are proportional to the country’s index of revealed comparative
advantage (RCA) in that product. Formally for each product
i
,
, with
,
(1)
6
2.2. The EXPY index
The EXPY index is used to assess the average sophistication level of the total
exports of a country. This index is defined as the weighted average of the PRODY
indexes, being the weights the export shares of each product in the total exports of the
country. Formally, for each country
c
, the EXPY index is mathematically defined as:
(2)
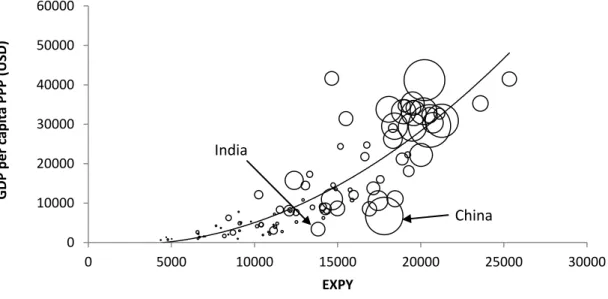
Figure 1: Crossing EXPY with per capita GDP
Source: Author’s calculations.
Circles are proportional to the exports shares of each country in the total World’s exports.
Following Hausmann et al. (2007), Figure 1 relates the EXPY index with the per
capita GDP for the countries in our sample. We see a positive correlation between the
two variables, giving us evidence that high income countries tend to export products
that have high
“
income content. The authors also concluded that the EXPY indicator is
a strong and robust predictor of economic growth, after controlling for the standard
covariates.
0
10000
20000
30000
40000
50000
60000
0
5000
10000
15000
20000
25000
30000
GD
P
p
er
cap
ita PP
P
(U
S
D
)
EXPY
7
2.3. Value Increments
We now focus on the role of the previous indexes when we analyze the
opportunities for a given country in the process of structural transformation (shifting the
export basket towards a more sophisticated basket of goods). The products that can do
this effe
ct are those with higher PRODY than the country’s average level
, the EXPY,
they
are called “Upscale products”.
Formally, for product
i
to be considered an upscale
product it is computed as:
(3)
From now on, we will refer to the later expression
as the “Value Increment”
associated to the product
i
in country
c
.
2.4. Revealed Relatedness Indexes (RRI)
Now, we analyze how the productive experience with one product is helpful to
produce other products. Accordingly to Hausmann and Klinger (2006, 2007), if the
productive capabilities of a country are easily adapted to the production of goods, then
the probability of that country developing RCA in specific products in the future is
affected by those capabil
ities. The authors developed an index called “proximity”,
which basically pairs up the connections between the products and gives them feedback
about the future probability of one country developing revealed RCA in one product,
given that it has RCA in the other product.
However, in our model we follow Freitas and Salvado (2008) to estimate the
relatedness between products. The RRI are estimated using a PROBIT regression
method, where the probability of a country developing RCA in one product is
conditional on having RCA in another product. Formally,
8
where
is a dummy variable, which takes the value of one if country
c
has RCA in
product
i
, and the value zero otherwise.
Then the model extracts the increment in probability, the marginal effects, of
having RCA in one product due to have RCA in the other product for the entire sample
of products and for all the 93 countries. Formally for each possible pair of products (
i,j
):
, (4)
where the function G is the standard normal cumulative distribution function. One
possible case is that when
= 0 then the probability of developing RCA in product
j
does not depend on having RCA in the product
i
.
Formally, the increment in probability (marginal effects) of having RCA in
product
j
due to have RCA in product
i
,
(5)
One important aspect is the significance of the RRI in our model, so a
significance test was done using a z statistic with a confidence level of 95%. The
significant RRI take the value zero in our matrix. So we have estimated a
non-symmetric matrix, 1245x1245, of all possible relations between pairs of products.
9
Table 1: results of the RRI estimation
Number
%total
Non-significant 1.299.120 83,88%
Significant
249.660
16,12%
Positive
243.718
15,74%
Negative
5.942
0,38%
Total
1.548.780 100,00%
Source: Author’s estimations based on the Freitas and Salvado (2008) framework.
A second novelty is that using this method we allow the RRI to be either positive
or negative; this gives us feedback of how much a product is helpful or harmful to the
other.
To contrast, the work done by Hausmann and Klinger (2006, 2007) only allowed
positive relationships between products. Freitas and Salvado (2008) give the example of
raw materials and other primary products which have negative RRI with other products.
One interesting example comes with climate: some goods are only produced in a
certain type of temperature or humidity, opposing others with completely different
conditions, or needs, so that in this case a negative RRI is a more reasonable option. In
table 1 we see that we have some negative RRI in our model, about 0,38% of the total
estimation.
The third novelty is that the matrix estimated by our model is not symmetric,
meaning that, generally:
(6)
10
2.5. The inward perspective
The inward perspective assesses the extent to which the country
’s
overall
productive experience is helpful to the production of a specific product. Following
Hausmann and Klinger (2006, 2007), the probability of a country developing RCA in a
particular product in the future depends on the “proximity” that it has with the country’s
overall export basket, the authors called that measure “density”. This density index
captures th
e effect that the country’s overall productive
experience has on a single
product. In this paper we are going to use a different index of density than the one used
by the authors and Freitas and Salgado (2008). Adapting the index to our model based
on Freitas and Salgado (2008), formally, for each product
j
in country
c
, our density
index is given by:
, (7)
where
is the dummy variable defined in (3), and
is defined in (4) and (5). We
call this index ‘pure density’.
Regarding our density index, following Hausmann and
Klinger (2006, 2007), a high index for a specific product
j
suggests that product
j
is
much related to the country specialization pattern. In other words, the core of
capabilities of country
c
is helpful, and adapted, to the production of product
j
. On the
other hand, a low density index suggests that the product
j
is much unrelated to the
country’s
overall productive experience.
3. Specialization Patterns
3.1. The Chinese case
11
Figure 2: The Chinese specialization pattern
Source: Author’s calculations. Circles are proportional to the export shares of each product in China’s total exports
Remember that a high pure density index suggests
that the country’s overall
productive experience can be very helpful to the production of a specific product, hence
very related to the country’s specialization pattern. The value increment gives us the
information about the products which can increase the overall sophistication level of the
country’s export basket
, the products that can increase the EXPY index, hence the per
capita GDP.
In Table 2, we divided the products by categories. First we can see that the set of
products in which China i
s specialized account for about 83% of the country’s total
exports. The category with the highest export share is
“Machinery”, with 48 products.
Leading this category and the country’s exports is “8471
-Automatic data processing
machines and units thereof” with about 10% of the country’s exports with a density
value of 55 and a value increment of 23%, meaning that the highest exported good in
China increases the average sophistication level of the Chinese export basket.
-300%
-250%
-200%
-150%
-100%
-50%
0%
50%
100%
150%
-10
10
30
50
70
90
Val
u
e
In
cr
e
m
e
n
ts
Pure Density
12
Table 2: China - Products with RCA>1, broken down by product category
Category
Chapter of HS
Number of products Share of exports
Agricultural products and food
00-24
49
2,31%
Mineral products and oils
25-27
18
1,33%
Chemicals, plastics, rubbers
28-40
73
4,62%
Wood, wood products, paper
44-49
18
0,99%
Hides, leather and textiles
41-43, 50-60, 63
82
7,15%
Clothing and footwear
61-62,64-67
51
11,59%
Stones, ceramic, glass
68-71
27
1,55%
Metals
72-83
71
5,31%
Machinery
84-85
48
36,56%
Transportation
86-89
10
2,37%
Miscellaneous
90-97
54
8,79%
Total
501
82,59%
Source:
Author’s calculations
The products with the highest density values (top5), those that are more related
to the country’s
specialization pattern, include:
“
7907-
Other articles of zinc”
with
0,
02% of the Chinese exports; “8501
-Electric motors and generators (excluding
generating sets)” (0,
45% export share
); “3926
-
Other articles of plastics and articles of
other materials of headings
” (0,79%); “7326
-
Other art
icles of iron or steel” (0,
37%);
“7318
-Screws, bolts, nuts, coach screws, screw hooks, rivets, cotters, cotter-pin ...
”
(0,23%). All these products are upscale products (positive value increments), meaning
that they elevate the average sophistication level of the Chinese exports.
On the other hand, products like
“713
-
Dried leguminous vegetables, shelled
”
(0,
05%) or “714
-
Manioc, arrowroot, sweet
potatoes and similar roots” (0,
01%) have
very low density values, and also value increments that decrease the average
sophistication level of the Chinese export basket by more than 125%; so they are
downscale products,
and also very unrelated to the country’s core of capabilities.
13
important aspects to be taken: the first is that “8542
-
Electronic integrated circuits and
microassemblies” that r
anks number 5 in the exports made by China (1,92%) is not in
the country’s specializations pattern
, China does not have RCA in this product.
However it is an upscale product that ranks low in the density index, suggesting that it
may happen that this produ
ct is not very much related to the country’s overall
productive experience. Second, “2710
-
Petroleum oils, other than crude”
, which China
is not currently specialized but exports it in a significant amount (0,84%), has a negative
density index indicating that is quite inconsistent with the current Chinese specialization
pattern.
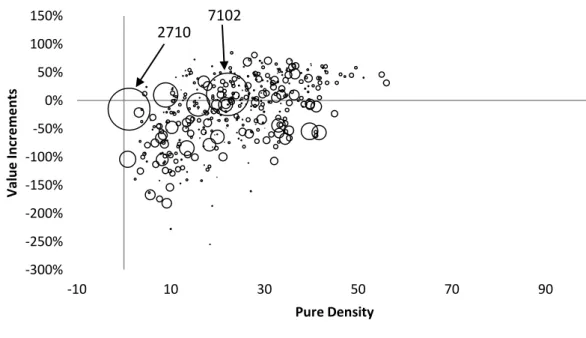
3.2. The Indian case
We now focus on the specialization pattern of India. The country has 378
products in its specialization pattern, accounting for 80% of Indian exports. Mimicking
the previous figure, Figure 3 crosses the value increments with the corresponding pure
densities for the commodities in which India is specialized.
Figure 3: The Indian specialization pattern
Source: Author’s calculations. Circles are proportional to the export shares of each product in the total exports made by India
-300%
-250%
-200%
-150%
-100%
-50%
0%
50%
100%
150%
-10
10
30
50
70
90
Val
u
e
In
cr
e
m
e
n
ts
Pure Density
14
Just by visual observation we can see that India has a product, “2710
-
Petroleum
oils, other than crude”, that is largely exported
(11,17%) with a very low pure density
and negative value increment, so it is a product not related to the country’s
specialization pattern and it downgrades the sophistication level of the Indian exports.
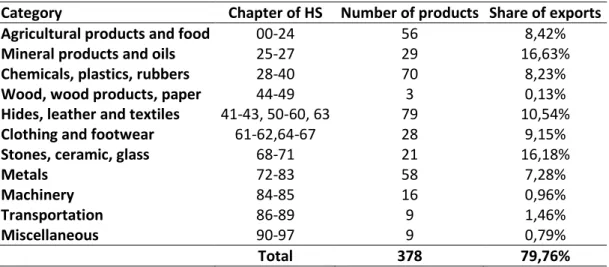
Table 3: India - Products with RCA>1, broken down by product category
Category
Chapter of HS Number of products Share of exports
Agricultural products and food
00-24
56
8,42%
Mineral products and oils
25-27
29
16,63%
Chemicals, plastics, rubbers
28-40
70
8,23%
Wood, wood products, paper
44-49
3
0,13%
Hides, leather and textiles
41-43, 50-60, 63
79
10,54%
Clothing and footwear
61-62,64-67
28
9,15%
Stones, ceramic, glass
68-71
21
16,18%
Metals
72-83
58
7,28%
Machinery
84-85
16
0,96%
Transportation
86-89
9
1,46%
Miscellaneous
90-97
9
0,79%
Total
378
79,76%
Source: Author’s calculations
Breaking down the products by category, table 3
, we realize that “
Mineral
products and oils” comes first in terms of exports, with 29 products exported. Also the
category “Stones, ceramic and glass” comes in as a close
second with “7102
-Diamonds,
whether or not worked, b
ut not mounted or set” (with 11,39% of the country’s total
exports) leading the exports of India. Focusing on the products with the higher density
index, products that are very consistent with the Indian overall productive experience,
for example: “7307
-
Tube or pipe fittings of iron or ...” (with a export share of 0,22%) or
“3812
-
Prepared rubber accelerators” (0,04%), being these two products upscale,
relative to the country’s export basket.
Opposing, India has goods in which is
specialized like “202
-
Meat of bovine animals, frozen” (0,06%) or “901
-
Coffee,
whether or not roasted or decaffeinated” (0,02%) with very low density levels and
15
cou
ntry’s specialization pattern.
Inspecting the top 50 exported products made by India
we see that the country has 56 products in which it is specialized and 4 products that are
not in its specialization pattern. For example, India does not have RCA in
“8703
- Motor
cars and other motor vehicles principally designed for the transport”,
which ranks 16
th
in exports. This product has a sophistication level higher than the average sophistication
level of the Indian export basket of about 51%.
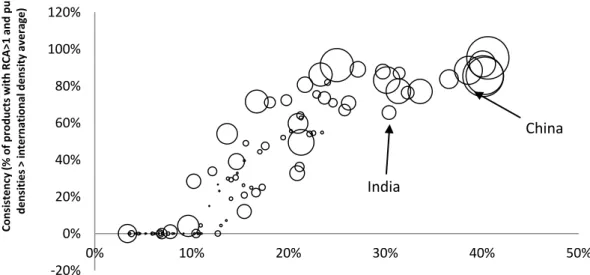
3.3. The consistency of the specialization patterns
To see how consistent the specialization patterns of China and India are we need
an international comparison. To do so, we use a measure that is the simple average of all
the pure density average levels of all the countries in the sample for the products that
they are specialized in (RCA>1). We are going to call this measure the international
density average (IDA).
Figure 4: Consistency of the specialization patterns for all the countries in the sample
Source: Author’s calculations. Circles are proportional to the exports shares of each country in the World’s total exports
Note: See appendix 1 for all the countries results
-20%
0%
20%
40%
60%
80%
100%
120%
0%
10%
20%
30%
40%
50%
C
ons
is
te
ncy
(%
of
products
wi
th RC
A
>
1
and pure
de
ns
it
ie
s
>
i
nt
e
rnat
ional
dens
it
y
av
e
rage
)
Export diversification ( % of products with RCA>1)
China
16
In Figure 4 we present two new indicators: Consistency and Export
Diversification. The first is the percentage of products with RCA>1 that have the pure
density index higher than the IDA (17,84). The second is the percentage of products
with RCA>1 in all the products in the sample. Regarding China, the country has the
second highest Export Diversification with a Consistency index of 86% (9
th
place). As
for India, the country ranks 26
th
in consistency with a Consistency index of 66%, and
with an Export Diversification index of 30%. The top country in both indexes is
Germany, which indicate that it is the country with more related products to their
productive capabilities.
Two important notes: first, we observe a large number of countries, mostly
non-developed countries, with a consistency index of zero. This was an expected result since
the averages of the densities levels of these countries are low; suggesting that the
products in theirs specialization patterns are much unrelated to the countries
’
overall
capabilities. Second, there is a positive correlation between Export diversification and
Consistency: as one country exports more products, the productive experience of the
country becomes higher, hence higher probability of developing new products in the
future.
4. Structural transformation
4.1. The upscale opportunities
The focus now is on the products that can elevate the sophistication level of the
countries’ exports
. Those type of products are the upscale products, products with an
“income content” (PRODY)
higher
than the country’s average sophistication level
17
start the process of structural transformation, in order to improve the overall
productivity of the country and the consequent increase of the standards of living for
their citizens. Assessing all the products with RCA<1 that China exports, Figure 5 gives
us the same analysis as before, crossing the pure densities and the value increment
indexes, just for positive levels.
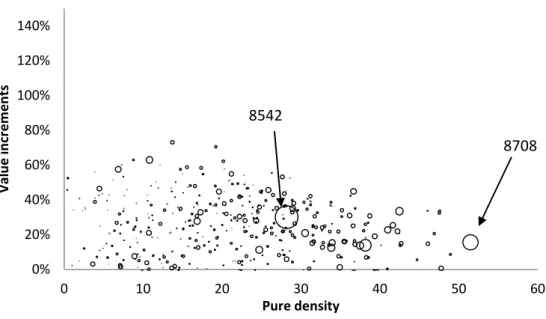
Figure 5: The Upscale opportunities for China
Source: Author’s calculations. Circles are proportional to the export shares of each product in the total expor
ts made by China
Keeping the minimum pure density level as before, the IDA, China has 212
upscale products larger than the IDA (=17,84). Leading the upscale opportunities, in
terms of density level,
comes “8708
-
Parts and accessories of the motor vehicles
…”
with an export share of 0,9% in China’s total exports.
The product with the largest
export share in which China is not specialized
is “8542
-
Electronic integrated circuits
and microassemblies” (1,92%). Also this product has a pure density index higher th
an
the IDA, suggesting that it is a product related to the current specialization pattern of
China that can elevate the sophistication level of the Chinese export basket.
0%
20%
40%
60%
80%
100%
120%
140%
0
10
20
30
40
50
60
Val
u
e
i
n
cr
e
m
e
n
ts
Pure density
18
Figure 6: The upscale opportunities for India
Source: Author’s calculations. Circles are proportional to the export shares of each product in the total exports made by India
As for India, Figure 6 mimics the previous Figure 5. India has 175 upscale
products higher than our IDA measure. The product closer to the Indian overall
capab
ilities is “8481
-
Taps, cocks, valves and similar appliances for pipes, boiler shells”
with an export share of 0,3% in Indian total exports. The product with the highest export
share of the upscale opportunities is “3004
-Medicaments (excluding goods of
heading
…)” with an export share of 2% in India’s total exports.
In Appendix 2 we mimic the work done for India and China and present visual
figures for a sample of countries worldwide. Those countries are: Brazil, Portugal,
Spain, Russia, Madagascar, Korea, Turkey, Germany and USA. There we can see that
the more developed countries, like USA and Germany, have products with higher
densities, suggesting
that those products are “ready” to start developing comparative
advantages. Opposing that, we have Madagascar and Russia, countries that have much
more lower levels of the density index for the upscale opportunities, suggesting that a
structural transformation is harder to achieve for these countries. In an intermediate
0%
20%
40%
60%
80%
100%
120%
140%
0
10
20
30
40
50
60
Val
u
e
In
cr
e
m
e
n
ts
Pure density
3004
19
situation we have countries like Portugal, Turkey, Korea or Spain, which are on a better
situation for a structural transformation, with a range of products that can elevate the
overall sophistication level of their export basket, in order to make them more
productive.
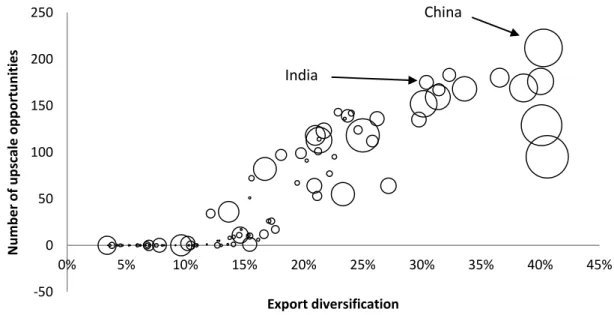
However to fully assess these findings we need some international outlook. To
do so we are going to compute the number of upscale opportunities, higher than the
IDA, for all the countries in our sample. In Figure 7, we cross the number of upscale
products with the export diversification index. In our sample, China ranks 1
st
and India
5
th
in the number of upscale opportunities higher than our benchmark measure IDA.
Again the low income countries are the worst case; most have zero upscale
opportunities. Figure 7 points to a positive relation between the number of upscale
products and export diversification.
Figure 7: Upscale opportunities
–
International outlook
Source: Author’s calculations. Circles are proportional to the export shares of each country in the total World’s exports
Note: See Appendix 1 for all the countries results
-50
0
50
100
150
200
250
0%
5%
10%
15%
20%
25%
30%
35%
40%
45%
N
u
m
b
e
r
o
f u
p
scale
o
p
p
o
rtu
n
ities
Export diversification
China
20
4.2. Analyzing the upscale opportunities
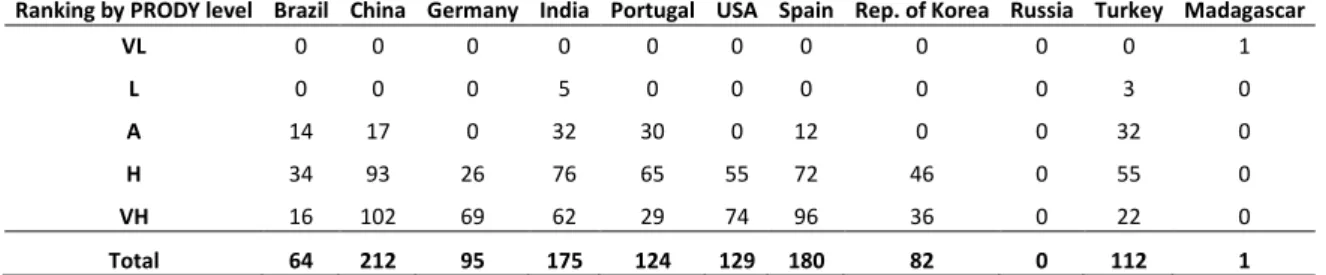
First, we focus on the value aspect of the upscale opportunities. On Table 4 we
have the number of upscale opportunities divided by PRODY level for the products in
our sample of countries.
Table 4: How valuable are the upscale opportunities
Ranking by PRODY level Brazil China Germany India Portugal USA Spain Rep. of Korea Russia Turkey Madagascar
VL
0
0
0
0
0
0
0
0
0
0
1
L
0
0
0
5
0
0
0
0
0
3
0
A
14
17
0
32
30
0
12
0
0
32
0
H
34
93
26
76
65
55
72
46
0
55
0
VH
16
102
69
62
29
74
96
36
0
22
0
Total
64
212
95
175
124
129
180
82
0
112
1
Source: Author’s calculations. Note: the PRODY levels correspond to the five quintiles in the PRODY index for all the product
s in
the sample. The five levels are: Very Low (VL, bottom 20%), Low (L, 20%-40%); Average (A, 40%-60%); High (H, 60%-80%)
and Very High (VH, top 20%).
Regarding China, the country has upscale opportunities in three categories:
average, high and very high, being the last one the category with the most products. As
for India, the country has opportunities in four of the five classes. Like expected, the
more developed countries, like USA and Germany, have upscale opportunities only in
the two higher classes. One curious case is Madagascar. The only upscale opportunity is
on the range of the lowest PRODY level products. This happens because the average
sophistication level of the country
’s export basket
is very low, so even the not so high
“income content” goods
can elevate the average sophistication level of the country
’s
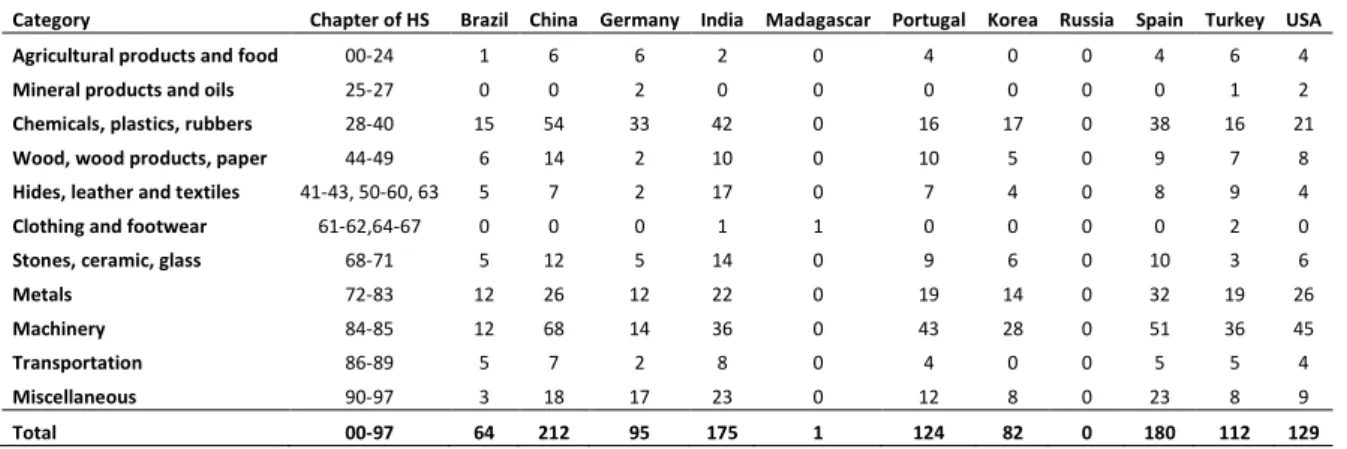
21
products, followed by “Chemicals, plastics, rubbers” with 54 products. India is the
opposite, has more opportunities in “Chemicals, plastics, rubbers”, 42 products, and in
second place “Machinery” with 36 products.
Table 5: Upscale opportunities by product category
Category Chapter of HS Brazil China Germany India Madagascar Portugal Korea Russia Spain Turkey USA
Agricultural products and food 00-24 1 6 6 2 0 4 0 0 4 6 4
Mineral products and oils 25-27 0 0 2 0 0 0 0 0 0 1 2
Chemicals, plastics, rubbers 28-40 15 54 33 42 0 16 17 0 38 16 21
Wood, wood products, paper 44-49 6 14 2 10 0 10 5 0 9 7 8
Hides, leather and textiles 41-43, 50-60, 63 5 7 2 17 0 7 4 0 8 9 4
Clothing and footwear 61-62,64-67 0 0 0 1 1 0 0 0 0 2 0
Stones, ceramic, glass 68-71 5 12 5 14 0 9 6 0 10 3 6
Metals 72-83 12 26 12 22 0 19 14 0 32 19 26
Machinery 84-85 12 68 14 36 0 43 28 0 51 36 45
Transportation 86-89 5 7 2 8 0 4 0 0 5 5 4
Miscellaneous 90-97 3 18 17 23 0 12 8 0 23 8 9
Total 00-97 64 212 95 175 1 124 82 0 180 112 129