Universidade do Minho
Escola de Economia e Gestão
João Pedro Pereira da Silva
The performance of US
Green Mutual Funds
Maio de 2016 The pe rf or m an ce of U S Gr een M utu al F und s Joã o Ped ro P er ei ra da Sil va UMin ho | 201 6
Universidade do Minho
Escola de Economia e Gestão
João Pedro Pereira da Silva
The performance of US
Green Mutual Funds
Tese de Mestrado em Finanças
Trabalho efectuado sob a orientação do
Professor Doutor Nelson Manuel P. B. Areal
ii Declaração
Nome: João Pedro Pereira da Silva
Número do Cartão de Cidadão: 14426528
Endereço eletrónico: [email protected] Escola: Escola de Economia e Gestão
Departamento: Gestão
Designação do Mestrado: Finanças
Tema: The performance of US Green Mutual Funds
Orientador: Prof. Dr. Nelson Manuel Pinho Brandão Costa Areal Ano de Conclusão: 2016
É autorizada a reprodução integral desta dissertação apenas para efeitos de investigação, mediante declaração escrita do interessado, que a tal se compromete.
Universidade do Minho,___/___/_____
Assinatura:_____________________________________________________________ (João Pedro Pereira da Silva)
iii
Acknowledgments
It is with a huge pride and happiness that I have finally finished my dissertation. After a long journey to conclude my study, it is now important to make some acknowledgments to the persons who supported me in this project.
Firstly, a special thanks to my supervisor Professor Nelson Areal. Throughout this year he always showed himself available to answer my questions. Without his help I would not be able to perform such study.
I also want to thank all the professors from the Master in Finance that, directly or indirectly, helped me with this dissertation.
A special thanks to my parents, Isaura Pereira and Jaime Silva, and to my two sisters, Catarina Silva and Natália Silva, who have always supported me in the hard times.
I also want to thank to my girlfriend who supported me a lot, always giving me strength to continue.
And last but not least, my sincere thanks to my friends, especially to António Arantes, Carlos Araújo, Diogo Rodrigues, João Castanho, Martim Pinto and Miguel Calheiros. Their support was always very important when I occasionally needed an extra help.
iv Abstract
In this study, I analyzed the performance of 16 US green mutual funds during the period from May 1990 to September 2014. The green funds were identified by the US SIF website on January 31, 2016. I compared the performance of the green funds against the market, using two benchmarks, a general market benchmark (S&P500) and a benchmark of the sector (KLD400).
The findings of this study suggest a neutral performance to the green funds. Regarding the investment style, I found evidence that green funds are more exposed to small caps, value stocks and companies with poor past performance. I also found that green funds have a higher exposure to companies with robust profitability.
This study applies the single-factor model of Jensen (1968), the four-factor model from Carhart (1997) and the newest five-factor model from Fama & French (2015), in their unconditional and conditional form (applying the approach of Christopherson et al. (1998)). The results state that the multifactor models, with the inclusion of the risk factors, are superior in explaining mutual fund returns. The results also show that the conditional models increase the explanatory power of the models.
Keywords: Green Investment, Green Mutual Funds, Socially Responsible Mutual Funds, Mutual Funds Performance.
v Resumo
Este estudo analisa o desempenho de 16 fundos de investimento verdes dos EUA durante o período de Maio de 1990 a Setembro de 2014. Os fundos verdes foram identificados através do website US SIF a 31 de Janeiro de 2016. Eu comparei o desempenho dos fundos verdes com o mercado, utilizando para isso dois benchmarks, um como referência geral do mercado (S&P500) e um como referência do sector (KLD400).
Os resultados sugerem um desempenho neutro para os fundos verdes. O estudo conclui que os fundos verdes estão mais expostos a ações de pequena capitalização, a ações de valorização e mais expostos a empresas com um mau desempenho passado. Os fundos verdes também estão mais expostos a empresas com uma rentabilidade robusta.
Este estudo aplica o modelo de Jensen (1968), o modelo quatro factores de Carhart (1997) e o mais recente modelo de cinco factores de Fama & French (2015), nas suas versões não condicional e condicional (aplicando a abordagem de Christopherson et al. (1998)). Os resultados indicam que os modelos multifactor, com a inclusão dos fatores de risco, são superiores a explicar a performance dos fundos. Os resultados também sugerem que os modelos condicionais aumentam o poder explicativo dos modelos.
Palavras-chave: Investimento Verde, Fundos de Investimento Verde, Fundos de Investimento Socialmente Responsáveis, Desempenho de Fundos de Investimento.
vi
Table of Contents
1. Introduction ... 1
2. Literature review ... 4
2.1. A brief history on socially responsible investment ... 4
2.2. The performance of conventional mutual funds ... 5
2.3. The performance of socially responsible investment funds ... 5
2.4. The performance of green mutual funds ... 9
3. Methodology ... 13
3.1. Introduction ... 13
3.2. Unconditional Models ... 14
3.2.1. Jensen (1968) one-factor model ... 14
3.2.2. Carhart (1997) four-factor model ... 14
3.2.3. Fama and French (2015) five-factor model ... 15
3.3. Conditional Models ... 15
3.3.1. Conditional Jensen (1968) one-factor model... 17
3.3.2. Conditional Carhart (1997) four-factor model ... 17
3.3.4. Conditional Fama and French (2015) five-factor model ... 18
4. Data ... 19
5. Empirical Results ... 23
5.1 Performance of the Unconditional Models ... 23
5.1.1. Jensen (1968) one-factor model ... 23
5.1.2. Carhart (1997) four-factor model ... 24
5.1.3. Fama and French (2015) five-factor model ... 27
5.2. Performance of the Conditional Models ... 28
vii
5.2.2. Full Conditional Carhart (1997) four-factor model ... 30
5.2.3. Full Conditional Fama & French (2015) five-factor model ... 32
5.3. General analysis of the performance by model ... 35
6. Conclusions ... 37
7. References ... 39
8. Web References ... 44
viii List of tables
TABLEI-LIST OF US GREEN MUTUAL FUNDS ... 22
TABLEII–EMPIRICAL RESULTS OF THE UNCONDITIONAL ONE-FACTOR MODEL ... 23
TABLEIII–EMPIRICAL RESULTS OF THE UNCONDITIONAL FOUR-FACTOR MODEL ... 25
TABLEIV–EMPIRICAL RESULTS OF THE UNCONDITIONAL FIVE-FACTOR MODEL ... 27
TABLEV–EMPIRICAL RESULTS OF THE FULL CONDITIONAL ONE-FACTOR MODEL ... 29
TABLEVI–EMPIRICAL RESULTS OF THE FULL CONDITIONAL FOUR-FACTOR MODEL ... 31
TABLEVII–EMPIRICAL RESULTS OF THE FULL CONDITIONAL FIVE-FACTOR MODEL ... 33
1 1. Introduction
The world has become increasingly more concerned about environmental and social issues. The investors are changing their style of investment, becoming more socially and environmentally responsible when they make their investment decisions, taking into account some concerns like the global warming, recycling, civil rights and nuclear energy (Climent & Soriano (2011); Chung et al. (2012); Muñoz et al. (2014)).
Keefe (2007) defends that we are entering in a new world of sustainable investing, where there is a full integration of environmental, social and governance (EGS) factors into financial analysis and decision-making.
Historically, some efforts have been made to change mentalities. Important steps towards that occurred since the adoption of the Kyoto Protocol1 at the Earth Summit in Rio de Janeiro, Brazil, in 1992, which is considered a milestone in the international negotiations on tackling climate change. This was the first time that the reduction of the greenhouse gas emissions were established as targets for industrialized countries. Then, the Kyoto Protocol in 1997 and the Copenhagen climate change conference in 2009 sought to alleviate or curb serious damage to the ecological system (Chung et al. 2012). More recently, other attempts were made in order to improve the main goals of the Kyoto Protocol, like the Doha Conference (Qatar) on 2012, the Climate Change Conferences in Warsaw, Poland, in 2013 and Lima, Peru, in 2014. In 2015, the COP21, also known as the 2015 Paris Climate Conference, was a pioneer in over 20 years of United Nations negotiations to achieve a legally binding and universal agreement on climate change, aiming to keep global warming below 2°C (UNFCCC COP 21 Paris France - 2015 Paris Climate Conference 2015) (COP 21, 2015).
Mutual funds are financial products, in which a group of investors apply their savings with the expectation of getting a positive return. The first mutual fund was founded in Netherlands, in 1774. However, just in 1824 appeared in the United States (Elton & Gruber, 2011).
This type of investment collects money from many investors with the purpose of investing in securities such as stocks, bonds and similar assets. The investors take advantage of many benefits
1 The Kyoto Protocol is an international agreement linked to the United Nations Framework Convention on Climate Change (FCCC). The goal is to
reach stabilization of greenhouse gas concentration in the atmosphere by restricting the level of greenhouse gas emissions by nations which have signed and ratified the protocol. (http://unfccc.int/kyoto_protocol/items/2830.php)
2
like risk diversification, professional management and a great liquidity. Individually, investors would not be able to achieve so many benefits. The portfolios of the mutual funds are constructed to match the investment objectives stated in its prospectus. The investors use those prospectus to see if the investment objectives of certain mutual fund are in line with their beliefs.
Today, due to the growing concerns about social and environmental issues, the beliefs of the investors are changing, bringing a new line of mutual funds: the socially responsible mutual funds.
The growing demand for long-term competitive financial returns along with positive societal and environmental impact reflects the dramatic growth in the assets and the number of mutual funds considering EGS criteria. In fact, according to US SIF2 2014 the value of assets under management using Socially Responsible Investing strategies in the United States expanded from $3.74 trillion at the start of 2012 to $6.57 trillion at the start of 2014, an increase of 76%. Another fact is that this type of assets represented nearly 18% of the $36.8 trillion in total assets under management in the United States, tracked by Cerulli Associates. Indeed, climate change is the most significant specific environmental factor taken into consideration by money managers and institutional investors in terms of assets under management, affecting $275.6 billion and $551.5 billion, respectively (US SIF 2014).
Despite the fact that it is a recent topic, there are many studies in finance literature discussing and analyzing the performance of the funds that invest with environmental and social concerns. It is suggested by the literature that these type of funds generally have a similar performance compared to conventional funds and even compared to the market (Hamilton et al. (1993); Statman (2000); Bauer et al. (2005); Bello (2005); Cortez et al. (2009); Cortez et al. (2012); Utz & Wimmer (2014)).
However, nowadays, a new concept has emerged – green investment. Chang et al. (2012) point that green investments are a subset of the Socially Responsible Investing, with more emphasis to environmental issues, like companies that minimize resource usage in production, companies that produce renewable energy and firms that produce ecologically friendly products. This way, green investing appeals to investors that desire to invest in areas that reflect their values on the
2 US SIF – The Forum for Sustainable and Responsible Investment is the US membership association for professionals, firms, institutions and
organizations engaged in sustainable, responsible, and impact investing. US SIF and its members advance investment practices that consider environmental, social and corporate governance criteria to generate long-term competitive financial returns and positive societal impact. (http://www.ussif.org/index.asp)
3
environment, climate change and a sustainable economy (Mallett & Michelson 2010). Problems such as climate change, energy shortage and global warming are making people further worried about this topic and, all over the world, people are taking extra attention to the green investment.
In this context, I intend to focus my dissertation in this topic by evaluating the performance of US green mutual funds. The main point is to compare the performance of the green funds with the market, following the line of the studies applied by White (1995), Statman (2000), Cortez et al. (2009) and Cortez et al. (2012). In order to do so, two benchmarks will be used, a conventional benchmark (S&P500) and a benchmark of the sector (MSCI KLD 400).
Currently, there is no clear answer on whether green funds have a performance that is statistically different from the market. This subject still raises some doubts to those who want to consider environmental issues in their investments. The motivation to conduct this study stems from the fact that only very few studies about the performance of green mutual funds were performed until now. This way, this research will provide updated results that can be useful to other academics and to those who want to consider environmental concerns in their investments.
For the performance evaluation, both single-factor and multi-factor models (Jensen (1968) one-factor model; Carhart (1997) four-one-factor model; Fama & French (2015) five-one-factor model) will be used. Moreover, the conditional approach of Christopherson et al. (1998) will be applied in order to allow for both alpha and beta to be time-varying.
This study is organized as follows. The next section discusses the performance of the conventional, socially responsible and green mutual funds. Section 3 presents the methodology used to assess fund performance. The subsequent section describes the data. Next, the results of the empirical analysis are provided and discussed and, finally, the last section summarizes the main results.
4 2. Literature review
The majority of studies in this area consider broad socially responsible investments. The literature review starts by presenting a brief history of socially responsible funds, followed by some literature on the performance of conventional mutual funds, socially responsible funds and finally green funds. As the green funds are a recent topic, the literature on the socially responsible funds will be mentioned in order to give us a good background about this theme.
2.1. A brief history on socially responsible investment
In the 16th century, in US, George Fox founded the Quakers. Their main goal was to apply social criteria to investing, like human equality and non-violence criteria (Bauer et al. 2005). In the 17th century the same group refused to profit from weapon and slave trade when they settled in North America. In the 1920s, the Methodist Church in the UK avoided investing in “sinful” companies, such as companies involved in the production of alcohol, tobacco and weapons and in gambling. In 1928, the first mutual fund named Pioneer Fund was created, incorporating screens based on religious traditions, avoiding companies involved in pork production, pornography, gambling and in interest-based financial institutions. This type of ethical investment, more based on religious traditions, evolved to investments more based on personal and social concerns. Since the 1960s, some social campaigns, such as the anti-war and the anti-racism movements, have made investors aware of the social consequences of their investments. This way, in 1971, the first open-end socially responsible (SR) mutual fund, the Pax World Fund, was founded in the United States. This fund was created for investors opposed to the Vietnam war with the purpose of avoiding investments in weapon contractors. The world has witnessed some events that got the investors’ attention. In the 1980s, the racist system of apartheid in South Africa, in 1986, the Chernobyl disaster and in 1989, the oil spill of the supertanker Exxon Valdez near Alaska. In the last twenty years, with these and other environmental and social disasters, investors have become more aware of the negative consequences of industrial development. Mainly, in the past decade, the world has observed a huge growth of the socially responsible funds, taking into account issues like environmental protection, human rights and labor relations (Renneboog et al. 2008a).
In fact, we have witnessed a huge growth of these types of funds all over the world. According to the US SIF 2005, the professional managed assets of SR portfolios, reached $2.3 trillion in 2005, growing by 1200% from the $162 billion a decade earlier, representing about 10% of total
5
assets under management (US SIF 2005). More recently, the US SIF 2014 stated that the same type of funds expanded from $3.74 trillion at the start of 2012 to $6.57 trillion at the start of 2014, an increase of 76%, representing nearly 18% of the $36.8 trillion in total assets under management in the United States (US SIF 2014). In Europe, from 2005 to 2013, the European Sustainability theme assets have increased 11% per year to reach €59 billion in 2013. Since 2005, it has grown on average 30.7% (Eurosif 2014).
2.2. The performance of conventional mutual funds
The performance of mutual funds has been widely studied by academics. Several authors, such as Wermers (2000), Farnsworth et al. (2002) and Otten & Bams (2004), studied the US market. The first author stated that funds holding stocks outperform the market. Farnsworth et al. (2002), with a 188 sample of US mutual funds in stocks, through the stochastic discount factor model, found a neutral performance compared to the market. The last authors, Otten & Bams (2004), with a sample of 2436 domestic mutual funds, using conditional and unconditional models, also found a neutral performance.
Other studies were performed outside the US market. Otten & Bams (2002) studied a sample of 506 domestic mutual funds in the European market and, through conditional and unconditional models, they concluded that mutual funds were able to overperform the market and create value to investors. On the other hand, Christensen (2013) applying single and multi-factor models, found that Danish investment funds showed a neutral performance. Bialkowski & Otten (2011), applying the Carhart (1997) four-factor model, also found that domestic Polish mutual funds presented a neutral performance.
2.3. The performance of socially responsible investment funds
One of the first studies in this area is the study of Moskowitz (1972), which analyzes the financial performance of individual companies that have good records of social performance against companies that are less socially responsible. The author found a positive relationship between corporate social responsibility and financial performance, concluding that this type of behavior is good for companies to invest in. Margolis & Walsh (2003) and Orlitzky et al. (2003), for example, also stated there is a positive relationship between corporate social responsibility and financial performance. However, we must interpret these results with caution, as they suffer from several methodological limitations, such us risk control, multiple dimensions used to measure
6
corporate financial performance and the data set, pointed out by, for example, McGuire et al. (1988) and Griffin & Mahon (1997).
The study of Moskowitz (1972) boosted the empirical studies on this topic. Some studies report a superior financial performance of certain SR criteria (Moskowitz (1972); Mallin et al. (1995); Derwall et al. (2005); Gil-Bazo et al. (2010)) and some state empirical evidence of a financial underperformance (Renneboog et al. (2008b); Cortez et al. (2012)). However, most of them report no significant differences between the financial performance of socially responsible investments and conventional investments (Hamilton et al. (1993); Guerard (1997); Goldreyer & Diltz (1999); Statman (2000); Bauer et al. (2005); Bello (2005); Renneboog et al. (2008a); Cortez et al. (2009); Cortez et al. (2012); Ortas et al. (2014); Utz & Wimmer (2014)).
Along the past years, researchers have provided a large number of studies concentrated in the question “Doing well while doing good?” by Hamilton et al. (1993)3. This study mentioned three alternative hypotheses about the relative returns of socially responsible portfolios and conventional portfolios. The third one stated that if the expected returns of socially responsible portfolios were higher than the expected returns of conventional portfolios, then the investors would be “doing well while doing good”.
Cortez et al. (2009) mentioned three different lines about the studies focusing on the relationship between social and financial performance. The first approach consists in the differences between the financial performance of individual companies that have good records of social performance and those that are less socially responsible (Moskowitz (1972); Margolis & Walsh (2003); Orlitzky et al. (2003)). The second approach involves the differences between the performances of indices that exclude companies with lower social records with conventional market indices. These studies have found that the performance of social indices is comparable to the performance of broad market indices (Guerard (1997); Kurtz & DiBartolomeo (1996); Sauer (1997); Statman (2006); Ortas et al. (2014)). The third and last approach involves the difference between the performance of socially responsible mutual funds relative to the performance of conventional mutual funds. Empirically, studies have shown a similar behavior relative to the performance of socially responsible funds and conventional funds.
3There are several studies about this topic, the vast majority are concentrated in US and Europe (mostly in UK). Galema et al. (2008) and Renneboog
7
However, based on portfolio theory, Rudd (1981) mentioned that portfolios constructed from a restricted universe of stocks, like socially responsible funds, will not be properly diversified due to the limited universe of such funds and, additionally, there will be filtering costs that would not be present in the construction of a portfolio of conventional funds (Cortez et al. 2012).
Conversely, Hill et al. (2007) and Kempf & Osthoff (2007), pointed out that portfolios composed of socially responsible stocks will benefit from improved performance in the long run, as a consequence of social screens representing filters that enable the identification and selection of firms with higher quality of management relative to their less responsible competitors. Cortez et al. (2009) also mentioned that screening practices allow fund managers to identify the best companies in terms of potential for profits, giving competitive returns to socially responsible funds (Cortez et al. 2012).
The growing concerns about the environmental and social issues have been a starting point to study the differences in the performance of the mutual funds when we adopt different investment strategies. The analysis of socially responsible funds is usually performed in a comparative perspective, namely relative to conventional mutual funds or market indices.
The majority of the studies focused on American funds concluded that socially responsible funds are not statistically different from the performance of the conventional funds. Hamilton et al. (1993), using Jensen´s (1968) alpha, found that for the period of 1981 to 1990, the performance of SR funds is similar to that of conventional ones, which may disappoint socially responsible investors who hope to do well while doing good. The study of Statman (2000), with a domestic sample of 31 socially responsible funds, and Bello (2005), with a domestic sample of 42 socially responsible funds, applying the Jensen (1968) alpha measure, for the 1990 – 1998 period and for the 1994 – 2001 period, respectively, also found no significant difference in investment performance between socially screened portfolios and conventional investments.
Evidence from the European market is similar to that of the American market. Leite & Cortez (2014) performed a multi-country (Austria, Belgium, France, Germany, Italy, the Netherlands, UK and Spain) study based on 54 international socially responsible funds, applying a conditional five-factor model (the four-five-factor model from Carhart (1997) plus an additional local five-factor) and they found a similar performance between socially responsible funds and conventional funds.
8
Using an international database, Bauer et al. (2005), between 1990 - 2001, also did not find evidence of significant differences in risk-adjusted returns between ethical and conventional funds using an international database containing 103 German, UK and US ethical mutual funds. This study applied a single-factor model (Jensen 1968) and a multi-factor model (Carhart (1997) four-factor model) and the authors concluded that a multi-four-factor approach was superior in explaining mutual fund returns. In terms of investment style, the authors stated that the ethical funds tend to be more exposed to small caps and to growth stocks than conventional funds. This exposure to growth stocks can be explained by the fact that value stocks often represent higher environmental risks, this way being more likely to be excluded from socially responsible funds (Cortez et al. 2012). In the other perspective, there are studies that compare the socially responsible funds with the market indices. In this line, studies focused on American market, such as Statman (2000) and Bello (2005), both using S&P500 and Domini 400 Social Index4 as benchmarks, found evidence that socially responsible funds underperform both benchmarks.
Differently from the American market, Cortez et al. (2009) performed a study focused on 88 socially responsible funds from Austria, Belgium, France, Germany, Italy, the Netherlands and UK, for the period of 1996 to 2007. Using both unconditional and conditional models (Christopherson et al. (1998)), the authors stated that the performance of socially responsible funds is similar to the performance of both conventional (MSCI AC World and MSCI AC Europe indices) and socially responsible (FTSE4Good Global and FTSE4Good Europe) benchmarks. The authors also observed that the conditional models lead to a slight improvement of performance estimates and the explanatory power of the models.
Cortez et al. (2012), using a sample composed of 39 funds for European markets (Austria, Belgium, France, Germany, Italy, the Netherlands and UK) and 7 funds for US market over the period from 1996 to 2008, found mixed results. For European markets global socially responsible funds showed similar performance compared to both conventional (MSCI AC World Index) and socially responsible (FTSE4Good Global) benchmarks. For US and Austrian funds, the authors showed evidence of underperformance. In line with the study of Cortez et al. (2009), the authors also found that using the conditional approach of Christopherson et al. (1998), in order to control for both time varying alphas and betas, the explanatory power of the models increases. In terms
9
of investment style, studies have shown that socially responsible funds tend to be more exposed to small caps and to growth stocks than conventional funds, being consistent with Bauer et al. (2005).
2.4. The performance of green mutual funds
In this specific study, the focus will be the performance of green mutual funds, a subset of socially responsible funds. However, why should we expect the green funds’ performance to be different from other types of funds?
Studies on the performance of socially responsible funds consider them as a homogenous group. However, SR funds consider various types of funds, such as religious funds and environmental funds, which have different investment strategies. Religious funds avoid industries considered sinful or unethical (alcohol or gambling, for example) and green funds seek industries with good records on environmental issues (Muñoz et al. 2014).
Climent & Soriano (2011) also observed that the growing concerns about the environmental issues on the part of investors, companies and governments, may lead to the possibility that one could anticipate profitable opportunities for businesses pursuing sustainable goals, which could make green funds different from the other type of funds. The industry factor is another important issue that should be taken into account in the analysis. It is typical that the constituent assets of environmental funds are highly concentrated within certain industries. Industries like mining, oil and gas may be underweighted and others like utilities overweighed in this kind of funds leading to performance biases. Green funds, SR funds and conventional funds will have a different industry composition. Benson et al. (2006) also concluded that the industry composition really matters and that green funds certainly have a different one. They might have a stronger weight on the natural resources or renewable industries.
In the finance literature, studies of green investing have been usually attached to a firm perspective, studying the linkage between corporate environmental behavior and corporate financial performance (Heinkel et al. (2001) for example).
At first, it may appear that companies applying measures to improve their environmental performance could suffer from additional costs and, consequently, a reduction in their financial results. Since we don’t have much diversification, by restricting the investment set, the risk could be increased (Rudd 1981), as was already mentioned in relation to socially responsible funds.
10
However, there are reasons to think that a good environmental performance may lead to a good financial performance. Ambec & Lanoie (2008) outline seven arguments that support that the companies with good records on environmental issues could increase their income or reduce their costs. Precisely, the revenues could be increased by better access to certain markets, differentiating products and selling pollution-control technology. The costs could be reduced by risk management and relations with external stakeholders, costs of material, energy and services, cost of capital and cost of labor. Ambec & Lanoie (2008) provide empirical evidence for each one.
Derwall et al. (2005) conducted a study using two mutually exclusive stock portfolios from American companies over the period from 1995 to 2003. They found evidence that the “most eco-efficient”5 portfolio largely outperformed the “less eco-efficient” portfolio. Their conclusions suggest that companies that consider environmental criteria in their investments may obtain considerable benefits. The author also concluded that the Carhart (1997) four-factor model, compared to the Jensen (1968) alpha, has a higher explanatory power of the performance.
Another study that investigated the effects of the application of green standards on companies’ financial returns was performed by Puopolo et al. (2015). The authors aim to answer the question “Does the market reward for going green?”. They analyzed the returns of a sample of 500 US companies adopting environmentally friendly standards from 2009 to mid-2014 and concluded that the “green-behavior” does not affect the financial returns required by investors.
In this line, considering that a company could have opportunities to generate a superior financial performance, it is interesting to analyze the performance of the green mutual funds from a comparative point of view.
As far as we know, White (1995) is the first study to analyze the performance of environmental funds, in the US and German markets. The author found that US green funds underperform the overall US market, while, in Germany, green funds do not perform differently from the German market.
Climent & Soriano (2011), with a sample of 7 US green funds, for the period of 1987-2009 and using the single-factor model (Jensen, 1968), found that US green mutual funds had lower performance compared to the market benchmark (S&P500). When the benchmark is the KLD400
5 “Eco-efficiency can be defined as the ratio of the value a company adds to the waste the company generates by creating that value” (Derwall et
11
(SR equity index) the performance is negative but not statistically significant. With the four-factor model from Carhart (1997), the authors also found that green funds underperform the market. However, when the author focused on a more recent period (2001-2009), the green funds showed neutral performance. They also demonstrated that green mutual funds are more exposed to small caps and growth stocks. The authors also confirmed the expectation that the multi-factor models, compared to the one-factor CAPM model, are superior in explaining mutual fund returns.
In relation to the conventional and SR funds, Climent & Soriano (2011) found that green funds underperform conventional and SR funds with similar characteristics. Chang et al. (2012), with a sample of 131 green mutual funds identified by US SIF and for a similar period of time, stated the same underperformance. However, Climent & Soriano (2011) also revealed that if we focused only in the period of 2001-2009, green funds had a similar performance.
Mallett & Michelson (2010) and Chung et al. (2012), for the periods of 1998-2007 and 2000-2009, respectively, found no significant differences in performance between US green mutual funds and their conventional peers.
In the European market, Ibikunle & Steffen (2015) performed a study between 1991-2014 period, applying both the one-factor CAPM model and the four-factor model of Carhart (1997). For the first model, the authors found that, in general, green funds underperform the market6, being consistent with Climent & Soriano (2011). For the four-factor model, the authors stated that same underperformance7. The authors also demonstrated that the multi-factor model does not improved the explanatory power of the model, which is against the findings of Climent & Soriano (2011).
In relation to the performance between green funds and conventional funds, Ibikunle & Steffen (2015) found that green mutual funds underperform conventional funds. However, over the last 5 years of the study, the green funds tend to show similar performance relative to conventional ones. In this study, the green mutual funds are more exposed to small caps and growth stocks, being consistent with Climent & Soriano (2011).
Another interesting study focused on both green European and US funds, for the period from 1994 to 2013, with a sample of 18 US and 89 European green funds, was performed by Muñoz
6 The authors used the global MKT factor portfolio from the Kenneth R. French data library, the Stoxx Europe 600 Index and the S&P Global
Alternative Energy Index as market proxy.
12
et al. (2014). The authors appliedthe Carhart (1997) four-factor model and stated that for the US market, with the domestic equity portfolio, green funds do not perform worse than the market, but with the global equity portfolio, green funds show evidence of underperformance.
These studies have shown inconclusive results. This is a very recent topic, with few studies analyzing the financial performance of the green mutual funds. Despite this, I aim to contribute to the discussion about this topic, comparing the performance of the green funds with the market.
13 3. Methodology
3.1. Introduction
In this third chapter, the methodology that will be applied in this study will be presented. First, Jensen´s (1968) alpha, the four-factor model of Carhart (1997) and the five-factor model of Fama & French (2015) in their unconditional form are implemented.
Jensen´s (1968) alpha captures the risk-adjusted average abnormal return in excess of a market benchmark. However, this model has been criticized by some authors (e.g. Fama & French (1992)), stating that the one-factor CAPM framework does not sufficiently explain the expected stock returns. In the literature there is a general agreement that multifactor models are a much more useful characterization of portfolio returns than single-index models (Carhart (1997); Bauer et al. (2005); Derwall et al. (2005); Climent & Soriano (2011)). However, several authors used the well-known Jensen (1968) alpha and a multi-factor model to measure the performance of the funds and I intend to follow the same methodology.
In this context, I will also implement the model that has become the standard measure for evaluating mutual fund performance, the model proposed by Carhart (1997), which is a further extension of both the original CAPM and the Fama & French (1993) three-factor model (Ibikunle & Steffen, 2015).
The application of the Fama & French (2015) five-factor model is very recent in the performance evaluation literature. This model is an extension of the Fama & French (1993) three-factor model, adding two risk three-factors, the investment (CMA) and the profitability (RMW). With this model, it has become possible to understand the investment strategies performed by the funds’ managers, since the authors observed that much of the mean variation of returns related to the investment and the profitability is not explained by the Fama & French (1993) three-factor model. The authors also stated that the Fama & French (2015) five-factor model showed better performance estimates than their previous Fama & French (1993) three-factor model.
The unconditional models assume that the expected returns and risk are invariant over time, regardless of market conditions. As these models do not consider time-varying risk and returns over time, they might be biased, since their application may lead to incorrect performance estimates (Aragon & Ferson 2008, p.118). This way, the full conditional model of Christopherson et al. (1998) will be implemented as, for example, Cortez et al. (2009), Cortez et al. (2012) and Leite & Cortez (2014) also did.
14
Farnsworth (1997, pp.23) stated that the conditional performance evaluation method “refers to the measurement of performance of a managed portfolio taking into account the information that was available to investors at the time the returns were generated”. The main point of the application of the conditional models is to incorporate the public information variables that affect the state of the economy to predict returns and risk. The approach of Christopherson et al. (1998) extends the model of Ferson & Schadt (1996) by allowing both alpha and beta to be time-varying. The conditional model of Ferson & Schadt (1996) only incorporates time-varying betas, but later, Ferson et al. (2008) showed that the time-varying alpha term should be included on the regression in order to obtain unbiased estimates of conditional models.
In order to determine the importance of the introduction of these conditional models, several studies applied the Wald test, such as Cortez et al. (2009), Cortez et al. (2012) and Leite & Cortez (2014). This test tests the null hypothesis that the coefficients of public information variables (conditional alphas, conditional betas and the joint of conditional alphas and betas) are jointly equal to zero. I will implement this test in this study to determine the existence of time-varying aphas and time-varying betas.
3.2. Unconditional Models
3.2.1. Jensen (1968) one-factor model
Jensen´s (1968) alpha is used as an unconditional measure of performance and is one of the most used by academics. This measure is the intercept (𝛼𝑝) of the CAPM-based following regression:
𝑟𝑝,𝑡 = 𝛼𝑝+ 𝛽𝑝𝑟𝑚,𝑡 + 𝜀𝑝,𝑡 (1)
where 𝑟𝑝,𝑡 represents the excess return of fund p over period t, 𝛽𝑝 is the systematic risk of the fund p, 𝑟𝑚,𝑡 represents the market`s excess return over the period t, and 𝜀𝑝,𝑡 is the error term. A statistically significant positive (negative) alpha indicates a superior (inferior) performance of the fund manager in relation to the market.
3.2.2. Carhart (1997) four-factor model
The four-factor Carhart (1997) model will be implemented. This performance model includes four risk factors: the three factors considered by Fama & French (1993), i.e., market (𝑟𝑚,𝑡), size
15
(𝑆𝑀𝐵𝑡) and book-to-market (𝐻𝑀𝐿𝑡) factors, plus an additional factor that represents the 1-year momentum strategy (𝑀𝑂𝑀𝑡). The model is expressed by the following equation:
𝑟𝑝,𝑡 = 𝛼𝑝+ 𝛽𝑃𝑟𝑚,𝑡+ 𝛽𝑆𝑀𝐵(𝑆𝑀𝐵𝑡) + 𝛽𝐻𝑀𝐿(𝐻𝑀𝐿𝑡) + 𝛽𝑀𝑂𝑀(𝑀𝑂𝑀𝑡) + 𝜀𝑝,𝑡 (2) where 𝑟𝑝,𝑡 represents the excess return of fund p, 𝑟𝑚,𝑡 represents the market`s excess return over the period t, 𝑆𝑀𝐵𝑡 (small minus big) is the difference in returns between a portfolio of small stocks and a portfolio of large stocks, 𝐻𝑀𝐿𝑡 (high minus low) is the difference between a portfolio of high book-to-market stocks and a portfolio of low book-to-market stocks, 𝑀𝑂𝑀𝑡 (momentum) is the difference in return between a portfolio of past 1-year winners and a portfolio of past 1-year losers and the 𝛽𝑃, 𝛽𝑆𝑀𝐵, 𝛽𝐻𝑀𝐿 and 𝛽𝑀𝑂𝑀 are the factor coefficients (betas on each of the factors).
3.2.3. Fama and French (2015) five-factor model
The five-factor model of Fama & French (2015) is one of the most recent model of performance evaluation. Fama & French (2015) stated that with the addition of profitability and investment factors, the value factor of the Fama & French (1993) three-factor model becomes redundant for describing average returns on the sample that the authors examined. The equation is the following:
𝑟𝑝,𝑡 = 𝛼𝑝+ 𝛽𝑃𝑟𝑚,𝑡+ 𝛽𝑆𝑀𝐵(𝑆𝑀𝐵𝑡) + 𝛽𝐻𝑀𝐿(𝐻𝑀𝐿𝑡) + 𝛽𝑅𝑀𝑊(𝑅𝑀𝑊𝑡) + 𝛽𝐶𝑀𝐴(𝐶𝑀𝐴𝑡) + 𝜀𝑝,𝑡
(3)
where 𝑟𝑝,𝑡 represents the excess return of fund p, 𝑟𝑚,𝑡 represents the market`s excess return over the period t, 𝑆𝑀𝐵𝑡 (small minus big) is the difference in returns between a portfolio of small stocks and a portfolio of large stocks, 𝐻𝑀𝐿𝑡 (high minus low) is the difference between a portfolio of high book-to-market stocks and a portfolio of low book-to-market stocks, 𝑅𝑀𝑊𝑡 (profitability factor) is the difference between the returns on diversified portfolios of stocks with robust and weak profitability, 𝐶𝑀𝐴𝑡 (investment factor) is the difference between the returns on diversified portfolios of the stocks of low and high investment firms (conservative and aggressive) and the 𝛽𝑃, 𝛽𝑆𝑀𝐵, 𝛽𝐻𝑀𝐿 , 𝛽𝑅𝑀𝑊 and 𝛽𝐶𝑀𝐴 are the factor coefficients (betas on each of the factors).
3.3. Conditional Models
In this study, only the full conditional model of Christopherson et al. (1998) will be applied. The conditional alphas and betas are defined as linear functions of a vector of predetermined
16
information variables, 𝑍𝑡−1, that represents the public information available at time t-1 for predicting returns at time t.
This way the full conditional equation of Jensen`s (1968) alpha will be the following: 𝑟𝑝,𝑡 = 𝛼𝑝+ 𝐴′𝑝𝑧𝑡−1+ 𝛽𝑝𝑟𝑚,𝑡 + 𝛽′𝑝(𝑧𝑡−1𝑟𝑚,𝑡) + 𝜀𝑝,𝑡 (4) where the 𝑟𝑝,𝑡 is the excess return of fund p over period t, the 𝑟𝑚,𝑡 is the excess return of the market over period t, the 𝛼𝑝 is an average alpha, the 𝐴′𝑝 is a vector that measures the response of the conditional alpha to the information variables, 𝑧𝑡−1= 𝑍𝑡−1− 𝐸(𝑍) is a vector of deviations of 𝑍𝑡−1 from the (unconditional) average values, 𝛽𝑝 is an average beta, which represents the (unconditional) mean of the conditional betas and 𝛽′𝑝 is the vector that measures the response of the conditional beta of portfolio p to the public information variables. The conditional approach to multi-factor models is straightforward. Replacing the market return by a set of factor returns, the previous equation can be expressed as:
𝑟𝑝,𝑡 = 𝛼𝑝+ 𝐴′𝑝𝑧𝑡−1+ 𝛽𝑝𝜆𝑘,𝑡 + 𝛽′𝑝(𝑧𝑡−1𝜆𝑘,𝑡) + 𝜀𝑝,𝑡 (5) where 𝜆𝑘,𝑡 are the vector of factor returns.
To measure the state of the economy, Ferson & Schadt (1996) and Christopherson et al. (1998), among others, used five public information variables: the short term interest rate (TB) that is “a measure of expected inflation” (Fama & Schwert, 1977), the term spread (TS), which is a measure of the slope of the term structure of interest rates (economic conditions/cycles in a short term perspective (Fama & French, 1989)), the default spread (DS), that is the difference between the yields of high risk bonds and low risk bonds (economic conditions/cycles in a long term perspective (Fama & French, 1989)), the dividend yield (DY) of a market index (economic conditions/cycles in a long term perspective (Fama & French, 1989); Cochrane (2008)) and a variable dummy (D) for the month of January, resulting the evidence of higher returns in January (Keim & Stambaugh, 1986). The first four variables are considered as measures of the state of the economy, the January dummy aims to capture seasonality in returns and risk.8
8The January or turn-of-the-year effect is defined in the financial literature as positive risk-adjusted premium for holding a security in the month of
January. Previous evidence seems to suggest that this January seasonality can be explained by the corresponding seasonality in the risk factor. (Cortez et al. 2009)
17
In this study, I follow Cortez et al. (2009) and use these five public information variables.
3.3.1. Conditional Jensen (1968) one-factor model
The full conditional model of the one-factor model is represented as:
𝑟𝑝,𝑡 = 𝛼𝑝+ 𝛼𝑇𝐵(𝑇𝐵𝑡−1) + 𝛼𝑇𝑆(𝑇𝑆𝑡−1) + 𝛼𝐷𝑆(𝐷𝑆𝑡−1) + 𝛼𝐷𝑌(𝐷𝑌𝑡−1) + 𝛼𝐷(𝐷𝑡) + 𝛽𝑝𝑟𝑚,𝑡+ 𝛽𝑇𝐵(𝑇𝐵𝑡−1∗ 𝑟𝑚,𝑡) + 𝛽𝑇𝑆(𝑇𝑆𝑡−1∗ 𝑟𝑚,𝑡) +
𝛽𝐷𝑆(𝐷𝑆𝑡−1∗ 𝑟𝑚,𝑡) + 𝛽𝐷𝑌(𝐷𝑌𝑡−1∗ 𝑟𝑚,𝑡) + 𝛽𝐷(𝐷𝑡∗ 𝑟𝑚,𝑡) + 𝜀𝑝,𝑡
(6)
where 𝑇𝐵𝑡−1, 𝑇𝑆𝑡−1, 𝐷𝑆𝑡−1 and 𝐷𝑌𝑡−1 represents the public information variables short-term interest rate, term spread, default spread and dividend yield, respectively, and 𝐷𝑡 represents a dummy variable that assumes a value of 1 in the month of January and assumes a value of 0 in the other months. The same applies to the following two equations.
3.3.2. Conditional Carhart (1997) four-factor model
The full conditional model of the four-factor model is represented as:
𝑟𝑝,𝑡 = 𝛼𝑝+ 𝛼𝑇𝐵(𝑇𝐵𝑡−1) + 𝛼𝑇𝑆(𝑇𝑆𝑡−1) + 𝛼𝐷𝑆(𝐷𝑆𝑡−1) + 𝛼𝐷𝑌(𝐷𝑌𝑡−1) + 𝛼𝐷(𝐷𝑡) + 𝛽𝑝𝑟𝑚,𝑡+ 𝛽𝑇𝐵(𝑇𝐵𝑡−1∗ 𝑟𝑚,𝑡) + 𝛽𝑇𝑆(𝑇𝑆𝑡−1∗ 𝑟𝑚,𝑡) + 𝛽𝐷𝑆(𝐷𝑆𝑡−1∗ 𝑟𝑚,𝑡) + 𝛽𝐷𝑌(𝐷𝑌𝑡−1∗ 𝑟𝑚,𝑡) + 𝛽𝐷(𝐷𝑡∗ 𝑟𝑚,𝑡) + 𝛽𝑆𝑀𝐵(𝑆𝑀𝐵𝑡) + 𝛽𝑇𝐵∗𝑆𝑀𝐵(𝑇𝐵𝑡−1∗ 𝑆𝑀𝐵𝑡) + 𝛽𝑇𝑆∗𝑆𝑀𝐵(𝑇𝑆𝑡−1∗ 𝑆𝑀𝐵𝑡) + 𝛽𝐷𝑆∗𝑆𝑀𝐵(𝐷𝑆𝑡−1∗ 𝑆𝑀𝐵𝑡) + 𝛽𝐷𝑌∗𝑆𝑀𝐵(𝐷𝑌𝑡−1∗ 𝑆𝑀𝐵𝑡) + 𝛽𝐷∗𝑆𝑀𝐵(𝐷𝑡∗ 𝑆𝑀𝐵𝑡) + 𝛽𝐻𝑀𝐿(𝐻𝑀𝐿𝑡) + 𝛽𝑇𝐵∗𝐻𝑀𝐿(𝑇𝐵𝑡−1∗ 𝐻𝑀𝐿𝑡) + 𝛽𝑇𝑆∗𝐻𝑀𝐿(𝑇𝑆𝑡−1∗ 𝐻𝑀𝐿𝑡) + 𝛽𝐷𝑆∗𝐻𝑀𝐿(𝐷𝑆𝑡−1∗ 𝐻𝑀𝐿𝑡) + 𝛽𝐷𝑌∗𝐻𝑀𝐿(𝐷𝑌𝑡−1∗ 𝐻𝑀𝐿𝑡) + 𝛽𝐷∗𝐻𝑀𝐿(𝐷𝑡∗ 𝐻𝑀𝐿𝑡) + 𝛽𝑀𝑂𝑀(𝑀𝑂𝑀𝑡) + 𝛽𝑇𝐵∗𝑀𝑂𝑀(𝑇𝐵𝑡−1∗ 𝑀𝑂𝑀𝑡) + 𝛽𝑇𝑆∗𝑀𝑂𝑀(𝑇𝑆𝑡−1∗ 𝑀𝑂𝑀𝑡) + 𝛽𝐷𝑆∗𝑀𝑂𝑀(𝐷𝑆𝑡−1∗ 𝑀𝑂𝑀𝑡) + 𝛽𝐷𝑌∗𝑀𝑂𝑀(𝐷𝑌𝑡−1∗ 𝑀𝑂𝑀𝑡) + 𝛽𝐷∗𝑀𝑂𝑀(𝐷𝑡∗ 𝑀𝑂𝑀𝑡) + 𝜀𝑝,𝑡 (7)
18
3.3.4. Conditional Fama and French (2015) five-factor model
The full conditional model of the five-factor model is represented as: 𝑟𝑝,𝑡 = 𝛼𝑝+ 𝛼𝑇𝐵(𝑇𝐵𝑡−1) + 𝛼𝑇𝑆(𝑇𝑆𝑡−1) + 𝛼𝐷𝑆(𝐷𝑆𝑡−1) + 𝛼𝐷𝑌(𝐷𝑌𝑡−1) + 𝛼𝐷(𝐷𝑡) + 𝛽𝑝𝑟𝑚,𝑡+ 𝛽𝑇𝐵(𝑇𝐵𝑡−1∗ 𝑟𝑚,𝑡) + 𝛽𝑇𝑆(𝑇𝑆𝑡−1∗ 𝑟𝑚,𝑡) + 𝛽𝐷𝑆(𝐷𝑆𝑡−1∗ 𝑟𝑚,𝑡) + 𝛽𝐷𝑌(𝐷𝑌𝑡−1∗ 𝑟𝑚,𝑡) + 𝛽𝐷(𝐷𝑡∗ 𝑟𝑚,𝑡) + 𝛽𝑆𝑀𝐵(𝑆𝑀𝐵𝑡) + 𝛽𝑇𝐵∗𝑆𝑀𝐵(𝑇𝐵𝑡−1∗ 𝑆𝑀𝐵𝑡) + 𝛽𝑇𝑆∗𝑆𝑀𝐵(𝑇𝑆𝑡−1∗ 𝑆𝑀𝐵𝑡) + 𝛽𝐷𝑆∗𝑆𝑀𝐵(𝐷𝑆𝑡−1∗ 𝑆𝑀𝐵𝑡) + 𝛽𝐷𝑌∗𝑆𝑀𝐵(𝐷𝑌𝑡−1∗ 𝑆𝑀𝐵𝑡) + 𝛽𝐷∗𝑆𝑀𝐵(𝐷𝑡∗ 𝑆𝑀𝐵𝑡) + 𝛽𝐻𝑀𝐿(𝐻𝑀𝐿𝑡) + 𝛽𝑇𝐵∗𝐻𝑀𝐿(𝑇𝐵𝑡−1∗ 𝐻𝑀𝐿𝑡) + 𝛽𝑇𝑆∗𝐻𝑀𝐿(𝑇𝑆𝑡−1∗ 𝐻𝑀𝐿𝑡) + 𝛽𝐷𝑆∗𝐻𝑀𝐿(𝐷𝑆𝑡−1∗ 𝐻𝑀𝐿𝑡) + 𝛽𝐷𝑌∗𝐻𝑀𝐿(𝐷𝑌𝑡−1∗ 𝐻𝑀𝐿𝑡) + 𝛽𝐷∗𝐻𝑀𝐿(𝐷𝑡∗ 𝐻𝑀𝐿𝑡) + 𝛽𝑅𝑀𝑊(𝑅𝑀𝑊𝑡) + 𝛽𝑇𝐵∗𝑅𝑀𝑊(𝑇𝐵𝑡−1∗ 𝑅𝑀𝑊𝑡) + 𝛽𝑇𝑆∗𝑅𝑀𝑊(𝑇𝑆𝑡−1∗ 𝑅𝑀𝑊𝑡) + 𝛽𝐷𝑆∗𝑅𝑀𝑊(𝐷𝑆𝑡−1∗ 𝑅𝑀𝑊𝑡) + 𝛽𝐷𝑌∗𝑅𝑀𝑊(𝐷𝑌𝑡−1∗ 𝑅𝑀𝑊𝑡) + 𝛽𝐷∗𝑅𝑀𝑊(𝐷𝑡∗ 𝑅𝑀𝑊𝑡) + 𝛽𝐶𝑀𝐴(𝐶𝑀𝐴𝑡) + 𝛽𝑇𝐵∗𝐶𝑀𝐴(𝑇𝐵𝑡−1∗ 𝐶𝑀𝐴𝑡) + 𝛽𝑇𝑆∗𝐶𝑀𝐴(𝑇𝑆𝑡−1∗ 𝐶𝑀𝐴) + 𝛽𝐷𝑆∗𝐶𝑀𝐴(𝐷𝑆𝑡−1∗ 𝐶𝑀𝐴𝑡) + 𝛽𝐷𝑌∗𝐶𝑀𝐴(𝐷𝑌𝑡−1∗ 𝐶𝑀𝐴𝑡) + 𝛽𝐷∗𝐶𝑀𝐴(𝐷𝑡∗ 𝐶𝑀𝐴𝑡) + 𝜀𝑝,𝑡 (8)
19 4. Data
The fourth chapter will explain in detail the data that will be used to evaluate the performance of the green mutual funds.
Selecting the green funds was one of most important steps in this study. Despite the recent developments in green investing area, there still isn’t one clarifying classification for this type of funds. One of the most used platforms used to identify the equity sector and the industry name is the Lipper Global Classification9, however the environmental sector is not considered in this classification.
After analyzing the selection criteria used in previous studies on the performance of the green mutual funds, I chose to follow the methodology adopted by Chang et al. (2012) and Chung et al. (2012) to select the green funds. Chang et al. (2012) selected the green mutual funds that seek investments with positive (key: P) impact in at least one of the three areas of the “environment” category (climate/clean tech., pollution/toxics, environment/other) under Screening and Advocacy10 provided by the US SIF. Chung et al. (2012) used the same method, but selected the green mutual funds with positive and restricted (key: R) investments in the same “environment” category. In this study only the funds with positive investments will be considered.
The green mutual funds of this study were identified by US SIF on January 31, 2016. The sample only includes US equity mutual funds and excludes bond funds, balanced and guaranteed funds, as well as index and institutional funds, as in Climent & Soriano (2011). Funds with less than 24-months of age were also excluded from the sample. The monthly returns and the total net asset (TNA) of the funds were obtained from the Center for Research in Security Prices (CRSP) Survivor-Bias-Free US Mutual Fund database. In case of funds with different share classes, only the oldest one was selected (Bello (2005); Cortez et al. (2012)). In case of this, I chose the fund with higher total net asset (TNA). In the end, the study included a sample of 16 US green mutual funds covering the period from May 1990 to September 2014. Although some funds have an
9 The purpose of the Lipper Global Classification (LGC) is to create homogeneous groups of funds with comparable investment objectives. Funds
within one LGC sector invest in the same financial markets or specific segments of those markets but may adopt different investment strategies or styles to achieve their investment objectives.
(https://lipperweb.com/docs/Research/Methodology/Lipper_Global_Classifications_Definitions2014.pdf accessed on December 14, 2016)
20
inception date before the time period of this study, May 1990 was selected because of the availability of the data of the benchmarks that are explained next.
To assess the performance of green funds, two portfolios were constructed: an equally weighted portfolio, with the average monthly returns of each fund, and a value weighted portfolio that also considers the size of the fund. Next we present both formulas (𝑛 represents the number of sample funds, which is 16 in this study):
𝐸𝑞𝑢𝑎𝑙𝑙𝑦 𝑊𝑒𝑖𝑔ℎ𝑡𝑒𝑑 =∑ 𝑟𝑒𝑡𝑢𝑟𝑛𝑖 𝑛 𝑖 𝑛 (9) 𝑉𝑎𝑙𝑢𝑒 𝑊𝑒𝑖𝑔ℎ𝑡𝑒𝑑 =∑ (𝑟𝑒𝑡𝑢𝑟𝑛𝑖 ∗ 𝑇𝑁𝐴𝑖 𝑛 𝑖 ) ∑ 𝑇𝑁𝐴𝑛𝑖 𝑖 (10)
In this study, two benchmarks were used, a conventional and a socially responsible benchmark, in order to analyze the exposure of green investing to each of these indices.
The conventional benchmark used in the study was the Standard & Poor`s 500 index (S&P500). This index includes the top 500 companies in various economic sectors in the US market and, therefore, is a very representative index of the US market. It is widely used in the literature on the investment fund context, namely by Statman (2000), Bello (2005) and Climent & Soriano (2011). The benchmark used to represent the green sector was the MSCI KLD 400 index11. This benchmark is typically used as a socially responsible index (Statman (2000); Bello (2005)) and a widely recognized benchmark for measuring the impact of social and environmental screenings on investment portfolios (Climent & Soriano 2011). This last author used the FTSE KLD Global Climate 100 Index (GC100)12 to represent the green sector. However, this benchmark is
11 The MSCI KLD 400 Social Index is a capitalization weighted index of 400 US securities that provides exposure to companies with outstanding Environmental, Social and Governance (ESG) ratings and excludes companies whose products have negative social or environmental impacts. The Index is designed for investors seeking a diversified benchmark comprised of companies with strong sustainability profiles while avoiding companies incompatible with values screens. Launched in May 1990 as the Domini 400 Social Index, it is one of the first SR indexes. Constituent selection is based on data from MSCI ESG Research. (https://www.msci.com/resources/factsheets/index_fact_sheet/msci-kld-400-social-index.pdf accessed on December 15, 2016)
12The MSCI Global Climate Index is an equal weighted index of companies that operate in three key environmental areas: clean technology and
efficiency, renewable energy, and future fuels. The index is designed to include companies that are leaders in mitigating immediate and long-term factors that contribute to climate change and that may potentially benefit from the de-carbonization of the economy. (https://www.msci.com/resources/factsheets/index_fact_sheet/msci-global-climate-index.pdf accessed on April 20, 2016)
21
constituted by several countries, being a global index. As my study is concentrated only in the US market, the usage of this global index may lead to biased estimates of mutual fund performance. As far as we know, there is no other index available more appropriated to represent the US green sector.
The data on both benchmarks were extracted from Datastream database and discrete monthly returns were computed for each one, in order to maintain the consistency with the data extracted from the CRSP database and from the website of Professor Kenneth R. French13.
The 1-month Treasury Bill from the website of Professor Kenneth R. French14, will be used as a proxy of risk-free rate. The risk factors, such as the SMB factor, the HML factor, the MOM factor, the RMW factor and the CMA factor, were extracted from the same website.
In order to apply the conditional approach, five publicly available information variables were considered: the short-term rate, the term spread, the dividend yield, the default spread and the dummy variable for the month of January. Cortez et al. (2009) used the same variables. The short-term rate is the 1-month US Treasury bill yield from the website of Kenneth R. French. The short-term spread is calculated as the difference between a constant-maturity US Treasury bond yield and a constant-maturity 3-month US Treasury bill yield. The default spread is measured by the difference between the Moody`s US BAA-rated corporate bond yield and the Moody`s AAA-rated US corporate bond yield. The dividend yield is based on the S&P500 index. The information to compute term spread, the default spread and the dividend yield was extracted from the website Federal Reserve15. As these variables tend to be highly persistent, a potential problem that might arise is the bias resulting from the spurious regressions (Cortez et al. 2009). Therefore, I used the procedure of Ferson et al. (2003) to detrend these variables by subtracting a 12-month moving average. In order to minimize possible scale effects on the results, these variables are used in their corresponding mean zero values (Bernhardt & Jung 1979).
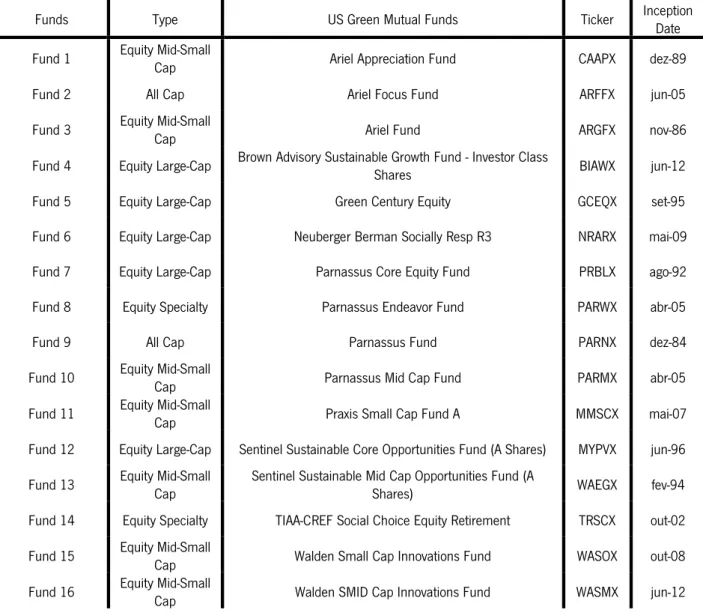
Table I shows the list of all green mutual funds used on this study.
13 http://mba.tuck.dartmouth.edu/pages/faculty/ken.french/
14 http://mba.tuck.dartmouth.edu/pages/faculty/ken.french/data_library.html (accessed on January 8, 2016) 15 http://www.federalreserve.gov/releases/h15/data.htm (accessed on January 9, 2016)
22
TABLE I - List of US green mutual funds
Funds Type US Green Mutual Funds Ticker Inception Date
Fund 1 Equity Mid-Small Cap Ariel Appreciation Fund CAAPX dez-89
Fund 2 All Cap Ariel Focus Fund ARFFX jun-05
Fund 3 Equity Mid-Small Cap Ariel Fund ARGFX nov-86
Fund 4 Equity Large-Cap Brown Advisory Sustainable Growth Fund - Investor Class Shares BIAWX jun-12
Fund 5 Equity Large-Cap Green Century Equity GCEQX set-95
Fund 6 Equity Large-Cap Neuberger Berman Socially Resp R3 NRARX mai-09 Fund 7 Equity Large-Cap Parnassus Core Equity Fund PRBLX ago-92
Fund 8 Equity Specialty Parnassus Endeavor Fund PARWX abr-05
Fund 9 All Cap Parnassus Fund PARNX dez-84
Fund 10 Equity Mid-Small Cap Parnassus Mid Cap Fund PARMX abr-05 Fund 11 Equity Mid-Small Cap Praxis Small Cap Fund A MMSCX mai-07 Fund 12 Equity Large-Cap Sentinel Sustainable Core Opportunities Fund (A Shares) MYPVX jun-96 Fund 13 Equity Mid-Small Cap Sentinel Sustainable Mid Cap Opportunities Fund (A Shares) WAEGX fev-94 Fund 14 Equity Specialty TIAA-CREF Social Choice Equity Retirement TRSCX out-02 Fund 15 Equity Mid-Small Cap Walden Small Cap Innovations Fund WASOX out-08 Fund 16 Equity Mid-Small Cap Walden SMID Cap Innovations Fund WASMX jun-12
This table shows the 16 US green mutual funds that were used in this study. This table also reports the type of each fund, the ticker and the inception date provided from US SIF.
23 5. Empirical Results
The fifth chapter presents the results of the regressions and discusses the performance of the US green mutual funds, applying all the methodologies referred previously. First, the unconditional one-factor and multi-factor models (Jensen (1968), Carhart (1997) and Fama & French (2015)) and then, the conditional approach suggested by Christopherson et al. (1998), applied to each model.
In order to adjust the errors of autocorrelation and heteroscedasticity of the excesses returns of the funds, the approach of Newey & West (1994) will be used, as in Climent & Soriano (2011).
5.1 Performance of the Unconditional Models 5.1.1. Jensen (1968) one-factor model
This model, despite being very criticized by many authors, is often used by researchers to evaluate the performance of the mutual funds.
TABLE II – Empirical results of the unconditional one-factor model
Panel A: Benchmark S&P500 Panel B: Benchmark KLD400
Portfolios 𝛼𝑃 𝛽𝑝 𝐴𝑑𝑗. 𝑅2 Portfolios 𝛼𝑃 𝛽𝑝 𝐴𝑑𝑗. 𝑅2
Equally W. 0.000468 0.995514*** 0.867893 Equally W. 0.000312 0.952817*** 0.840800 Value W. 0.000537 0.989473*** 0.784111 Value W. 0.000367 0.949232*** 0.763167
N- 6 [0] 0 [0] - N- 6 [1] 0 [0] -
N+ 10 [3] 16 [16] - N+ 10 [3] 16 [16] -
By observing Table II, it can be verified that all the alphas are positive, however, none of them are statistically significant. Individually (see Appendix 1), there are 6 funds (in both panel A and B) with negative alpha coefficient, however there is no evidence of statistical significance. The remaining funds present a positive performance with 3 funds statistically significant in each panel. This means that, in general, the performance is neutral and that the green funds cannot beat the This table presents regression estimates for equally weighted portfolio (eq. 9) and value weighted portfolio (eq. 10) for the US green mutual funds, obtained by the regression of the one-factor model (eq. 1) with both S&P500 (Panel A) and KLD400 (Panel B) benchmarks, during the period from May 1990 to September 2014. It reports performance estimates (𝛼𝑝), the systematic risk (𝛽𝑝) and the adjusted coefficient of determination (𝐴𝑑𝑗. 𝑅2). The
asterisks are used to identify the existence of statistical significance of the coefficients to a level of significance of 1% (***), 5% (**) and 10% (*). Standard errors are corrected for the presence of autocorrelation and heteroscedasticity using the procedure suggested by Newey and West (1994). N- and N+ indicate the number of the funds that have negative and positive estimates, respectively. Within brackets the number of funds whose estimates are statistically significant at a 5% significance level are presented.
24
market. The findings on Panel B corroborate the results of Climent & Soriano (2011). However, those authors showed that green funds underperform the market using the market benchmark (S&P500), which is against my findings in Panel A. White (1995), for US market and Ibikunle & Steffen (2015), for European market, also found evidence of underperformance. However, when Climent & Soriano (2011) focused on a more recent period (2001 – 2009), the environmental funds and the market did not perform differently.
The systematic risk of the portfolios that are using the market benchmark (S&P500) is higher comparing to the portfolios using the green benchmark (KLD400), implying that green funds are more exposed to the first one. In relation to 𝐴𝑑𝑗. 𝑅2, the higher values are associated with the portfolios that use the market benchmark. These two findings corroborate the study of Climent & Soriano (2011).
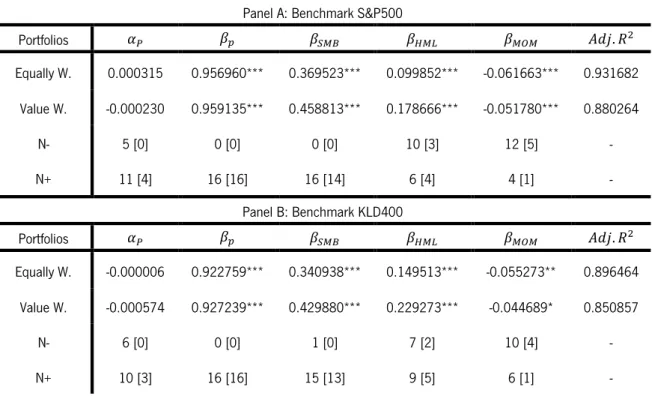
5.1.2. Carhart (1997) four-factor model
Many authors defended that a multi-factor model improves the performance estimation (Bauer et al. (2005), Derwall et al. (2005) and Climent & Soriano (2011), for example). This multi-factor model added three risk factors to the previous model of Jensen (1968), the size factor (SMB), the book-to-market factor (HML) and the momentum factor (MOM).
Table III contains the results from the four-factor model and Appendix 2 contains the results for individual funds.
25
TABLE III – Empirical results of the unconditional four-factor model
Panel A: Benchmark S&P500
Portfolios 𝛼𝑃 𝛽𝑝 𝛽𝑆𝑀𝐵 𝛽𝐻𝑀𝐿 𝛽𝑀𝑂𝑀 𝐴𝑑𝑗. 𝑅2 Equally W. 0.000315 0.956960*** 0.369523*** 0.099852*** -0.061663*** 0.931682 Value W. -0.000230 0.959135*** 0.458813*** 0.178666*** -0.051780*** 0.880264 N- 5 [0] 0 [0] 0 [0] 10 [3] 12 [5] - N+ 11 [4] 16 [16] 16 [14] 6 [4] 4 [1] - Panel B: Benchmark KLD400 Portfolios 𝛼𝑃 𝛽𝑝 𝛽𝑆𝑀𝐵 𝛽𝐻𝑀𝐿 𝛽𝑀𝑂𝑀 𝐴𝑑𝑗. 𝑅2 Equally W. -0.000006 0.922759*** 0.340938*** 0.149513*** -0.055273** 0.896464 Value W. -0.000574 0.927239*** 0.429880*** 0.229273*** -0.044689* 0.850857 N- 6 [0] 0 [0] 1 [0] 7 [2] 10 [4] - N+ 10 [3] 16 [16] 15 [13] 9 [5] 6 [1] -
By observing Table III, with the additional three risk factors, I found that the performance estimates remain neutral, being consistent with the previous one-factor model. The introduction of those factors did not have a significant impact in the funds’ performance.However, with this multi-factor model, the alphas are in general negative but not statistically significant. The alphas show a neutral performance compared to the market which corroborates Climent & Soriano (2011) and Muñoz et al. (2014) results. Individually, the alphas show a positive tendency. In Panel A there are 5 funds with negative alpha coefficient and 11 with positive alpha coefficient. Regarding Panel B, there are 6 funds with negative alpha coefficient and 10 with positive alpha coefficient. As for the funds with negative performance there is no evidence of statistical significance. On the other hand, there are 4 and 3 funds, in each panel, statistically significant.
Another important observation is related to 𝐴𝑑𝑗. 𝑅2, that suffers an increase compared to the one-factor model. This finding corroborates the literature and confirms the expectation that multi-This table presents regression estimates for equally weighted portfolio (eq. 9) and value weighted portfolio (eq. 10) of the US green mutual funds, obtained by the regression of the four-factor model (eq. 2) with both S&P500 (Panel A) and KLD400 (Panel B) benchmarks, during the period from May 1990 to September 2014. It reports performance estimates (𝛼𝑝), the systematic risk (𝛽𝑝) and the adjusted coefficient of determination (𝐴𝑑𝑗. 𝑅2).
Additionally, the regressions coefficients of size (SMB), book-to-market (HML) and momentum (MOM) factors are reported. The asterisks are used to identify the existence of statistical significance of the coefficients to a level of significance of 1% (***), 5% (**) and 10% (*). Standard errors are corrected, whenever appropriate, for the presence of autocorrelation and heteroscedasticity using the procedure suggested by Newey and West (1994). N- and N+ indicate the number of the funds that have negative and positive estimates, respectively. Within brackets the number of funds whose estimates are statistically significant at a 5% significance level are presented.