DOI: 10.1590/1808-057x201702940
Exposition to Factors of the Investment Funds Market in Brazil
Cláudia Olímpia Neves Mamede Maestri
Universidade Federal de Uberlândia, Faculdade de Gestão e Negócios, Uberlândia, MG, Brazil.
Rodrigo Fernandes Malaquias
Universidade Federal de Uberlândia, Faculdade de Ciências Contábeis, Uberlândia, MG, Brazil.
Received on 12.22.2015 – Desk acceptance on 01.26.2016 – 3rd version approved on 10.11.2016.
ABSTRACT
he growth of the investment funds industry in Brazil and its international representativeness indicate the relevance of analyzing this sector. Literature has shown the efects that market factors can have on the performance of investment funds. One way of evaluating the relation between funds’ returns and market factors’ variations is the return-based style analysis. In this context, this research aimed to investigate, through the style analysis, the exposition to various market factors in two modalities of investment funds. With this analysis, we may infer diferences between the allocations and the composition of portfolios, constructing a panorama of sensitivity of funds’ returns to the market factors addressed in the study. he database consisted of daily returns of 508 funds, out of which 385 are ixed income funds and 123 are Neutral Long & Short multimarket funds, within the period from January 3, 2005, to July 11, 2014. hrough the style analysis, with 6 market factors, we found a diference between the composition of portfolios of multimarket funds and portfolios of ixed income funds. Regarding the evolution of the composition of portfolios in these funds, we observed that the investment style of funds does not seem to be constant over time, something which may be a positive evidence concerning the changes that managers promote in their portfolios, seeking to achieve better proitability indicators.
1. INTRODUCTION
Mutual funds, either i xed income or variable income, of er management services to individual and institutional investors, also providing greater liquidity for i nancial investments made in them and lower transaction costs (Varga & Wengert, 2011). h e world market for investment funds showed notable expansion in the 1990s, due to increasing globalization, internationalization of large i nancial groups, strong positive performance of shares and long-term securities with safe return (Klapper, Sulla, & Vittas, 2004).
In Brazil, this expansion took place with the implementation of the Real Plan, since July 1994. h is fact led to the breakdown of factors that hindered the advancement of investment funds, such as unstable economic conditions, poor regulation, and high inl ation rates (Almenara Andaku & Pinto, 2003; Berggrun & Lizarzaburu, 2015; Fonseca, Bressan, Iquiapaza & Guerra, 2007; Laes & da Silva, 2014; Saad & Ribeiro, 2006).
h us, the Total Net Assets of Brazilian funds jumped from less than R$ 300 billion in 1994 to more than R$ 2,914 trillion by August 2015, according to the Brazilian Association of Financial and Capital Market Entities (ANBIMA). In the second half of 2015, Brazil emerged as the fourth largest market for investment funds, according to the ranking European Fund and Asset Management Association (EFAMA, 2015).
In Latin America, Brazil is the largest market for investment funds among three Latin American countries (Brazil, Mexico, and Argentina) which are members of the 30 largest in the world (Carneiro & Brenes, 2014). Although the capital market in Brazil is much smaller than in the USA and the main European markets, the country has a good transparency level in the i nancial market and it received much attention from international investors from 2004 to 2012 (Minardi, Moita & Castanho, 2015). h is means that improvement of the institutional environment and economic indicators contributed so that Brazil could benei t from international liquidity, even undergoing the period of 2007, with appreciation of the real in face of the U.S. dollar (Minardi, Ferrari & Tavares, 2013; Sanglard, Carneiro, Baiocchi, Freitas & Schiavo, 2014).
However, according to Tadeu and Silva (2013), empirical studies on the determinants of private investment in developing countries, including Brazil, have shown negative impacts of economic factors, such as high inl ation rates, interest rates, exchange rates, and international crisis in private investment, strengthening
the argument that i nancial markets are environments that suf er interference both at the economic and political levels (Christophers, 2015).
h ese factors were not favorable to the growth of Brazil since the international crisis in 2008, with interference between economic recovery in 2010, high interest rate reached 12.50% in 2011 and decline of this rate to a record low of 7.25% in 2012 (Silva, 2014); besides, in the following years, according to data from the Central Bank of Brazil (BCB, 2015), the interest rate rose from 7.25% in January 2013 to 14.25% in November 2015.
Given this contrast between growth of the investment funds market and impacts related to market factors in Brazil, monitoring the returns of funds invested becomes a constant task in the routine of investors. To do this, one way to monitor the results is ‘the return-based style analysis.’ According to Varga and Valli (1998), this analysis allows evaluating the exposure of any investment portfolio by identifying risk factors and resource allocation strategy.
Since Brazil is one of the greatest representatives of the funds industry among emerging countries (Varga & Wengert, 2011; Vicente & Tabak, 2008) and considering the possibility that some factors interact in the i nancial market - political events, economic conditions, and the very market expectation (Oliveira, Nobre & Zárate, 2013) - this study aimed to investigate, through the style analysis, the exposure to various market factors in two modalities of investment funds. h us, we may infer dif erences between the allocation and composition of portfolios. h e two modalities of funds considered in the study are: i xed income and multimarket, specii cally the category Neutral Long & Short.
h is research is justii ed by the relevance of the Brazilian capital market. According to Lechman and Marszk (2015), we must pay attention to emerging markets in order to expose the development of their i nances. Moreover, from the viewpoint of Basu and Huang-Jones (2015), investing resources in these markets has been a tendency among investors of developed nations in the last two decades, when they face the potential for higher returns and risk reduction through portfolio diversii cation.
the allocation of portfolios is more restricted. However, there may be ef orts to adopt various and rather risky strategies, but resulting in similar performance indicators, something which indicates the relevance of exploring this theme in more detail. As far as we know, there is a gap in the literature, especially in emerging markets, involving formal studies on the compositional strategies of the investment funds’ portfolios.
In this article, in addition to address compositional portfolios in relation to macroeconomic factors, there is analysis of these strategies over time. Just as it is presented, there is a panorama of the allocation of i xed income funds and multimarket funds, which can help understanding the role of active management for institutional investors in emerging economies.
2. PREVIOUS STUDIES AND HYPOTHESES
2.1 Return-Based Style Analysis and Exposure to Market Risk Factors
Return-based style analysis (Sharpe, 1988, 1992) is a restricted regression of returns of the funds on the risk factors relevant in the market. According to Ter Horst, Nijman and de Roon (2004), it may be used to estimate the exposure of the relevant factor of a fund. For Bodson, Coën and Hübner (2010), this analysis provides a convenient way to decompose the returns of portfolios
administered with identii able benchmarks and replicable strategies.
In structuring the return-based style analysis, Sharpe (1992) divided the application possibilities of a fund into 12 asset classes, in order to estimate and interpret the exposure of the fund under analysis to each of these classes. To do this, the author analyzed the relation between the fund’s return and the classes’ return, thus dei ning the fund’s investment style, whose description of the general model follows in equation 1:
where: Ri = return of fund i; βi = sensitivity or weight of each factor (1 to n) in the return of fund i; F = return of each factor (1 to n); ε = residue of the return of fund i.
According to Das and Uma Rao (2013), the model of Sharpe (1992), with a limited number of asset classes, is successful because most fund managers are restricted to buy and hold assets in a well-dei ned and limited number of classes, in order to meet or exceed the returns in relation to benchmarks. So, stylistic dif erences between fund managers are mainly due to assets in their portfolios, and they are captured in this type of regression (Das & Uma Rao, 2013). It is noteworthy that, according to Schutt and Caldeira (2013),
[…] return-based style analysis constitutes a powerful tool so that the investor identii es in a simple way the risk factors to which each fund is exposed and thus choses the best suited to his style. (p. 17)
h e return-based style analysis was initially conducted with data from the Brazilian market in the work by Varga and Valli (1998). As for the risk factors in Brazil, we may indicate as benchmarks: Special System of Liquidation and Custody (SELIC) (Fonseca et al., 2007; Malaquias, Peixoto & Jones, 2014), Interbank Deposit Certii cate (CDI) (Varga & Valli, 1998), dollar (Malaquias, Peixoto & Jones, 2014; Schutt & Caldeira, 2013), General Index of Market Price (IGPM) (Yoshinaga, Castro, Lucchesi & Oda, 2009), and BOVESPA Index (IBOVESPA) (Coelho, Minardi & Laurini, 2009; Schutt & Caldeira, 2013).
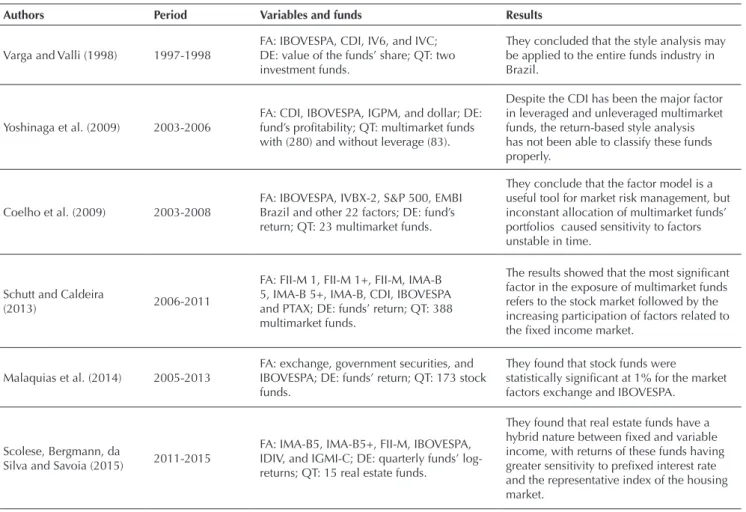
Including the study of return-based style analysis, several surveys were conducted to identify the exposure of returns of certain investment funds to risk factors in the Brazilian market. Table 1 displays a summary of some of these studies.
As for Brazilian investment funds of i xed income and variable income, Fonseca et al. (2007) found, between 2001 and 2006, that the variable income funds had higher returns than those of i xed income, but their risk-return ratio was weakened by high volatility of the stock market and high interest rates.
Between 2013 and 2014, Trindade and Malaquias (2015) found average proi tability slightly higher for variable income funds in relation to those of i xed income, but the latter had an average proi tability higher than that of stock funds.
In the foreign market, Weng and Trück (2011) identii ed risk factors of hedge funds in Asia by expanding the OLS-style analysis technique rolling-windows and value-at-risk analysis. With style factors delimited by 11 indexes of assets and 5 trend factors, the authors found that the funds had signii cant positive exposure to emerging
stock markets. Das and Uma Rao (2013) examined the investment styles of 94 socially responsible funds of the USA, following the 12 asset classes proposed by Sharpe (1992). h ey observed that the lower performance of socially responsible funds is more pronounced than that identii ed in literature, but even so the active management of these funds adds long-term value.
By surveying these studies, similarities and dif erences were observed in exposure to risk factors and between i xed income and variable income funds in Brazil. Fonseca et al. (2007) found that these two categories of funds have no statistically signii cant dif erence in terms of average return within the period. In contrast, Trindade and Malaquias (2015) found dif erences and Scolese et al. (2015) identii ed a hybrid nature in real estate funds for i xed and variable income factors.
As for multimarket funds, the paper by Yoshinaga et al.
Table 1 Studies on return-based style analysis in Brazil within the period from 1998 to 2014
Authors Period Variables and funds Results
Varga and Valli (1998) 1997-1998 FA: IBOVESPA, CDI, IV6, and IVC; DE: value of the funds’ share; QT: two investment funds.
They concluded that the style analysis may be applied to the entire funds industry in Brazil.
Yoshinaga et al. (2009) 2003-2006 FA: CDI, IBOVESPA, IGPM, and dollar; DE: fund’s proi tability; QT: multimarket funds with (280) and without leverage (83).
Despite the CDI has been the major factor in leveraged and unleveraged multimarket funds, the return-based style analysis has not been able to classify these funds properly.
Coelho et al. (2009) 2003-2008 FA: IBOVESPA, IVBX-2, S&P 500, EMBI Brazil and other 22 factors; DE: fund’s return; QT: 23 multimarket funds.
They conclude that the factor model is a useful tool for market risk management, but inconstant allocation of multimarket funds’ portfolios caused sensitivity to factors unstable in time.
Schutt and Caldeira
(2013) 2006-2011
FA: FII-M 1, FII-M 1+, FII-M, IMA-B 5, IMA-B 5+, IMA-B, CDI, IBOVESPA and PTAX; DE: funds’ return; QT: 388 multimarket funds.
The results showed that the most signii cant factor in the exposure of multimarket funds refers to the stock market followed by the increasing participation of factors related to the i xed income market.
Malaquias et al. (2014) 2005-2013 FA: exchange, government securities, and IBOVESPA; DE: funds’ return; QT: 173 stock funds.
They found that stock funds were
statistically signii cant at 1% for the market factors exchange and IBOVESPA.
Scolese, Bergmann, da
Silva and Savoia (2015) 2011-2015
FA: IMA-B5, IMA-B5+, FII-M, IBOVESPA, IDIV, and IGMI-C; DE: quarterly funds’ log-returns; QT: 15 real estate funds.
They found that real estate funds have a hybrid nature between i xed and variable income, with returns of these funds having greater sensitivity to prei xed interest rate and the representative index of the housing market.
CDI = Interbank Deposit Certifi cate; DE = dependent variable; EMBI = Emerging Markets Bonds Index; FA = factors; IBOVESPA = BOVESPA Index; IDIV = Dividend Index; IGMI-C = General Index of the Real Estate-Commercial Market; IGPM = General Index of Market Price; IMA-B = ANBIMA Market Index-B Series; FII-M = Market Fixed Income Index; IV6 = fi xed income index prefi xed through the annual interest rate announced by the BM&FBOVESPA for a nine-month period; IVBX-2 = Index Value BM&FBOVESPA-2nd Line; IVC = exchange index through the U.S. dollar quote; PTAX = index for risk of exchange rate through dollar; QT = amount of funds; S&P500 = Standard & Poor’s 500.
(2009) pointed out that the classii cation suggested by the return-based style analysis, for leveraged and unleveraged funds, dif ers from the classii cation empirically observed for these funds, something which indicates the relevance of studying the portfolio composition in these entities. h e paper by Malaquias (2012) highlights that, as these funds belong to various categories of investments, we may expect that the composition of portfolios of multimarket funds also rel ects various strategies in the allocation of capital.
As discussed in literature, we may i nd several studies on return-based style analysis. Given the above, the following hypothesis was formulated:
H1 – the sensitivity of returns to market factors of multimarket funds is dif erent from the sensitivity shown by the Brazilian i xed income funds.
2.2 Exposure to Market Risk Factors
h e resource allocation policy in the funds’ portfolios is the main responsible for the funds’ performance and it varies according to movement in the economic scenarios (Ibbotson & Kaplan, 2000). Besides, the strategies to achieve excess returns and risk exposure can vary over time (Billio, Getmansky & Pelizzon, 2012; Fung, Hsieh, Naik & Ramadorai, 2008; Roumpis & Syriopoulos, 2014).
Faced with this, regarding the exposure of funds’ portfolios to foreign currency, the so-called carry trade phenomenon stands out, which arises at times when investors take speculative positions to take foreign currency loans with low interest rates and invest in this currency with high interest rates (Fong, 2013; Kim, 2015; Peltomäki, 2011).
In Japan, as for the carry trade in the yen exchange market for hedge funds, Peltomäki (2011) showed that changes in the implied yen volatility in relation to the U.S. dollar exchange rate impacted the returns of hedge funds, as the latter had positive returns when exposed to negative carry trade operations. On the other hand, Fong (2013) found that the returns of hedge funds were positively related to exchange rate l uctuations in the past and that these funds were able to reduce the monthly exposure of carry trade before the peak of the 2008 i nancial crisis.
In Australia, among the i ndings by Kim (2015), it is worth noticing that the carry trade of the Australian dollar in relation to the U.S. dollar showed evidence of proi tability within the period from 1999 to 2012, except for periods of global i nancial crises, as in pre-crisis times higher volatility occurred in the exchange rate and there were changes in the number of operations in foreign exchange transaction, the inl ation rate, and the unemployment rate in the country.
From another perspective, Ciarlone and Miceli (in
press) point out that investments in foreign currency, specii cally arising from sovereign wealth funds (State investments from, e.g. commodities and i scal surplus), provide stability to the markets involved in i nancial crises by of ering capital l ows that protect these markets rather than spread the crisis globally.
In this way, Vilella and Leal (2008) found that the performance of i xed-income Brazilian funds is related to CDI benchmarks and Market Fixed Income Index (FII-M), and these indexes rel ect inl ation and interest rates in the short-term (CDI) and in the medium and long term (FII-M) of the monetary policy in the Brazilian market.
In the USA, Laborda and Muñoz (2016) studied the funds that invest in government securities in face of variables such as interest rate and the country’s macroeconomic environment. Among the i ndings, they showed a negative relation between optimal allocation of these funds and the country’s economic cycle, because there is higher optimal allocation when the interest rates and the output gap are low.
Regarding variable income investments, Billio et al. (2012) found that exposure to risk in hedge funds in Switzerland depends on the times that the economy is high, low, and calm. For instance, at low moments, the strategies of hedge funds are aimed at the risk factors: stock market (Standard & Poor’s 500, low exposure), liquidity (small-large, increased exposure), credit (credit spread, negative exposure), and volatility (VIX, negative exposure).
Boyd, Levine and Smith (2001) highlighted that changes in inl ation rates interfere with the ef ectiveness of allocations of the i nancial market resources. By studying the banking system of 97 countries and the stock market of 49 countries, including Brazil, found that inl ation has a negative relation both for the banking industry and for the stock market, interfering, for instance, with the availability of credit, liquidity, and return volatility of assets, something which in the long run can undermine the country’s economic performance.
Migiakis and Bekiris (2009) studied the i nancial market in the UK and found that there is alternation between investment in government stocks and securities at times of economy with structural breaks, pronounced declines, and high volatility.
both on the expectations and history of l uctuations in the i nancial market over time.
In this way, some managers can develop market timing ability, i.e. ability to anticipate movements in asset prices (Jordão & De Moura, 2011; Leusin & Brito, 2008; Treynor & Mazuy, 1966). h us, managers can change the exposure of a fund to market factors from the perspectives of market l uctuations, e.g. increasing/decreasing the exposure of a fund to a particular index according to the market heating/decline (Bollen & Busse, 2001). Moreover, asset management has become more skilled over time (Pástor, Stambaugh & Taylor, 2015) and the funds industry believes that some managers have higher management capacity to predict future performance based on past returns (Vidal-García et al., 2016).
h erefore, since the allocation of resources in the funds’ portfolios can be subject to changes as for the risk of assets in face of l uctuation in the economic scenarios and considering that fund managers, by reading the i nancial
market, can alter the exposure of assets to market factors in search of better outcomes, it is assumed that the exposure of funds’ returns to market factors is variable over time. h us, it is expected that the fund’s exposure to foreign currency market factors, i xed income and variable income provide funds with dif erent returns according to the economic period of the time. So, we propose the following hypothesis to be tested in this study:
H2 – the sensitivity of funds’ returns to market factors varies over time.
It is also worth highlighting that this movement and change of investment style over time is consistent with active management in investment funds. It is assumed because the managers are constantly seeking to adopt strategies to manage overcoming the market balance and deliver better performance indicators to the shareholders who invest their i nancial resources in the respective funds.
3. METHOD AND DATA
This study took as its sample the fixed income investment funds and the variable income Neutral Long & Short funds selected in the database SI-ANBIMA. h e study period was from 2005 to 2014, whose initial date for analysis was January 3, 2005, due to changes in the practices of information disclosure on the part of investment funds that occurred in 2004 (Varga & Wengert, 2011).
Fixed income funds seek return through investments in i xed income assets, they must maintain at least 80% of their portfolio in federal securities and admit strategies that imply risk of interest rate and domestic market price index (ANBIMA, 2015). h e Neutral Long & Short multimarket funds are related to the variable income market, they operate on assets and derivatives and seek maintaining neutral exposure to risk in the stock market (ANBIMA, 2015).
At er excluding funds with incomplete data for analysis, the sample resulted in 385 i xed income investment funds and 123 Neutral Long & Short multimarket funds, with a total of 414,406 observations for daily returns (on average, more than 815 observations per fund). Just as in the papers by Carhart (1997), Carvalho (2005), and Gomes and Cresto (2010), this study highlights the importance of avoiding the survival bias, thus we did not exclude from the sample funds that were closed within the period covered. As stated by Varga and Valli (1998), in order to apply the style analysis to the Brazilian market, a set
of indexes that replicate the behavior of asset classes is needed.
As the papers listed in Table 1, this research adopted the same reasoning of return-based style analysis to estimate in which capital market factors a particular fund usually invests. h e independent variables were the factors IBOVESPA, DOLLAR, SELIC, IGMP, and MULTIM, and FIXEDINCOME. h e dependent variable, performance or return, was measured by the fund’s closing price on date t divided by the fund’s closing price on the immediately preceding date, according to the studies on performance and return-based style analysis by Lima (2014) and Malaquias, Peixoto and Jones (2014).
h e i rst factor dei ned as a representative index of the market portfolio was the IBOVESPA, which is the most widely known and popular indicator of the average performance in the Brazilian stock market quotes (Fonseca et al., 2007; Gomes & Cresto, 2010; Yoshinaga et al., 2009). Moreover, according to Dourado and Tabak (2014), the IBOVESPA is the main indicator of the Brazilian stock market, as it takes into account price variations of these assets and the distribution of dividends by issuers (e.g. dividends).
the IBOVESPA, evidencing the importance of foreign investors in the Brazilian stock exchange.
h e market interest rate was expressed by the SELIC that, according to Paiva and Savoia (2009), is the funding rate of federal securities usually taken as the basic rate of the economy, so, in the model, this rate represents the proi tability of federal securities (Malaquias, Peixoto & Jones, 2014).
h e representative index of the market price portfolio was the IGPM, according to the study by Paiva and Savoia (2009), as it is a Brazilian inl ation index; also, according to the study by Yoshinaga et al. (2009), which viewed inflation as a component observed in the Brazilian economy and considered that the funds can invest in the National Treasury Bonds indexed to this price index.
In addition to these factors, we also used an index of our own (Scolese et al., 2015), in order to represent the
sensitivity of variable income and i xed income portfolios.
he factors MULTIM and FIXEDINCOME were created
with the purpose of rel ecting average daily returns for the sample funds, and MULTIM refers to the daily average returns for all multimarket funds throughout the period analyzed and FIXEDINCOME refers to the daily average returns for all i xed income funds within the whole period under analysis.
To analyze the relationship between the multimarket portfolio composition for i xed income and the i xed income portfolio composition, this paper used a multiple regression technique using panel data. To do this, the following equation was created in order to test the hypothesis of this study with the multiple linear regression model by ordinary least squares (OLS) with robust standard errors:
Ri = βi1F1 + βi2F2 + βi3F3 + βi4F4 + βi5F5 + βi6F6 + εi
where: Ri= return of fund i; βi = sensitivity or weight of each factor (1 to 6) in return of fund i; F1 = return of the factor IBOVESPA; F2 = return of the factor DOLLAR; F3 = return of the factor SELIC; F4 = Return of the factor IGPM; F5 = return of the factor MULTIM; F6 = return of the factor FIXEDINCOME; εi= error term of the model.
h us, all hypotheses tested in the paper are based on the result of the panel data analysis that combines the observations through funds with time series (i.e. the historical returns of each fund). h e tests were conducted in the statistical sot ware STATA, based on a panel with stacked data. h is choice was made having the time frame (for years) applied during the study as a basis (specii cally for testing H2). h e dependent variable corresponded to the daily return of each fund and the independent variables were based on the factors shown in Figure 1. To do this, the statistical operations Tolerance and Variance Inl ation Factor (VIF) were applied, and we considered robust standard errors for heteroskedasticity to evaluate the respective t-statistics of results.
Each fund that constitutes the database has a historical series of returns. h ese returns are arranged along the time, therefore this is an analysis involving time series. h e use of econometric models based on time series may have their results af ected if the series are not stationary (i.e. if they have a unit root). h e observations of the dependent variable in this study refer to time and funds, making a panel. h us, one of the tests which can be used to evaluate
the stationary time series, in this case, is provided by Levin, Lin and Chu (2002), whose null hypothesis is that the series contain a unit root (i.e. they are not stationary).
However, the application of this test requires a strongly balanced panel, but this is not the case herein, since there are funds that close their activities in the middle of the period, while there are others that open, and so on. h us, in order to manage evaluating whether the database has characteristics that could af ect the statistical tests, we selected 44 funds that had complete information for the period from January 1, 2005, to December 31, 2013 (period with the largest number of observations for the funds). Even so, there were 2.9% of observations on the panel with missing values. Such missing values were replaced by the average funds’ return, something which led to obtaining a balanced panel to run the unit root test.
Applying the test, the result was: adjusted t = -2,4e + 02 (p value = 0.000), i.e. the null hypothesis that there is no stationarity in the panel was rejected, something which indicates evidence that using multivariate econometric models with these series does not have results biased by the dependency characteristic of returns over time (in case it exists). Although this test has been feasible only with a part of the study sample, it is understood that this feature may be extended to the other funds. h erefore, the analysis of results is based on the equations presented earlier in this topic.
4. RESULTS
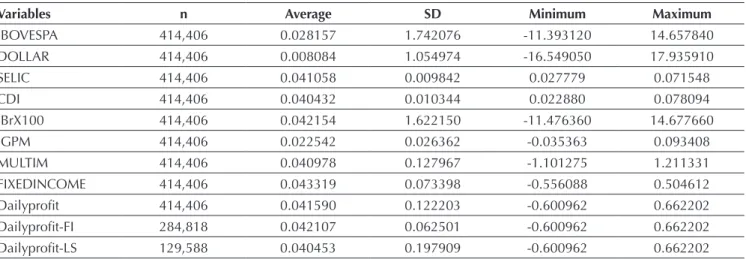
Table 2 displays the descriptive statistics for the variables in this study.
Table 2 displays the total of 414,406 daily observations with values close to the average proi tability of the i xed income investment funds (0.042) and Neutral Long & Short multimarket funds (0.040). However, with dif erent standard deviations indicating high data dispersion, denoting the need to process data for getting close to a normal distribution. Because of this behavior, the Jarque-Bera normality test was conducted and it identii ed a non-normal data distribution. h us, for hypothesis testing, robust standard errors were used. Based on an analysis of
bivariate correlation, we observed that the variables SELIC and CDI, and IBOVESPA and Brazil Index (IBrX) 100 showed a strong and statistically signii cant correlation. h erefore, the variables CDI and IBrX100 were omitted from the model to avoid multicollinearity problems.
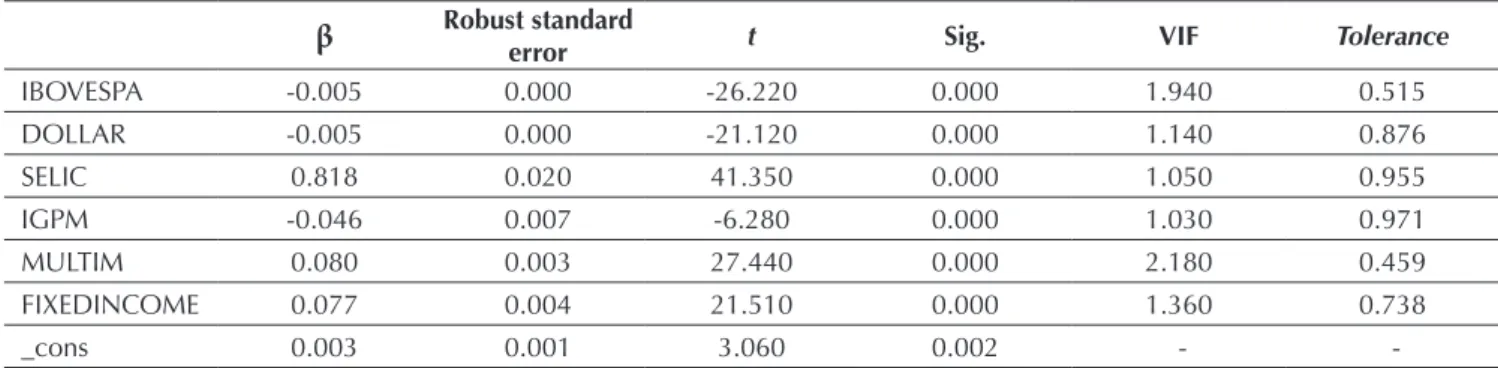
Before analyzing the sensitivity of returns to factors of the i xed income funds market and the Long & Short multimarket funds, we conducted the analysis of this sensitivity with all the sample funds, as shown in Table 3.
Table 2 Descriptive statistics of variables within the period from January 3, 2005, to July 11, 2014
Variables n Average SD Minimum Maximum
IBOVESPA 414,406 0.028157 1.742076 -11.393120 14.657840
DOLLAR 414,406 0.008084 1.054974 -16.549050 17.935910
SELIC 414,406 0.041058 0.009842 0.027779 0.071548
CDI 414,406 0.040432 0.010344 0.022880 0.078094
IBrX100 414,406 0.042154 1.622150 -11.476360 14.677660
IGPM 414,406 0.022542 0.026362 -0.035363 0.093408
MULTIM 414,406 0.040978 0.127967 -1.101275 1.211331
FIXEDINCOME 414,406 0.043319 0.073398 -0.556088 0.504612
Dailyproi t 414,406 0.041590 0.122203 -0.600962 0.662202
Dailyproi t-FI 284,818 0.042107 0.062501 -0.600962 0.662202
Dailyproi t-LS 129,588 0.040453 0.197909 -0.600962 0.662202
Table 3 Estimated sensitivity of returns of funds to market factors (all funds) within the period from January 3, 2005, to July 11, 2014
β Robust standard error t Sig. VIF Tolerance
IBOVESPA -0.005 0.000 -26.220 0.000 1.940 0.515
DOLLAR -0.005 0.000 -21.120 0.000 1.140 0.876
SELIC 0.818 0.020 41.350 0.000 1.050 0.955
IGPM -0.046 0.007 -6.280 0.000 1.030 0.971
MULTIM 0.080 0.003 27.440 0.000 2.180 0.459
FIXEDINCOME 0.077 0.004 21.510 0.000 1.360 0.738
_cons 0.003 0.001 3.060 0.002 -
-_cons = constant of the statistical model; DOLLAR = variable corresponding to return in the historical series of dollar rates; IBOVESPA = BOVESPA Index (representative variable of the stock market); IGPM = General Index of Market Price (price movement indicator calculated monthly by the Getulio Vargas Foundation); MULTIM = daily average of returns for multimarket funds throughout the period; FIXEDINCOME = average daily returns for fixed income funds throughout the period; SELIC = Special System of Liquidation and Custody (return of the variable corresponding to estimated revenue for government securities); Sig. = statistics of the p value; t = statistics of the t-test; VIF = Variance Inflation Factor; β = regressor parameter.
Note. the VIF statistics showed no problems related to multicollinearity (average of 1.45). R2: 0.018. Source: Prepared by the authors.
h e result displayed in Table 3 shows that all coeffi cients of the factors that explain the proi tability of funds and the ‘constant’ are statistically signii cant at the 1% level, with a negative relation to IBOVESPA, DOLLAR, and IGPM and a positive relation to the constant, SELIC, multimarket, and FIXEDINCOME.
h e main factor observed in the funds’ portfolios is the SELIC, with t-test of 41.35 (far beyond the critical t tabulated at the statistical signii cance of 1%). h e relevance of this factor demonstrates the preference of investors for safe income. According to Varga (2001), the SELIC is the 1-day rate for i nancing government securities and, as the Federal Government has the power to issue currency, it can pay any debt in local currency, something
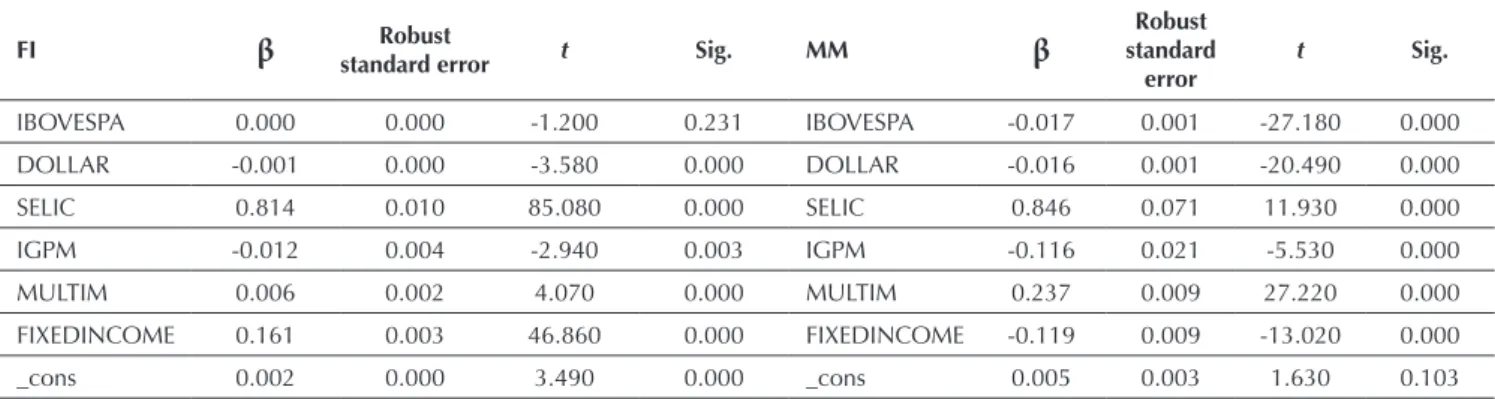
In Table 4, the most important factor for the i xed income funds, as well as in the results of Table 3 for all funds in the sample, is still the SELIC, with more pronounced exposure, t = 85.08, followed by FIXEDINCOME, with t = 46.86, while for Neutral Long & Short multimarket funds the most important factor is MULTIM, with t = 27.22, followed by the IBOVESPA, with t = 27.18.
h ese results corroborate the studies by Trindade and Malaquias (2015), which considered the factors SELIC and IBOVESPA as benchmarks for the i xed income and variable income markets, respectively. h ey also corroborate the results of Schutt and Caldeira (2013), who found an exposure of multimarket funds more signii cant to the factor stock market.
However, the results diverge from: (i) Yoshinaga et al. (2009), because they found as the dominant factor for multimarket funds the CDI (proxy for the proi tability of government securities) and, in this study, the dominant factor for these funds was MULTIM and the IBOVESPA; (ii) Weng and Trück (2011), who found signii cant positive exposure of hedge funds in emerging stock markets, but in this study the exposure of multimarket funds to the stock market was negative; (iii) Fonseca et al. (2007), partially, who did not identify dif erence in the average proi tability of i xed income and variable income funds, because this study pointed out dif erences in sensitivity to market factors of returns of funds in the sample.
h us, through the results shown in Table 4, we may infer that the composition of portfolios of multimarket
funds for i xed income is dif erent from the composition of a portfolio of i xed income funds. h ese results are in line with the H1 proposed in this study, supporting the studies by Malaquias (2012) and Scolese et al. (2015), by expecting that the composition of portfolios of multimarket funds rel ects various investment styles in these funds, and the study by Basu and Huang-Jones (2015), which claims that variable income funds in emerging markets of er diversii cation benei ts.
In order to test the H2, which involves the variation of sensitivity of funds’ returns to macroeconomic factors over time, we have, in Appendix A, results of the t-test of exposure to factors of portfolios for the 10 years covered by the sample.
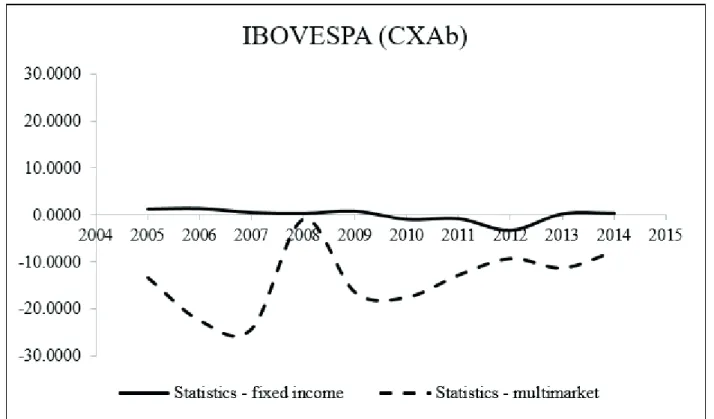
From 2005 to 2014, the IBOVESPA factor for i xed income funds was not statistically signii cant, except for 2012 (1% level). According to a study by Silva (2014) and data from the BCB (2015), in 2012 the interest rate suf ered the historical minimum of 7.25%, which may have impacted so that investors in i xed income funds partially transferred their portfolios to the stock market looking for better returns.
On the other hand, the factor IBOVESPA for Neutral Long & Short multimarket funds had a statistical signii cance of 1% throughout the years, except for 2008, something which may be due to the international i nancial crisis. Exposure of the Neutral Long & Short multimarket fund is more sensitive to the factor IBOVESPA because this is an index for variable income.
Table 4 Comparison of sensitivity to market factors between Neutral Long & Short funds and i xed income funds by Student’s t test
FI β Robust
standard error t Sig. MM β
Robust standard
error
t Sig.
IBOVESPA 0.000 0.000 -1.200 0.231 IBOVESPA -0.017 0.001 -27.180 0.000
DOLLAR -0.001 0.000 -3.580 0.000 DOLLAR -0.016 0.001 -20.490 0.000
SELIC 0.814 0.010 85.080 0.000 SELIC 0.846 0.071 11.930 0.000
IGPM -0.012 0.004 -2.940 0.003 IGPM -0.116 0.021 -5.530 0.000
MULTIM 0.006 0.002 4.070 0.000 MULTIM 0.237 0.009 27.220 0.000
FIXEDINCOME 0.161 0.003 46.860 0.000 FIXEDINCOME -0.119 0.009 -13.020 0.000
_cons 0.002 0.000 3.490 0.000 _cons 0.005 0.003 1.630 0.103
_cons = constant of the statistical model; DOLLAR = variable corresponding to return in the historical series of dollar rates; IBOVESPA = BOVESPA Index (representative variable of the stock market); IGPM = General Index of Market Price (price movement indicator calculated monthly by the Getulio Vargas Foundation); MULTIM = daily average of returns for multimarket funds throughout the period; MM = Neutral Long & Short multimarket funds; FIXEDINCOME = average daily returns for fi xed income funds during the whole period; FI = fi xed income funds; SELIC = Special System of Liquidation and Custody (return of the variable corresponding to estimated revenue for government securities); Sig. = statistics of the p value; t = statistics of the t-test; β = beta coeffi cient or regressor parameter.
Note. R2 for the regression of fi xed income funds = 0.065 and R2 for the regression of Neutral Long and Short multimarket funds = 0.020.
Figure 1 magnii es the view of the annual evolution of the IBOVESPA regressor coeffi cient analyzed by Student’s t test for i xed income funds and Neutral Long & Short multimarket funds. We can identify the pronounced
drop in the factor IBOVESPA for the variable income market in 2008, which may be related to the exogenous component of the crisis.
Figure 1 Annual evolution of the regressor coeffi cient BOVESPA Index (IBOVESPA) analyzed by Student’s t test – comparison between fi xed income funds and Neutral Long & Short multimarket funds.
Source: Prepared by the authors.
In relation to the 2008 crisis, Gonzalez, Bastos and Perobelli (2011) found investors’ reluctance to buy stocks, something which pushed their market prices to very low values, below their equity value. h is fact was also corroborated by the statement of Schutt and Caldeira (2013) on a study by the HSBC Global Asset Management, that the pronounced drop of the IBOVESPA in 2008 strongly af ected the proi tability of the multimarket funds
industry.
For i xed income funds, the factor SELIC was positive and statistically signii cant at 1% for every year, except 2014. For the Neutral Long & Short multimarket funds, the factor SELIC was statistically signii cant at 1% for the years 2005, 2008, 2009, 2010, and 2011, something which corroborates the study by Schutt and Caldeira (2013) by showing that multimarket funds have a signii cant portion of their resources in assets related to government securities or private i xed income securities.
Returning to Appendix A, the annual evolution of the regressor coeffi cient DOLLAR showed statistical signii cance of 1% only in 2013 for i xed income funds and for every year, except 2014 for Neutral Long & Short multimarket funds.
Regarding the annual evolution of the regressor coeffi cient IGPM, by t-test this factor is statistically significant at 1% only for Neutral Long & Short multimarket funds in 2005, 2013, and 2014.
As for the annual evolution of the regressor coeffi cients MULTIM and FIXEDINCOME, for Neutral Long & Short multimarket funds, the factor MULTIM remained statistically signii cant at 1% in every year of the study, the same is true for i xed income funds with the factor FIXEDINCOME.
h e exposure of the evolution of these factors supports
the study by Coelho, Minardi and Laurini (2009), because the model of factors can identify the management style of each fund, and it is an useful tool for market risk management.
However, when analyzing from 2005 to 2014, we observe, through statistical significance, no record of allocation of portfolio in i xed income funds and multimarket funds for the factors IBOVESPA, SELIC, DOLLAR, and IGPM, revealing that the sensitivity of return to the factors was not stable over time. h at is, the investment style of these funds varied over time (Schutt & Caldeira, 2013).
h erefore, these results showed to be aligned with H2: the sensitivity of funds’ returns to market factors varies over time. Overall, the results are in line with the studies presented in the theoretical framework (Billio et al., 2012; Fung et al., 2008; Ibbotson & Kaplan, 2000; Roumpis & Syriopoulos, 2014), leading us to conclude that the managers of funds in the sample seek to i t the portfolios they manage to the various market factors in order to deliver better proi tability indicators to the shareholders.
In this way, managers can try to anticipate price movements of assets in search of delivering better performance, something which characterizes the market timing phenomenon. h e statistical results of t-test for
Figure 2 Annual evolution of the regressor coeffi cient Special System of Liquidation and Custody (SELIC) analyzed by Student’s t-test – comparison between fi xed income funds and Neutral Long & Short multimarket funds.
the market factors presented in Appendix A (IBOVESPA, DOLLAR, SELIC, IGMP, MULTIM, FIXEDINCOME) seem to indicate the possibility that the manager changes the exposure of a fund to market factors from the perspectives of market l uctuations. In this case, we view that both the i xed income funds and the Neutral Long & Short multimarket funds showed dif erent values of t-test for exposure of funds’ return to market factors. For instance, when studying the funds on an annual basis, the statistical t of the factor SELIC for i xed income funds showed less pronounced exposure of 1.520 (2014)
and more pronounced of 12.540 (2012) and, for Neutral Long & Short multimarket funds, the least pronounced exposure was -0.920 (2006) and the most pronounced exposure was 6.290 (2009).
Thus, we observed that the investment style of funds does not seem to be constant over time and that considering the period (in years, in the case of this study) in the analysis of the investment fund management style seems to be a relevant variable for further studies on the subject.
5. FINAL REMARKS
h is study was conducted in order to investigate, through style analysis, exposure to various market factors in two modalities of investment funds: i xed income funds and multimarket funds. h rough this analysis, we can infer dif erences between the allocation and composition of portfolios. We studied 508 investment funds distributed into 385 i xed income funds and 123 Neutral Long & Short multimarket funds from 2005 to 2014. h e database consisted of 414,406 daily observations of the SI-ANBIMA and exposure to the market factors IBOVESPA, SELIC, DOLLAR, IGMP, MULTIM, and FIXEDINCOME.
The empirical results of the sample under study revealed that the formation of portfolios of fixed income funds and Neutral Long & Short multimarket funds is structured dif erently. h e predominant style of investment in portfolios of i xed income funds was dei ned by the factors SELIC and FIXEDINCOME and the predominant investment style in portfolios of Neutral Long & Short multimarket funds by the factors MULTIM and IBOVESPA.
In addition, the results showed persistence of exposure to factors related to the average daily returns for funds in the sample, with MULTIM for Neutral Long & Short multimarket funds and FIXEDINCOME for i xed income
funds. On the other hand, we observed that the fund’s investment style does not seem to be constant over time, indicating that managers seem to change their resource allocation ways over time, seeking to provide better indicators of proi tability to their shareholders, something which can be a sign of the market timing phenomenon, where managers can try to anticipate asset price movements in order to deliver better performance.
h is study has the potential to expand the look on the analysis of investment fund returns, as its focus goes beyond comparing performance to analyze the sensitivity of returns to various market factors. h is evaluation showed dif erent resource allocation styles between the portfolios of i xed income funds and multimarket funds, with changes in this allocation way over time.
REFERENCES
Almenara Andaku, F. T., & Pinto, A. C. F. (2003). A persistência de desempenho dos fundos de investimento em ações no Brasil. Revista de Economia e Administração, 2(2), 23-33. Associação Brasileira das Entidades dos Mercados Financeiro e
de Capitais. (2015). Dados estatísticos: indústria de fundos. Retrieved from http://portal.anbima.com.br/informacoes-tecnicas/estatisticas/patr-liq-rentab/Pages/default.aspx. Banco Central do Brasil. (2015). Histórico das taxas de juros.
Retrieved from http://www.bcb.gov.br/?COPOMJUROS. Basu, A. K., & Huang-Jones, J. (2015). h e performance of
diversii ed emerging market equity funds. Journal of International Financial Markets, Institutions and Money, 35, 116-131.
Berggrun, L., & Lizarzaburu, E. (2015). Fund l ows and performance in Brazil. Journal of Business Research, 68(2), 199-207.
Billio, M., Getmansky, M., & Pelizzon, L. (2012). Dynamic risk exposures in hedge funds. Computational Statistics & Data Analysis, 56(11), 3517-3532.
Bodson, L., Coën, A., & Hübner, G. (2010). Dynamic hedge funds style analysis with errors‐in‐variables. Journal of Financial Research,33(3), 201-221.
Bollen, N. P., & Busse, J. A. (2001). On the timing ability of mutual fund managers. Th e Journal of Finance, 56(3), 1075-1094. Boyd, J. H., Levine, R., & Smith, B. D. (2001). h e impact of
inl ation on i nancial sector performance. Journal of Monetary Economics, 47(2), 221-248.
Caldeira, J. F., & Portugal, M. S. (2010). Estratégia long-short, neutra ao mercado, e index tracking baseadas em portfólios cointegrados. Revista Brasileira de Finanças, 8(4), 469-504. Carhart, M. (1997). On persistence in mutual fund performance.
Journal of Finance, 52(1), 57-82.
Carneiro, J., & Brenes, E. R. (2014). Latin American i rms competing in the global economy. Journal of Business Research, 67(5), 831-836.
Carvalho, M. R. A. (2005). Avaliação de desempenho de fundos multimercado: resultados passados podem ser utilizados para dei nir uma estratégia de investimento?Revista deEconomia e Administração, 4(3), 367-387.
Christophers, B. (2015). Against (the idea of) i nancial markets. Geoforum, 66, 85-93.
Ciarlone, A., & Miceli, V. (in press). Escaping i nancial crises? Macro evidence from sovereign wealth funds’investment behaviour. Emerging Markets Review.
Coelho, G. T., Minardi, A. M. A., & Laurini, M. P. (2009). Uma investigação sobre os estilos gerenciais e riscos de mercado de fundos multimercados brasileiros [Working paper]. Insper Instituto de Ensino e Pesquisa, São Paulo, SP. Retrieved from http://www.insper.edu.br/wp-content/uploads/2013/12/2009_ wpe180.pdf.
Das, P. K., & Uma Rao, S. P. (2013). Performance evaluation of socially responsible mutual funds using style analysis. Social Responsibility Journal,9(1), 109-123.
Dourado, G. A., & Tabak, B. M. (2014). Teste da hipótese de mercados adaptativos para o Brasil. Revista Brasileira de Finanças, 12(4), 517-553.
European Fund and Asset Management Association. (2015).
International statistical release. Retrieved from http://www. efama.org/Publications/Statistics/International/Quarterly%20 %20International/151001_International%20Statistical%20 Release%202015%20Q2.pdf.
Fong, W. M. (2013). Footprints in the market: hedge funds and the carry trade. Journal of International Money and Finance, 33, 41-59.
Fonseca, N. F., Bressan, A. A., Iquiapaza, R. A., & Guerra, J. P. (2007). Análise do desempenho recente de fundos de investimento no Brasil. Contabilidade Vista & Revista, 18(1), 95-116.
Fung, W., Hsieh, D. A., Naik, N. Y., & Ramadorai, T. (2008). Hedge funds: performance, risk, and capital formation. Th e Journal of Finance, 63(4), 1777-1803.
Gomes, F. A. R., & Cresto, V. (2010). Avaliação do desempenho dos fundos long-short no Brasil. Revista Brasileira de Finanças,
8(4), 505-529.
Gonzalez, R. M., Bastos, S. Q. A., & Perobelli, F. F. (2011). Comportamento dos investidores na crise: uma análise para o Brasil no período de 2005 a 2009. Anais doIV Encontro Internacional da Associação Keynesiana Brasileira (AKB), Rio de Janeiro, RJ, Brasil, 18.
Ibbotson, R. G., & Kaplan, P. D. (2000). Does asset allocation policy explain 40, 90, or 100 percent of performance? Financial Analysts Journal, 56(1), 26-33. Jordão, G. A., & De Moura, M. L. (2011). Performance analysis
of Brazilian hedge funds. Journal of Multinational Financial Management, 21(3), 165-176.
Kim, S. J. (2015). Australian dollar carry trades: time varying probabilities and determinants. International Review of Financial Analysis, 40, 64-75.
Klapper, L., Sulla, V., & Vittas, D. M. (2004). h e development of mutual funds around the world. Emerging Markets Review,
5(1), 1-38.
Laborda, R., & Muñoz, F. (2016). Optimal allocation of
government bond funds through the business cycle. Is money smart? International Review of Economics & Finance, 45, 46-67.
Laes, M. A., & da Silva, M. E. (2014). Performance of mutual equity funds in Brazil – A bootstrap analysis. Economia, 15(3), 294-306.
Lechman, E., & Marszk, A. (2015). ICT technologies and i nancial innovations: the case of exchange traded funds in Brazil, Japan, Mexico, South Korea and the United States. Technological Forecasting and Social Change, 99, 355-376.
Leusin, L. D., & Brito, R. D. (2008). Market timing e avaliação de desempenho dos fundos brasileiros. Revista de Administração de Empresas, 48(2), 22-36.
Levin, A., Lin, C.-F., Chu, C.-S. J. (2002). Unit root tests in panel data: asymptotic and i nite-sample properties. Journal of Econometrics, 108, 1-24.
Administração de Empresas de São Paulo, São Paulo, SP, Brasil.
Malaquias, R. F. (2012). Desempenho de fundos multimercados
(Doctoral h esis). Escola de Administração de Empresas de São Paulo, São Paulo, SP, Brasil.
Malaquias, R. F., Peixoto, F. M., & Jones, G. D. C. (2014). Fundos de investimentos, bancos administradores e empréstimos concedidos a empresas abertas: uma análise no cenário brasileiro. Contabilidade Vista & Revista, 25(3), 121-142. Meurer, R. (2006). Fluxo de capital estrangeiro e desempenho do
Ibovespa. Revista Brasileira de Finanças, 4(1), 345-361. Migiakis, P. M., & Bekiris, F. V. (2009). Regime switches between
dividend and bond yields. International Review of Financial Analysis, 18(4), 198-204.
Minardi, A. M. A. F., Ferrari, G. L., & Tavares, P. C. A. (2013). Performances of Brazilian IPOs backed by private equity. Journal of Business Research, 66(3), 448-455. Minardi, A. M. A. F., Moita, R. M., & Castanho, R. P. (2015).
Investigating the partial adjustment ef ect of Brazilian IPOs. Journal of Business Research, 68(2), 189-198. Oliveira, F. A., Nobre, C. N., & Zárate, L. E. (2013). Applying
artii cial neural networks to prediction of stock price and improvement of the directional prediction index – Case study of PETR4, Petrobras, Brazil. Expert Systems with Applications, 40(18), 7596-7606.
Paiva, E. V. S., & Savoia, J. R. F. (2009). Pricing corporate bonds in Brazil: 2000 to 2004. Journal of Business Research, 62(9), 916-919.
Pástor, Ľ., Stambaugh, R. F., & Taylor, L. A. (2015). Scale and skill in active management. Journal of Financial Economics, 116(1), 23-45.
Peltomäki, J. (2011). h e performance of currency hedge funds and the yen/USD carry trade. International Journal of Finance & Economics, 16(2), 103-113.
Roumpis, E., & Syriopoulos, T. (2014). Dynamics and risk factors in hedge funds returns: implications for portfolio construction and performance evaluation. Th e Journal of Economic Asymmetries, 11, 58-77.
Saad, N., & Ribeiro, C. D. O. (2006). Um modelo de gestão de ativo/passivo: aplicação para fundos de benefício dei nido com ativos de l uxo incerto. Revista de Contabilidade e Finanças, 17(2),75-87.
Sanglard, A., Carneiro, J., Baiocchi, A., Freitas, P., & Schiavo, M. (2014). h e Marisol case: challenges of international growth for a successful Brazilian designer apparel i rm. Journal of Business Research, 67(4), 576-581.
Schutt, I. G., & Caldeira, J. F. (2013). Análise de estilo dinâmica de fundos multimercados: aplicação para o mercado brasileiro.
Anais do XLI Encontro Nacional de Economia, Foz do Iguaçu, PR, Brasil, 137.
Scolese, D., Bergmann, D. R., da Silva, F. L., & Savoia, J. R. F. (2015). Análise de estilo de fundos imobiliários no Brasil. Revista de Contabilidade e Organizações, 9(23), 24-35. Sharpe, W. F. (1988). Determining a fund’s ef ective asset mix.
Investment Management Review, 2, 59-69.
Sharpe, W. F. (1992). Asset allocation: Management style and performance measurement. Th e Journal of Portfolio Management, 18(2), 7-19.
Silva, C. G. (2014). Quinze anos de metas para a inl ação do Brasil.
AgroANALYSIS, 34(6), 9.
Tadeu, H. F. B., & Silva, J. T. M. (2013). h e determinants of the long term private investment in Brazil: an empyrical analysis using cross-section and a Monte Carlo simulation. Journal of Economics, Finance & Administrative Science, 18, 11-17. Ter Horst, J. R., Nijman, T. E., & de Roon, F. A. (2004). Evaluating
style analysis. Journal of Empirical Finance, 11(1), 29-53. Treynor, J., & Mazuy, K. (1966). Can mutual funds outguess the
market? Harvard Business Review, 44(4), 131-136. Trindade, J. A. S., & Malaquias, R. F. (2015). Análise de
desempenho de fundos de investimento de renda i xa e renda variável. RAGC, 3(5), 76-95.
Varga, G. (2001). Índice de Sharpe e outros indicadores de performance aplicados a fundos de ações brasileiros. Revista de Administração Contemporânea, 5(3), 215-245.
Varga, G., & Valli, M. (1998). Análise de estilo baseada no retorno. Retrieved from http://www.fce.com.br/servicos/artigos.php#. Varga, G., & Wengert, M. (2011). A indústria de fundos de
investimentos no Brasil. Revista de Economia e Administração,
10(1), 66-109.
Vicente, J., & Tabak, B. M. (2008). Forecasting bond yields in the Brazilian i xed income market. International Journal of Forecasting, 24(3), 490-497.
Vidal-García, J., Vidal, M., Boubaker, S., & Uddin, G. S. (2016). h e short-term persistence of international mutual fund performance. Economic Modelling, 52, 926-938.
Vilella, P. A., & Leal, R. P. C. (2008). O desempenho de fundos de renda i xa e o índice de renda de mercado (IRF-M). RAE-eletrônica, 7(1).
Weng, H., & Trück, S. (2011). Style analysis and value-at-risk of Asia-focused hedge funds. Pacifi c-Basin Finance Journal, 19(5), 491-510.
Yoshinaga, C. E., Castro, F. Jr., Lucchesi, E., & Oda, A. (2009). Análise de estilo em fundos multimercados com e sem alavancagem no Brasil. Revista Eletrônica de Gestão, 2(1), 9-21.
Correspondence address:
Cláudia Olímpia Neves Mamede Maestri
Universidade Federal de Uberlândia, Faculdade de Gestão e Negócios Avenida João Naves de Ávila, 2121, Sala 1F 216 – CEP: 38400-902 Campus Santa Mônica – Uberlândia – MG – Brasil
Exposition to F
actors of the In
vestment Funds Market in Br
azil
R. Cont. F
in.
– USP
, São P
aulo, v
. 28, n. 73, p. 61-76, jan./abr
. 2017
Appendix A
Results of the exposure of factors of the portfolios for fi xed income funds and Neutral Long & Short multimarket funds by Student’s t-test within the period from 2005 to 2014
IBOVESPA DOLLAR SELIC IGPM MULTIM FIXEDINCOME
Year FI MM FI MM FI MM FI MM FI MM FI MM
2005 1.350 -13.500 *** 1.160 -11.670 *** 12.360 *** -3.490 *** 1.850 * -5.080 *** 0.270 4.600 *** 7.630 *** 4.510 *** 2006 1.480 -22.610 *** -1.290 -14.180 *** 12.440 *** -0.920 -0.870 0.350 -0.740 10.660 *** 7.510 *** -0.310 2007 0.610 -24.410 *** 0.120 -12.610 *** 7.000 *** 1.490 0.480 -1.460 -1.530 7.930 *** 11.190 *** -3.000 *** 2008 0.400 -1.080 1.390 -11.800 *** 3.540 *** 5.650 *** -0.170 2.190 ** 0.050 8.450 *** 9.110 *** -7.790 *** 2009 0.900 -16.640 *** 0.060 -8.030 *** 3.430 *** 6.290 *** -1.660 * 2.200 ** -2.190 ** 13.550 *** 10.360 *** -10.150 *** 2010 -0.930 -17.660 *** 1.270 -9.650 *** 7.130 *** 3.840 *** -0.930 0.410 1.480 21.060 *** 10.530 *** -7.690 *** 2011 -0.790 -12.920 *** -0.790 -3.950 *** 7.530 *** 2.500 ** 1.810 * 0.380 1.040 15.650 *** 12.790 *** -6.800 *** 2012 -3.350 *** -9.420 *** 0.870 -2.810 *** 12.540 *** -1.270 -0.310 -1.110 2.340 ** 6.220 *** 18.240 *** -1.170 2013 0.300 -11.430 *** -4.970 *** -10.860 *** 7.360 *** -1.390 -1.560 -4.010 *** -1.870 10.780 *** 27.610 *** -9.590 *** 2014 0.440 -7.910 *** -0.090 -1.310 1.520 -1.330 -1.250 -5.290 *** -0.210 9.530 *** 25.380 *** -2.270
DOLLAR = variable corresponding to return in the historical series of dollar rates; IBOVESPA = BOVESPA Index (representative variable of the stock market); IGPM = General Index of Market Price (price movement indicator calculated monthly by the Getulio Vargas Foundation); MM = Neutral Long & Short multimarket funds; MULTIM = daily average of returns for multimarket funds throughout the period; FIXEDINCOME = average daily returns for fi xed income funds throughout the period; FI = fi xed income funds; SELIC = Special System of Liquidation and Custody (return of the variable corresponding to estimated revenue for government bonds).
* = signifi cant at 10%; ** = signifi cant at 5%; *** = signifi cant at 1%.