Mitochondrial and nuclear markers reveal isolation by distance
and effects of Pleistocene glaciations in the northeastern
Atlantic and Mediterranean populations of the
white seabream (Diplodus sargus, L.)
Vera S. Domingues
a,b,⁎
, Ricardo S. Santos
b, Alberto Brito
c,
Markos Alexandrou
d,e, Vitor C. Almada
aa
Instituto Superior de Psicologia Aplicada, Unidade de Investigação em Eco-Etologia, R. Jardim do Tabaco 34, 1149-041 Lisboa, Portugal
b
Departamento de Oceanografia e Pescas, Universidade dos Açores, 9901-862 Horta, Açores, Portugal
c
Universidad de La Laguna, Dpto. Biología Animal (Ciencias Marinas), Avenida Astrofísico Francisco Sánchez s/n, 38206, La Laguna, Tenerife, Islas Canarias
d
Department of Ecology and Evolutionary Biology, University of California Santa Cruz, 100 Shaffer Road, Santa Cruz, 95060, California, USA
eDepartment of Biology, University of London, Imperial College London, South Kensington Campus, London SW7 2AZ United Kingdom
Received 28 September 2006; received in revised form 7 March 2007; accepted 9 March 2007
Abstract
Phylogeography of Diplodus sargus from the northeastern Atlantic and the Mediterranean was assessed using sequences from the mitochondrial control region and the first intron of the S7 ribosomal protein gene. The relationship between genetic and geographic distances supported an isolation by distance model, with the Azores having a peripheral position. The geographic distribution of the genetic diversity, together with the historical demography of the populations studied can be explained by the effect of the Pleistocene glaciations in the northeastern Atlantic warm water fauna. D. sargus might have disappeared from western Europe during glacial peaks and suffered considerable demographic reductions in the Canaries and Mauritania, surviving in less affected areas such as Madeira, Azores and the Mediterranean. The mismatch analysis and the Fu's Fs values provide clear evidence of expansion in western Iberia (S. Pedro), Canaries, Mauritania and also in the eastern Mediterranean. Atlantic and Mediterranean populations of D. sargus showed no signs of genetic differentiation. D. sargus are active swimmers that can undergo extensive movements along the shores. This and the presence of planktonic eggs and larvae would allow rapid mixing between Mediterranean and Atlantic fish, erasing signs of population differentiation.
© 2007 Elsevier B.V. All rights reserved.
Keywords: Diplodus sargus; Isolation by distance; Northeastern Atlantic; Mediterranean; Pleistocene glaciations
1. Introduction
Diplodus sargus is an Atlantic–Mediterranean spe-cies complex belonging to the family Sparidae, with only one subspecies living out of this area. The complex includes six subspecies: D. s. sargus in the Mediterranean ⁎ Corresponding author. Instituto Superior de Psicologia Aplicada,
Unidade de Investigação em Eco-Etologia, R. Jardim do Tabaco 34, 1149-041 Lisboa, Portugal. Tel.: +351 218811700; fax: +351 218860954.
E-mail address:v_domingues@yahoo.com(V.S. Domingues). 0022-0981/$ - see front matter © 2007 Elsevier B.V. All rights reserved. doi:10.1016/j.jembe.2007.03.002
and Black Sea; D. s. cadenati in the eastern Atlantic (from the Bay of Biscay to Senegal including the islands of the Azores, Madeira and Canaries); D. s lineatus which is endemic to Cape Verde islands; D. s. helenae in St. Helena island; D. s ascensionis in Ascension island; and D. s. kotschyi from the Persian Gulf and northern Indian Ocean. Another subspecies of the complex, Diplodus sargus capensis, which occurs from Angola to Mozam-bique and southern Madagascar, has been recently considered a species (Diplodus capensis) by Heemstra and Heemstra (2004).
The diversification of D. sargus seems to have resulted from a rapid series of colonization events originated in the eastern Atlantic, which is supported by morphological (De la Paz et al., 1973) and molecular (Summerer et al., 2001) phylogenies.
Like other Sparids, D. sargus has commercial value and is of great interest for aquaculture. Young are euryhaline, entering brackish waters and lagoons in the spring. The adults can be found in a diverse range of habitats, including coastal rocky reefs, sandy bottoms, and seagrass beds (Posidonia oceanica in the Mediter-ranean). They congregate in schools of 5–50 indivi-duals, feeding on polychaetes, mollusks and sea urchins (Bauchot and Hureau, 1986; pers observ.). D. sargus are non-guarders and have pelagic eggs and larvae.
Bargelloni et al. (2005)assessed the extent of genetic differentiation of D. sargus in the Mediterranean including a sample from the Atlantic immediately outside of the Gibraltar Strait. Results, based on the analysis of allozymes and a fragment of the mitochondrial control region, showed lack of population structure and no appreciable genetic differences between the Mediterra-nean and Atlantic samples. A molecular phylogeny by
Summerer et al. (2001)yielded similar results.
Although the Mediterranean populations of D. sargus have been studied, little is known about the distribution of genetic variability within the Atlantic. The northeast-ern Atlantic has experienced severe climatic and sea level fluctuations during the Pleistocene glaciations (Briggs, 1996; Adams et al., 1999). Current research suggests that these glaciation events were very influen-tial in shaping patterns of genetic variability and the geographic distribution of marine fauna from this region (Almada et al., 2001; Domingues et al., 2006, 2007; Stefanni et al., 2006). The warm-water fauna of the most affected regions like the western coast of Europe and, to some extent, the Azores and Canaries islands (Crowley, 1981; Dias et al., 1997) must have not survived in those regions. Most of the organisms now present would have recolonized these areas after the glaciating events from some southern regions such as Madeira, the western
African tropical coast, or the Mediterranean (Briggs, 1974; Miller, 1984; Santos et al., 1995).
Previous phylogeographic and phylogenetic studies of warm water benthic fish of the northeastern Atlantic (Chromis limbata,Domingues et al., 2006; Tripterygion delaisi, Domingues et al., 2007) showed that the postglacial recolonization followed two routes: fish reached the Azores from Madeira, which in turn is connected to the western African coast, while the southwestern European shores were colonized from Mediterranean refugia. On the contrary, a study on Li-phophris pholis, a benthic fish more tolerant to cooler waters, showed a high level of differentiation for the Azorean population, strongly suggesting that it survived the modest sea cooling of the Azores during the glaciations (Stefanni et al., 2006).
In this paper we tested the hypothesis that the relationships among the populations of D. sargus follow a pattern characterized by isolation by distance com-bined with substantial gene flow among populations. This hypothesis stems from the following features of D. sargus: 1) the species is benthopelagic and not benthic, which means that, dispersal is achieved not only by eggs and larvae but also by adults that can move to depths much greater (deeper than 50 m in the Atlantic,Bauchot and Hureau, 1986) than those tolerated by the species included in the studies mentioned above; 2) judging from the present day distribution of the species, it must have survived the drops in sea surface temperatures estimated for Mauritania, Madeira and the Azores (Crowley, 1981) and the Mediterranean (Thiede, 1978) having became extinct in the Atlantic shores of western Europe (Dias et al., 1997) and perhaps in the further eastern islands of the Canaries (Crowley, 1981).
In this study we focus on the phylogeography of D. sargus covering eastern and western Mediterranean, and the northeastern Atlantic including the Azores, Madeira and Canaries archipelagos and also the Portu-guese and Mauritanian coasts. Sequences from a fragment of the mitochondrial control region and the 1st intron of S7 ribossomal protein gene were obtained and genetic diversities, gene flow levels and historical demography of the populations were determined. Results were interpreted in light of palaeoclimatic events, contemporary oceanic current patterns and the ecology of the species.
2. Materials and methods
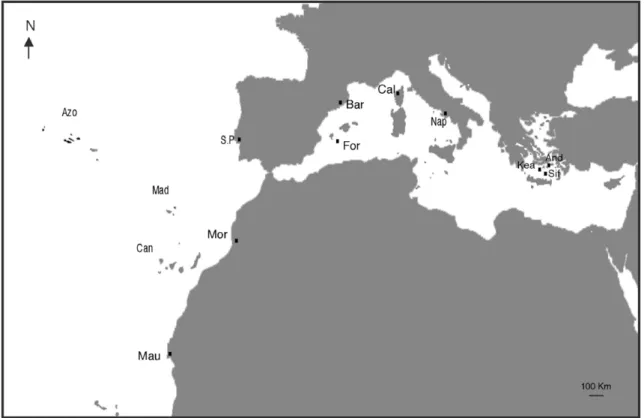
2.1. Sample collection and laboratorial procedures Individuals of D. sargus were obtained from five locations in the Atlantic and six locations in the
Mediterranean (Fig. 1and Table 1). Additionally, one individual of Diplodus vulgaris was collected from São Pedro and used as outgroup. Fish were collected by spear fishing while scuba diving, by line fishing or with hand nets in tide pools. Sampled individuals were non-spawning adults. Fin clips were cut immediately after collection of the individuals and stored at ambient temperature in 95% ethanol. Total genomic DNA was extracted by SDS proteinase K procedure and purified by standard chloroform and isopropanol precipitation (Sambrook et al., 1989). Amplification of the 5′
hypervariable portion of the mitochondrial control region (also called D-loop) was accomplished with universal primers L-Pro1 and H-DL1 (Ostellari et al., 1996), and used a cycling profile of 1 min at 92 °C, 1 min at 50 °C, 1 min at 72 °C, for 30 cycles. Each 13μl reaction contained 5–50 ng of DNA, 10 mM Tris HCL (pH 8.3), 50 mM KCl, 1.5 mM MgCl2, 1.25 u of Taq
DNA polymerase (Perkin-Elmer, Norwalk, Conn.), 150 mM of each dNTP, and 0.3 mM of each primer.
In addition, we amplified and sequenced the first intron of the S7 ribosomal protein gene, using the primers S7RPEX1F and S7RPEX2R (Chow and Hazama, 1998) and an annealing temperature of
56 °C. PCR amplification was performed as described for the mitochondrial control region. After purification following the manufacturer's protocol (Applied Biosys-tems, Forter City, CA), direct sequencing was performed with an ABI 3100 automated sequencer (Applied Biosystems).
2.2. Data analysis
2.2.1. Mitochondrial control region
Sample size was increased with two mitochondrial control region sequences of Diplodus sargus sargus from Calvi (France) and two sequences of D. s. cadenati from Agadir (Morocco) available in GenBank (Acces-sion numbers: AF365348 AF365349 AF365350 AF365351).
Sequences were aligned using the CLUSTAL V (Higgins et al., 1991) implemented by Sequence Navigator (Applied Biosystems). Gaps were not includ-ed in the analyses. Population diversity indexes (number of haplotypes, haplotype and nucleotide diversities, p-distances and % of private haplotypes) were calculated using the software package ARLEQUIN (vers. 2.000;
Schneider et al., 2000).
Fig. 1. Diplodus sargus sampling locations. Individuals included in this study were collected from the Mediterranean (western and eastern basins) and from the Atlantic in the European and African coasts as well as in the astern Atlantic islands of Azores, Madeira and Canaries. Labels are shown in
Phylogenetic relationships between individuals were assessed using Maximum Parsimony (Farris, 1970) and Neighbor–Joining (Saitou and Nei, 1987) using D. vulgaris as outgroup. As we were dealing with very closely related species, with small genetic distances, we adopted the Uncorrected p-distance following Nei and Kumar (2000). Both methods were implemented by the software package PAUP (vers. 4.0; Swofford, 1998). Topological confidence was evaluated for Maximum Parsimony and Neighbor–Joining with 1000 bootstrap replicates (Felsenstein, 1985). Uncorrected p-distances for all the populations were estimated and visualized using a multidimensional scaling analysis performed in STATISTICA (version 7.1; Statsoft Inc.).
Gene flow (Fst) was estimated using ARLEQUIN (vers. 2.000;Schneider et al., 2000). Pairwise compar-isons were estimated for the populations with similar sample sizes. Samples from the three Greek islands (Kea, Sifnos and Andros) were analyzed together since they are geographically very close. Corrections for simultaneous multiple comparisons were applied using sequential Bonferroni correction (Rice, 1989).
Popula-tion structure was assessed by an analysis of molecular variance (AMOVA;Excoffier et al., 1997) implemented in ARLEQUIN (vers. 2.000;Schneider et al., 2000). To test for isolation by distance (IBD) we applied the Mantel test (Mantel, 1967) to two matrices, Fst values and log geographical distances in Km between locali-ties. We used IBD 1.4 (Bohonak, 2002) to perform the Mantel test, using 1000 replicates to test significance.
The historical demography of each population was examined using mismatch distributions analysis per-formed in ARLEQUIN (vers. 2.000; Schneider et al., 2000). Theoretical studies have shown that populations in long stable demographic equilibrium show a chaotic mismatch distribution, while recent rapid population expansions or bottlenecks are reflected in a unimodal (approximately Poisson) profile (Rogers, 1995; Rogers and Harpending, 1992). Mismatch distributions were established and their fit to Poisson distributions was assessed by Monte Carlo simulations of 1000 random samples. The sum of square deviations (SSD) between observed and expected mismatch distributions was used as a test statistics, its P value representing the probability Table 1
Collection localities of Diplodus sargus used in the present study and diversity indexes for mitochondrial control region
Localities N Hn Hd π p-distance (average) p-distance (max) p-distance (min) % private H Collection date Atlantic Portugal
Azo—Azores (Faial) 18 8 0.850 0.027 0.024 0.042 0.000 87.5 Nov. 2003
Mad—Madeira (Funchal) 20 15 0.968 0.035 0.034 0.054 0.000 73.3 Sep. 2003
S.P—S. Pedro 21 21 1.000 0.036 0.033 0.055 0.000 95.2 Nov. 2003
Spain
Can—Canaries (Tenerife) 15 14 0.990 0.034 0.032 0.047 0.000 85.7 Nov. 2005
Morocco
Mor—(Agadir) 2 2
Mauritania
Mau—(Nouakchott) 17 17 1.000 0.033 0.032 0.055 0.000 70.6 Nov. 2005
Western Mediterranean Spain
For—Formentera 1 Oct. 2003
Bar—Barcelona 27 23 0.971 0.024 0.022 0.04 0.000 78.3 Dec. 2006
France
Cal—Calvi 2 2
Italy
Nap—Naples 6 6 1.000 0.026 0.050 0.037 0.005 83.3 Oct. 2003
Eastern Mediterranean Greece
Kea—Kea 9 9 1.000 0.028 0.027 0.045 0.005 55.6 Jun. 2006
Sif—Sifnos 8 8 1.000 0.033 0.032 0.050 0.003 100 Jun. 2006
And—Andros 1 Aug. 2006
Total 147
Number of individuals (N), number of haplotypes (Hn), Haplotype diversity (Hd), Nucleotide diversity (π), Uncorrected p–distances and percentage of private haplotypes (% private H) for each population are shown. Samples collection date is shown for each location in the last column.
of obtaining a simulated SSD larger or equal to the observed one (Schneider and Excoffier, 1999). In addition Fu's Fs neutrality test (Fu, 1997) was used to detect possible population expansions.
2.2.2. First intron of the S7 ribosomal protein gene Sequences were aligned using the CLUSTAL V implemented by Sequence Navigator (Applied Biosys-tems). Heterozygous positions could not be ascribed to each sequence of each individual. Thus, we scored and converted those positions into a codominant genetic marker dataset. Linkage disequilibrium was tested using the program GENETIX 4.04 (Belkhir et al., 1996–2004) and only unlinked loci were used in subsequent ana-lyses. Samples from the Mediterranean were analyzed in two populations: western Mediterranean (Barcelona and Naples) and eastern Mediterranean (Greek islands). Gene diversity, allelic frequencies, observed and ex-pected heterozygosity and exact probability tests for deviations from Hardy–Weinberg equilibrium (HWE) were performed using the same program. All tests were conducted using 1000 permutations. The proportion of shared alleles (Ps) for pairs of populations was cal-culated as the number of shared alleles summed over loci divided by twice the number of loci, as inBowcock et al. (1994). A genetic distance matrix between pairs of populations was obtained by-ln (Ps). UPGMA cluster analysis was conducted using the PHYLIP software package (Felsenstein, 1989).
Fst, population structure and isolation by distance were estimated using the same procedures as for the mitochondrial control region fragment.
3. Results
3.1. Genetic diversity and phylogenetic analysis 3.1.1. Mitochondrial control region
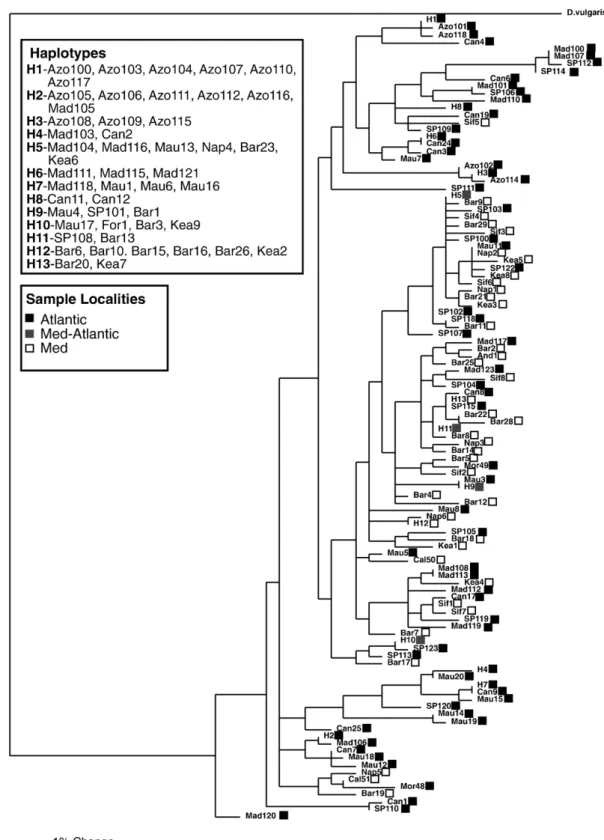
A total of 143 D. sargus mitochondrial control region sequences were obtained (GenBank Accession numbers: EF468518–EF468623). Fragments were 385 bp long. All populations showed high genetic diversity (Table 1). Phylogenetic trees recovered using Maximum Parsimony and Neighbor–Joining yielded similar topologies (Fig. 2). The phylogenetic trees showed no partition between Atlantic and Mediterra-nean populations of D. sargus. Four haplotypes (H5, H9, H10 and H11; Fig. 2) were shared between the Atlantic and Mediterranean and samples from both regions grouped together. Clades containing haplotypes from only one region showed very low bootstraps values.
3.1.2. First intron of the S7 ribosomal protein gene The first intron of the S7 ribosomal protein gene was amplified for a total of 127 individuals (GenBank Accession numbers: EF467669–EF467796). A total of 308 bp were successively sequenced. Individuals differed only in base frequencies in heterozygous positions. A total of 47 polymorphic positions were found. As we could not ascribe the two alleles of heterozygous positions to one of the sequences of each individual, we used those positions as a dataset of codominant genetic markers. After eliminating loci that were shown to be linked, our dataset was represented by 13 loci. Allelic frequencies of these 13 loci are shown inTable 2. None of the loci showed deviations from Hardy–Weinberg equilibrium. Gene diversities estimated based on the 13 loci are also shown inTable 2. The Azores appears as the least genetically diverse population.
3.2. Population structure
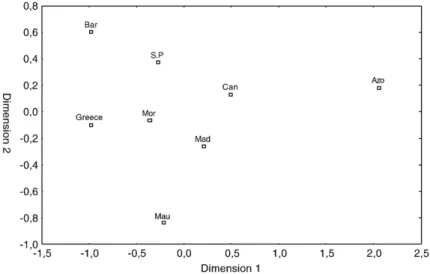
The relationship across populations based on the genetic distances calculated for the mitochondrial control region can be visualized in the form of a multidimensional scaling plot (Fig. 3). This plot shows the Azores as the most differentiated population. The UPGMA tree built using the distance based on the proportion of S7 intron shared alleles (Fig. 4) also shows the Azores as a more differentiated population.
Gene flow was high between all the populations (Table 3). Fst estimates, based on the mitochondrial control region sequences, between the Azores and all the other population were higher than all other pairwise comparisons, suggesting the Azores as the most isolated population. Fst values between Atlantic and Mediterra-nean populations also yielded significant values. The isolation of the Azores and Mediterranean is not shown by the Fst values estimated from the S7 data. Indeed, this marker yielded very low and not significant Fst values for all pairwise comparisons except for Azores versus the Greek islands. To assess the existence of population structure within D. sargus we applied an AMOVA analysis. Additionally, to evaluate the differ-entiation between Atlantic and Mediterranean we applied an AMOVA grouping population into Atlantic and Mediterranean groups. Results showed lack of population structure for D. sargus. In both cases, a high percentage of the variance in the data derived from within-population variance (Table 4). Only a very small percentage of the data variance was attributable to the separation of Atlantic and Mediterranean populations and, in the case of D-loop, this value was very similar to the variance among populations within each group
Fig. 2. Phylogenetic relationships of Atlantic and Mediterranean D. sargus using D. vulgaris as outgroup. None of the major branches showed bootstrap supports above 50%. Labels are described inTable 1. The length of each branch is proportional to the number of nucleotide substitutions. Scale bar: 1% uncorrected p genetic distance.
(Table 4). The IBD test showed a significant correlation between Fst and log geographical distances (r2= 0.542 and 0.688; P = 0.018 and 0.011 for D-loop and S7 respectively), pointing to the existence of genetic isolation by geographic distance.
3.3. Historical demography
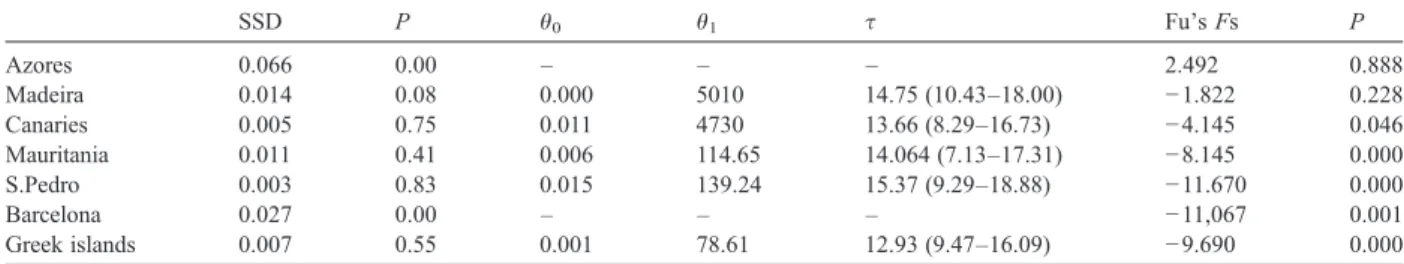
Mismatch distributions based on the mitochondrial control region sequences were estimated (Fig. 5) and
SSD tests were performed (Table 5). The model of sudden expansion was only rejected for the Azores and Barcelona, although visual inspection of the mismatch distribution show a unimodal profile for the later population. P values for Madeira were close to the limit of rejection. Fu's Fs values were significantly negative for all the populations except for the Azores and Madeira.
Estimates of expansion parameterτ were similar for all the populations. This parameter is equal to 2tμ, Table 2
Sample size (N), Gene diversity and allelic frequencies obtained from the heterozygous positions of the first intron of the S7 ribosomal gene sequences
Azo Mad Can Mau S.P W. Med E. Med
N 17 17 11 11 21 33 18 Gene diversity 0.567 0.741 0.758 0.684 0.785 0.754 0.787 Locus 1 Freq. Allele 1 0.000 0.029 0.000 0.045 0.048 0.045 0.056 Freq. Allele 2 1.000 0.971 1.000 0.955 0.952 0.955 0.944 Locus 2 Freq. Allele 1 0.000 0.088 0.000 0.091 0.071 0.000 0.000 Freq. Allele 2 1.000 0.912 1.000 0.909 0.929 1.000 1.000 Locus 3 Freq. Allele 1 0.000 0.000 0.000 0.000 0.024 0.000 0.056 Freq. Allele 2 1.000 1.000 1.000 1.000 0.976 1.000 0.944 Locus 4 Freq. Allele 1 0.000 0.059 0.091 0.045 0.024 0.030 0.083 Freq. Allele 2 1.000 0.041 0.909 0.955 0.976 0.970 0.917 Locus 5 Freq. Allele 1 0.000 0.000 0.045 0.000 0.024 0.030 0.000 Freq. Allele 2 1.000 1.000 0.955 1.000 0.976 0.970 1.000 Locus 6 Freq. Allele 1 0.147 0.176 0.182 0.045 0.071 0.106 0.083 Freq. Allele 2 0.853 0.824 0.818 0.955 0.929 0.894 0.917 Locus 7 Freq. Allele1 0.118 0.000 0.000 0.045 0.071 0.015 0.028 Freq. Allele 2 0.882 1.000 1.000 0.955 0.929 0.985 0.972 Locus 8 Freq. Allele 1 0.235 0.324 0.318 0.273 0.333 0.545 0.611 Freq. Allele 2 0.765 0.676 0.682 0.727 0.667 0.455 0.389 Locus 9 Freq. Allele 1 0.000 0.000 0.045 0.000 0.000 0.000 0.028 Freq. Allele 2 1.000 1.000 0.955 1.000 1.000 1.000 0.972 Locus 10 Freq. Allele 1 0.000 0.000 0.045 0.000 0.024 0.000 0.000 Freq. Allele 2 1.000 1.000 0.955 1.000 0.976 1.000 0.000 Locus 11 Freq. Allele 1 0.000 0.029 0.000 0.000 0.024 0.000 0.000 Freq. Allele 2 1.000 0.971 1.000 1.000 0.976 1.000 1.000 Locus 12 Freq. Allele 1 0.000 0.029 0.091 0.045 0.024 0.076 0.083 Freq. Allele 2 1.000 0.971 0.909 0.976 0.924 0.917 0.949 Locus 13 Freq. Allele 1 0.000 0.000 0.000 0.000 0.000 0.015 0.000 Freq. Allele 2 0.000 0.000 .0000 .0000 0.000 0.015 0.000 Freq. Allele 3 1.000 1.000 1.000 1.000 1.000 0.970 1.000
where t is the time of the expansion and μ is the mutation rate. Thus, population expansion occurred at approximately the same time in all samples. Although estimates of θ are less accurate than τ (Schneider and Excoffier, 1999), values ofθ0are similar and very low,
suggesting that D. sargus has undergone a bottleneck before the population expansion.
4. Discussion
Our data confirm the results of other molecular phylogenies (Summerer et al., 2001; Bargelloni et al., 2005) which found no appreciable genetic differences between Atlantic and Mediterranean D. sargus and no evidence supporting the distinction between D. s.
cadenati and D. s. sargus. Bargelloni et al. (2005)
considered two hypotheses to explain this lack of differentiation. Either D. sargus is a recent immigrant in the Mediterranean or historical bottlenecks and recolo-nization processes prevented strong differentiation of Atlantic and Mediterranean basins. Our data showed high genetic diversities for the Mediterranean, even in the eastern basin, and lack of clear evidence of popu-lation expansion in the western basin. These findings make a recent invasion of the Mediterranean unlikely.
The relationship between genetic and geographic distances supported an isolation by distance model as predicted by the hypothesis outlined in the introduction. If we consider the Fst values and the Uncorrected p-distances for the mitochondrial control region (Table 3
and Fig. 3), together with the pattern of S7 ribosomal protein gene shared alleles (Fig. 4) a number of features emerge: 1) the peripheral position and low genetic diversity of the Azores; 2) the substantial connection among the Azores, Madeira and Canary islands; and 3) the proximity of western Portugal and the Mediter-ranean. The same pattern was also described for other species such as Ophioblennius atlanticus (Muss et al., 2001), Chromis limbata (Domingues et al., 2006) and Tripterygion delaisi (Domingues et al., 2007).
The Fsts computed from S7 were generally lower than those for the D-loop. This is not surprising since, because mtDNA is haploid and only maternally inherited, mitochondrial genes have a fourfold lower effective population size than the nuclear ones, which makes fixation of mutations much slower in the nuclear genes. The only significant difference was found when comparing the Azores with the Greek islands, which are the most geographically distant sites. Thus, overall our Fig. 3. Multidimensional scaling based on Diplodus sargus mitochondrial control region Uncorrected p-distances. SeeTable 1for labels.
Fig. 4. Phenogram based on the genetic distance obtained from the proportion of S7 intron shared alleles between Diplodus sargus populations. The phenogram was estimated using the UPGMA cluster analysis. SeeTable 1for labels.
results provide evidence supporting our hypothesis, specifically suggesting that the Azorean population persisted through the glacial cycles, and that gene flow is probably substantial among populations conforming to a pattern of isolation by distance.
The geographic distribution of the genetic variability shown by our data is easily explained by the paleo– biogeographic history of the eastern Atlantic. Briggs (1974) proposed that the severe Pleistocene climatic fluctuations that occurred in the northeastern Atlantic (Adams et al., 1999) had a strong impact in the coastal fauna of the region, leading to local extinctions and latitudinal shifts of many taxa. The coasts of Biscay and western Iberia were particularly affected by a very pronounced southern migration of the polar front (Crowley, 1981; Dias et al., 1997) reaching temperatures too low for D. sargus to survive. The sea surface temperatures in the Azores region decreased about 2– 3 °C (Crowley, 1981). Such a decline would bring the sea surface temperatures at the Azores to values similar to those prevailing nowadays in western Iberia where D. sargus breeds and grows successfully. Thus, it is unlikely that the Azorean population was eliminated by the glaciations. The archipelago of Madeira, located further south, was even less affected, while the Canaries (at least the eastern islands) were severely affected due to its proximity to the continent and to the influence of upwelling effects (Barton et al., 1998). The Mauritanian
population, being geographically close to the thermal stable tropical coast of Africa must have quickly received fish from the southern refugia after the Pleistocene glaciations and acted later as a source for the northern colonization. Taking this into consider-ation, recent research suggests that Saharan upwelling filaments are capable of transporting larvae from the African neritic zone into oceanic areas and towards the Canary archipelago (Rodríguez et al., 1999, 2004). Indeed, D. sargus from Madeira and Mauritania showed high genetic diversities and low percentages of private haplotypes (Table 1). Another region where warm water pockets persisted during the Pleistocene, although in areas much smaller than today, is the Mediterranean (Thiede, 1978). The mismatch analysis and the Fu's Fs values showed a clear population expansion for the eastern Mediterranean basin (Greek islands), but not for the western basin (Barcelona). The historical demogra-phy of D. sargus based on the mitochondrial control region supports the hypothesis outlined above, which assumes that D. sargus disappeared from the Atlantic shores of Europe during glacial peaks and suffered considerable demographic reductions in the Canaries and Mauritania, surviving in Madeira, Azores and in some regions of the Mediterranean. Interestingly, the values of Fu's Fs and SSD only provide clear evidence of expansion in western Iberia (S. Pedro), Canaries, Mauritania and the Greek islands.
The dual pattern of refugia in the western tropical African coast and Madeira and in the Mediterranean, probably explains splits between sister taxa like those between Parablennius parvicornis and P. sanguinolen-tus (Almada et al., 2005); Chromis limbata and C. chromis (Domingues et al., 2006); or the forms of Tripterygion delaisi from the oceanic islands and the Mediterranean populations (Domingues et al., 2007). Why then does D. sargus lack the patterns of population differentiation that seem to be common in other warm water species previously examined? It is important to Table 3
Fst values for Diplodus sargus populations calculated from mitochondrial control region sequences (below the diagonal) and S7 intron (above the diagonal) using ARLEQUIN (version 2.000Schneider et al., 2000)
Azores Madeira Canaries Mauritania S. Pedro Barcelona Greek islands
Azores 0.006 0.005 0.000 0.000 0.077 0.118⁎ Madeira 0.173⁎ 0.000 0.000 0.000 0.030 0.055 Canaries 0.142⁎ 0.000 0.000 0.000 0.019 0.042 Mauritania 0.216⁎ 0.047 0.060 0.000 0.040 0.068 S. Pedro 0.190⁎ 0.018 0.045 0.049⁎ 0.025 0.047 Barcelona 0.328⁎ 0.150⁎ 0.196⁎ 0.139⁎ 0.048⁎ 0.000 Greek islands 0.300⁎ 0.096⁎ 0.147⁎ 0.100⁎ 0.017 0.027
Significant P values (Pb 0.05) after Bonferroni correction are indicated by an asterisk.
Table 4
Results of hierarchical analysis of molecular variance (AMOVA) Among groups Among populations within groups Within populations All populations – 12.20⁎/2.76⁎ 87.80/97.24 Mediterranean vs Atlantic 7.41⁎/6.16 7.13⁎/−0.84 84.86⁎/94.69⁎ Percentage of the data variance are shown for the mtDNA control region and the first intron of S7 ribossomal gene respectively. Significant values (Pb0.05) are indicated by an asterisk.
note that several of the species studied so far were rocky littoral or sub-littoral species that as adults show very restricted movements and are confined to the upper meters of the water column (P. sanguinolentus 1 m,
Zander, 1986; T. delaisi 3–40 m, Wirtz, 1978; C. limbata 5–45 m, Allen, 1991). In addition, blennids, tripterygiids and pomacentrids all show male parental care of demersal eggs, meaning that the planktonic phase is restricted to the larval stage. D. sargus spawns planktonic eggs, attains a size that is much larger than the species mentioned above and both juveniles and adults are active swimmers. Although precise data on the extent of their movements could not be found, it is likely that they can undergo extensive movements along the shores, a possibility that is absent for the adults of
blenniids and tripterygiids and even probably small pomacentrids like Chromis. This mobility of the adults would allow rapid mixing between Mediterranean and Atlantic fish. On the other hand, not being a strictly benthic fish, D. sargus may have profited, at least occasionally, from the numerous submarine banks and seamounts that have been mapped between the European mainland coast and the Azores archipelago (Kitchingman and Lai, 2004; Kitchingman et al., 2007). It is known that D. sargus can be found below 50 m in the Atlantic (Bauchot and Hureau, 1986). Several of the seamounts mentioned above reach such depths (eg. Gorringe-40 m, Lagabrielle and Auzende, 1982; Àmpere-18 m, Josephine-50 m, D. João de Castro-13 m, Cardigos et al., 2005). With sea level drops of
Table 5
Estimated values for the expansion model for each population: SSD (sum of square deviations) and its probability P;θ0andθ1(compound parameter
representing the mutation rate and the female efective population size before and after expansion respectively); andτ (time in generations, upper and lower bounds of 95% CI in parenthesis) Fu's Fs neutrality test and its probability P
SSD P θ0 θ1 τ Fu's Fs P Azores 0.066 0.00 – – – 2.492 0.888 Madeira 0.014 0.08 0.000 5010 14.75 (10.43–18.00) −1.822 0.228 Canaries 0.005 0.75 0.011 4730 13.66 (8.29–16.73) −4.145 0.046 Mauritania 0.011 0.41 0.006 114.65 14.064 (7.13–17.31) −8.145 0.000 S.Pedro 0.003 0.83 0.015 139.24 15.37 (9.29–18.88) −11.670 0.000 Barcelona 0.027 0.00 – – – −11,067 0.001 Greek islands 0.007 0.55 0.001 78.61 12.93 (9.47–16.09) −9.690 0.000
Fig. 5. Mismatch distribution for Diplodus sargus populations based on the mitochondrial control region. The bars represent the observed frequency of the pairwise differences among haplotypes, while the line shows the expected curve predicted for a population that has undergone a demographic expansion in the past.
120–140 m in the glacial maxima (Lambeck et al., 2002) many of these seamounts were above sea water level, making the number of available stepping stones higher than today. If this interpretation is correct, we expect many other benthopelagic species, especially those with planktonic eggs, to show a less differentiated population structure than the benthic ones, when the Azores and Madeira are compared to southwestern Europe and the Mediterranean.
All phylogeographic studies published so far em-phasize the strong affinities of the Azorean populations with those of Madeira, Canaries and western Africa. In general, the migratory flow tends to prevail towards the Azores. Santos et al. (1995) and references therein showed that eddies capable of transporting fish, eggs and larvae from Madeira towards the Azores are frequent in the area. This, associated with the probable local extinctions of warmer water species during the glaciations at this archipelago, likely combine to explain the low level of endemism of these islands which have puzzled marine biogeographers for many years (Briggs, 1974). More studies with different types of organisms with distinct ecology and life histories will help to improve our understanding of the present and past biogeography of the area.
5. Conclusions
The present work reveals no signs of differentiation between the Atlantic and Mediterranean populations of D. sargus, confirming previous results. Gene flow patterns of the northeastern Atlantic and Mediterranean populations of D. sargus follow an isolation by distance model, with the Azorean being more isolated and less diverse than the other populations. Gene flow seems, however, to be higher than in benthic fishes with demer-sal eggs studied in the same geographical area. The geographic distribution of the genetic diversity, together with the historical demography of the populations studied can be explained by the effect of the Pleistocene glacia-tions in the northeastern Atlantic warm water fauna. D. sargus might have disappeared from the Atlantic coast of Europe during glacial peaks and suffered population bottlenecks in the Canaries and Mauritania, surviving in Madeira, Azores and in the Mediterranean.
Acknowledgments
We are grateful to several people for providing samples or helping in field work: Dolors Vinyoles Cartanyà, Joana Robalo, Josep Coll, Norberto Serpa, Sergio Stefanni, Paolo Sordino and Ricardo Beldade.
Thanks are also due to Telmo Morato concerning information on detailed distribution of the seamounts in the area. We also thank Estação Marítima do Funchal for support. Vera S. Domingues was supported by the Portuguese Foundation for Science and Technology (SFRH/BD/13069/2003). ISPA-UIE and IMAR-DOP/ UAz are funded by FCT and DRCT (in the case of DOP) through a pluri-annual and programmatic funding schemes (FEDER). This study was also funded by the FCT research grant PNAT/BIA/15017/99. [RH] References
Adams, J., Maslin, M., Thomas, E., 1999. Sudden climate transitions during the Quaternary. Prog. Phys. Geogr. 23 (1), 1–36. Allen, G.R., 1991. Damselfishes of the world. Mergus Publisheres,
Melle, Germany.
Almada, V.C., Oliveira, R.F., Gonçalves, E.J., Almeida, A.J., Santos, R.S., Wirtz, P., 2001. Patterns of diversity of the northeastern Atlantic blennid fish fauna (Pisces:Blenniidae). Glob. Ecol. Biogeogr. 10, 411–422.
Almada, F., Almada, V.C., Domingues, V.S., Brito, A., Santos, R.S., 2005. Molecular validation of the specific status of Parablennius sanguinolentus and Parablennius parvicornis (Pisces: Blenniidae). Sci. Mar. 69 (4), 519–523.
Bargelloni, L., Alarcon, J.A., Alvarez, M.C., Penzo, E., Magoulas, A., Palma, J., Patarnello, T., 2005. The Atlantic-Mediterranean transition: Discordant genetic patterns in two seabream species, Diplodus puntazzo (Cetti) and Diplodus sargus (L.). Mol. Phylogenet. Evol. 36, 523–535.
Barton, E.D., Arístegui, J., Tett, P., Cantón, M., García-Braun, J., Hernández-León, S., Nykjaer, L., Almeida, C., Almunia, J., Ballesteros, S., Basterretxea, G., Escánez, J., García-Weill, L., Hernández-Guerra, A., López-Laatzen, F., Molina, R., Montero, M.F., Navarro-Pérez, E., Rodríguez, J.M., van Lenning, K., Vélez, H., Wild, K., 1998. The transition zone of the Canary Current upwelling region. Prog. Oceanogr. 41, 455–504.
Bauchot, M.-L., Hureau, J.-C., 1986. Sparidae. In: Whitehead, P.J.P., Bauchot, M.-L., Hureau, J.-C., Nielsen, J., Tortonese, E. (Eds.), Fishes of the Northeastern Atlantic and the Mediterranean, vol. 2. UNESCO, Paris, pp. 883–907.
Belkhir, K., Borsa, P., Chikhi, L., Raufaste, N., Bonhomme, F., 1996– 2004. GENETIX 4.05, logiciel sous Windows TM pour la génétique des populations. Laboratoire Génome, Populations, Interactions, CNRS UMR 5000. Université de Montpellier II, Montpellier. Bohonak, A.J., 2002. IBD (Isolation by Distance): a program for
population genetic analyses of isolation by distance. J. Heredity 93, 153–154.
Bowcock, A.M., Ruiz-Linares, A., Tomfohrde, J., Minch, E., Kidd, J.R., Cavalli-Sforza, L.L., 1994. High resolution of human evolutionary trees with polymorphic microsatellites. Nature 368, 455–457.
Briggs, J.C., 1974. Marine Zoogeography. McGraw-Hill, New York. Briggs, J.C., 1996. Global Biogeography. Developments in
Paleon-tology and Stratigraphy, vol. 14. Elsevier, Amsterdam.
Cardigos, F., Colaço, A., Dando, P.R., Ávila, S.P., Sarradin, P.M., Tempera, F., Conceição, F.P., Pascoal, A., Santos, R.S., 2005. Shallow water hydrothermal vent field fluids and communities of the D. João de Castro Seamount (Azores). Chem. Geol. 224, 153–168.
Chow, S., Hazama, K., 1998. Universal PCR primers for S7 ribosomal protein gene introns in fish. Mol. Ecol. 7, 1247–1263.
Crowley, T.J., 1981. Temperature and circulation changes in the eastern north Atlantic during the last 150000 years: evidence from the planktonic foraminiferal record. Mar. Micropaleontol. 6, 97–129.
De la Paz, R.M., Bauchot, M.L., Daget, J., 1973. Les Diplodus (Perciformes, Sparidae) du groupe Sargus: systématique et phylogénie. Ichthyologia 5, 113–128.
Dias, J.A., Rodrigues, A., Magalhães, F., 1997. Evolução da linha de costa em Portugal, desde o último máximo glaciário até à actualidade: síntese dos conhecimentos. Estud. Quat. 1, 53–66. Domingues, V.S., Santos, R.S., Brito, A., Almada, V.C., 2006.
Historical population dynamics and demography of the eastern Atlantic pomacentrid Chromis limbata (Valenciennes, 1833). Mol. Phylogenet. Evol. 40, 139–147.
Domingues, V.S., Almada, V.C., Santos, R.S., Brito, A., Bernardi, G., 2007. Phylogeography and evolution of the triplefin Tripterygion delaisi (Pisces, Blennioidei). Mar. Biol. 150, 509–519.
Excoffier, L., Smouse, P.E., Quattro, J.M., 1997. Analysis of molecular variance inferred from metric distances among DNA haplotypes: application to human mitochondrial DNA restriction data. Genetics 131, 479–491.
Farris, J.S., 1970. Methods for computing Wagner trees. Syst. Zool. 19, 83–92.
Felsenstein, J., 1985. Confidence limits on phylogenies: an approach using the bootstrap. Evolution 39, 783–791.
Felsenstein, J., 1989. PHYLIP — Phylogeny Inference Package (Version 3.2). Cladistics 5, 164–166.
Fu, Y.-X., 1997. Statistical tests of neutrality of mutations against population growth, hitchhiking and background selection. Genet-ics 147, 915–925.
Heemstra, P., Heemstra, E., 2004. Coastal fishes of Southern Africa. NISC and SAIAB, Grahamstown (South Africa). 488 pp. Higgins, D.G., Bleasby, A.J., Fuchs, R., 1991. CLUSTAL V: improved
software for multiple sequence alignment. Cabios 8, 189–191. Kitchingman, A., Lai, S., 2004. Inferences on potential seamount
locations from mid-resolution bathymetric data. In: Morato, T., Pauly, D. (Eds.), Seamounts: biodiversity and fisheries, Fisheries Centre Research Report, vol. 12 (5), pp. 7–12.
Kitchingman, A., Lai, S., Morato, T., Pauly, D., 2007. How many seamounts are there and where are they located? In: Pitcher, T.J., Morato, T., Hart, P.J.B., Clark, M.R., Haggan, N., Santos, R.S. (Eds.), Seamounts: Ecology, Conservation and Management. Fish and Aquatic Resources Series. Blackwell, Oxford, UK. Lagabrielle, Y., Auzende, J.-M., 1982. Active in situ disaggregation of
oceanic crust and mantle on Gorringe Bank: analogy with ophiolitic massives. Nature 297, 490–493.
Lambeck, K., Esat, T.M., Potter, E.-K., 2002. Links between climate and sea levels for the past three million years. Nature 419, 199–206.
Mantel, N., 1967. The detection of disease clustering and generalized regression approach. Cancer Res. 27, 209–220.
Miller, P.J., 1984. The gobiid fishes of temperate Macaronesia (eastern Atlantic). J. Zool. Lond. 204, 363–412.
Muss, A., Robertson, D.R., Stepien, C.A., Wirtz, P., Bowen, B.W., 2001. Phylogeography of Ophioblennius: the role of ocean currents and geography in reef fish evolution. Evolution 3, 561–572.
Nei, M., Kumar, S., 2000. Molecular Evolution and Phylogenetics. Oxford University Press, Oxford.
Ostellari, L., Bargelloni, L., Penzo, E., Patarnello, P., Patarnello, T., 1996. Optimization of single-strand conformation polymorphism and sequence analysis of the mitochondrial control region in Pa-gellus bogaraveo (Sparidae, Teleostei): Rationalized tools in fish population. Anim. Genet. 27 (6), 423–427.
Rice, W.R., 1989. Analyzing tables of statistical tests. Evolution 43, 223–225.
Rodríguez, J.M., Hernández-León, S., Barton, E.D., 1999. Mesoscale distribution of fish larvae in relation to an upwelling filament off Northwest Africa. Deep-Sea Res., Part 1, Oceanogr. Res. Pap. 46, 1969–1984.
Rodríguez, J.M., Barton, E.D., Hernández-León, S., Arístegui, J., 2004. The influence of mesoscale physical processes on the larval fish community in the Canaries CTZ, in summer. Prog. Oceanogr. 62, 171–188.
Rogers, A.R., 1995. Genetic evidence for a Pleistocene population explosion. Evolution 49, 608–615.
Rogers, A.R., Harpending, H., 1992. Population growth makes waves in the distribution pf pairwise genetic differences. Mol. Biol. Evol. 93, 552–569.
Sambrook, J., Fritsch, E.F., Maniatis, T., 1989. Molecular Cloning a Laboratory Manual, 2nd ed. Cold Spring Harbor Laboratory Press, New York.
Santos, R.S., Hawkins, S., Monteiro, L.R., Alves, M., Isidro, E.J., 1995. Marine research, resources and conservation in the Azores. Aquat. Conserv. Mar. Freshw. Ecosyst. 5, 311–354.
Saitou, N., Nei, M., 1987. The neighbor–joining method: a new method for reconstructing phylogenetic trees. Mol. Biol. Evol. 4, 406–425.
Schneider, S., Excoffier, L., 1999. Estimation of past demographic parameters from the distribution of pairwise differences when the mutation rates vary among sites: application to human mitochon-drial DNA. Genetics 152, 1079–1089.
Schneider, S., Roessli, D., Excoffier, L., 2000. ARLEQUIN, Version 2.000: A Software for Population Genetics Data Analysis. University of Geneva, Switzerland.
Stefanni, S., Domingues, V.S., Bouton, N., Santos, R.S., Almada, F., Almada, V., 2006. Phylogeny of the shanny, Lipophrys pholis, from the NE Atlantic using mitochondrial DNA markers. Mol. Phylogenet. Evol. 39, 282–287.
Summerer, M., Hanel, R., Sturmbauer, C., 2001. Mitochondrial phylogeny and biogeographic affinities of sea bream of the genus Diplodus (Sparidae). J. Fish Biol. 59, 1639–1652.
Swofford, D.L., 1998. PAUP: Phylogenetic Analysis Using Parsimony and Other Methods. Sinauer Associates, Sunderland, MA. Thiede, J., 1978. A glacial Mediterranean. Nature 276, 680–683. Wirtz, P., 1978. The behaviour of the Mediterranean Tripterygion
species (Pisces, Blennioidei). Zeit. Tierpsychol. 48, 142–174. Zander, C.D., 1986. Blenniidae. In: Whitehead, P.J.P., Bauchot, M.-L.,
Hureau, J.-C., Nielsen, J., Tortonese, E. (Eds.), Fishes of the northeastern Atlantic and the Mediterranean, vol 3. UNESCO, Paris, pp. 1096–1112.