*Corresponding author: E-mail: mgervasiopereira01@ gmail.com
Received: March 28, 2016 Approved: November 18, 2016
How to cite: Beutler SJ, Pereira MG, Tassinari WS, Menezes MD, Valladares GS, Anjos LHC. Bulk density prediction for Histosols and soil horizons with high organic matter content. Rev Bras Cienc Solo. 2017;41:e0160158.
https://doi.org/10.1590/18069657rbcs20160158
Copyright: This is an open-access article distributed under the terms of the Creative Commons Attribution License, which permits unrestricted use, distribution, and reproduction in any medium, provided that the original author and source are credited.
Bulk Density Prediction for Histosols
and Soil Horizons with High Organic
Matter Content
Sidinei Julio Beutler(1)
, Marcos Gervasio Pereira(1)*
, Wagner de Souza Tassinari(2)
, Michele Duarte de Menezes(3)
, Gustavo Souza Valladares(4)
and Lúcia Helena Cunha dos Anjos(1)
(1)
Universidade Federal Rural do Rio de Janeiro, Departamento de Solos, Seropédica, Rio de Janeiro, Brasil. (2)
Universidade Federal Rural do Rio de Janeiro, Departamento de Matemática, Seropédica, Rio de Janeiro, Brasil. (3)
Universidade Federal de Lavras, Departamento de Ciência do Solo, Lavras, Minas Gerais, Brasil. (4) Universidade Federal do Piauí, Departamento de Geografia e História,
Campus Ministro Petrônio Portella, Teresina, Piauí, Brasil.
ABSTRACT: Bulk density (Bd) can easily be predicted from other data using pedotransfer functions (PTF). The present study developed two PTFs (PTF1 and PTF2) for Bd prediction in Brazilian organic soils and horizons and compared their performance with nine previously published equations. Samples of 280 organic soil horizons used to develop PTFs and containing at least 80 g kg-1
total carbon content (TOC) were obtained from different regions of Brazil. The multiple linear stepwise regression technique was applied to validate all the equations using an independent data set. Data were transformed using Box-Cox to meet the assumptions of the regression models. For validation of PTF1 and PTF2, the coefficient of determination (R2) was 0.47 and 0.37, mean error -0.04 and 0.10, and root mean square error 0.22 and 0.26, respectively. The best performance was obtained for the PTF1, PTF2, Hollis, and Honeysett equations. The PTF1 equation is recommended when clay content data are available, but considering that they are scarce for organic soils, the PTF2, Hollis, and Honeysett equations are the most suitable because they use TOC as a predictor variable. Considering the particular characteristics of organic soils and the environmental context in which they are formed, the equations developed showed good accuracy in predicting Bd compared with already existing equations.
Keywords: pedotransfer functions, multiple linear regression, box-cox transformation, soil database.
INTRODUCTION
Pedotransfer functions (PTF) have been developed in order to convert available data into required data (Bouma, 1989). Those analyses or parameters routinely determined that consume less time and resources are considered as available soil data. The available data should be more easily obtained than predict attribute (required data), because on the contrary, it would be more convenient to make a direct measurement than to predict the response variable (McBratney et al., 2002).
Measurement of bulk density (Bd), for example, takes time and is difficult to achieve in some soils (Sequeira et al., 2014; Nasri et al., 2015). In addition, since Bd is not a soil classification parameter itself, it is not often found in soil survey reports in Brazil, leading to a scarcity of such information for the 0.00-1.00 m soil layer (Heuscher et al., 2005; Benites et al., 2007). In such cases, PTFs are alternatives for filling gaps in soil databases (Odgers et al., 2012) since they can generate or estimate Bd data indirectly (Xiangsheng et al., 2016).
Bulk density is an important soil physical parameter, due to its relation with several soil properties and processes, such as hydraulic properties, soil compaction, and erosion (Wischmeier and Mannering, 1969; Aria and Paris, 1981; Hillel, 1998; Fidalski and Tormena, 2007; Silva et al., 2008; Rodríguez-Lado et al., 2015). Additionally, Bd is an important parameter in many calculations, e.g., the soil porosity equation (Blake and Hartge, 1986) and models (Nasri et al., 2015). Especially in the context of this study, Bd is important for converting soil weight into volume, which is necessary for determining the soil carbon (C) stock. Knowledge of C stocks over large areas, such as within a nation, is essential for monitoring changes from global warming that have raised concerns over the depletion of soil C (Eswaran et al., 1993).
In tropical conditions, only a few studies have focused on organic soils (total organic carbon content - TOC >80 g kg-1 (Ebeling et al., 2011), according to the Brazilian Soil Classification System - SiBCS (Santos et al., 2013). These ecosystems are considered fragile and very susceptible to degradation (Chimner and Ewel, 2005). In order to overcome the lack of information on organic soil, Valladares (2003) compiled a Brazilian soil database from graduate study theses and dissertations, which was the basis of this study. Database compilation is a first step for PTF development, and this has been one of the main limitations in Brazil. Although information management techniques have become more accessible due to advances in informatics, most of the information recorded for Brazilian soils is still dispersed (Benedetti et al., 2008).
If an organic soil database is available, the development of the PTF for estimating Bd for organic soils is possible, and it is also possible to test the PTFs published in the literature, such as in Adams (1973), Honeysett and Ratkowsky (1989), Manrique and Jones (1991) and Tamminen and Starr (1994) models. In Brazil, the first attempts to develop PTFs for estimating Bd associated with C stocks in the 0.00-1.00 m layer were conducted by Bernoux et al. (1998) and Tomasella and Hodnett (1998) in the Amazon Basin. After that, Benites et al. (2007) used PTFs for Bd determination in the main Brazilian soils and found that, among the different modeling techniques, regression functions using only soil TOC, clay content, and sum of bases (SB) provided the best results, explaining 66 % of Bd variance. In all the PTFs already developed in Brazil, none of them were developed solely with organic soils.
The aim of the present study was to develop new PTFs to predict Bd in the organic horizons of Brazilian soils and evaluate the accuracy of the PTFs already published in the literature.
MATERIALS AND METHODS
Database acquisition
compiled by Valladares (2003). The survey included dissertations, theses, and studies from educational and research institutes developed from 2003 to 2014.
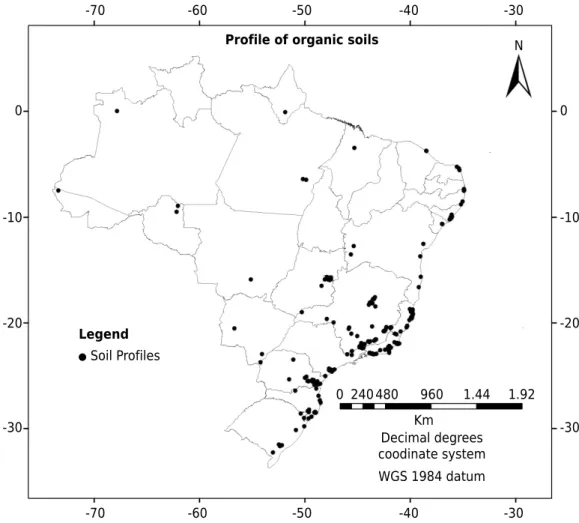
A total of 210 soil profiles, encompassing 648 horizons with organic characteristics (total organic C greater than or equal to 80 g kg-1 of soil) were found. The profiles surveyed consisted mostly of Histosols, Gleysols (Gleissolo Melânico and Gleissolo Tiomórfico), Cambisols (Cambissolo Hístico and Cambissolo Húmico), Leptosols (Neossolo Litólico), and Podzols (Espodossolo). There was not uniformity or harmonization among the soil analyses presented. Thus, Bd values were available for only 280 horizons, and they were used to develop and test PTFs. The way the full database was used for developing and validating the PTFs is shown in figure 2.
Development of soil bulk density PTFs
From 230 organic soil horizons, two PTFs were generated from stepwise linear regression analysis, here referred to as PTF1 and PTF2. Sand, clay, silt, TOC, SB, CEC, Al3+, H+, V, P, and pH(H2O) were used as explanatory variables for modeling Bd (dependent variable). Statistical analyses were performed using R software (R Core Team, 2013). To meet the assumptions of regression analysis, data were transformed using the Box-Cox transformation of the MASSpackage (Venables and Ripley, 2002) for R software. The residual normality of the equations developed was checked using the Shapiro-Wilk test. Means were analyzed by the t-test and homogeneity by the Breuch-Pagan test, using the
lmtest package (Zeileis and Hothorn, 2002). The equations also met the assumptions
of the overall regression test of the gvlma package (Peña and Slate, 2014). In addition, descriptive analysis of equation residues was performed.
N
Km Legend
Decimal degrees coodinate system WGS 1984 datum Soil Profiles
Profile of organic soils
0 240 480 960 1.44 1.92 0
-10
-20
-30
0
-10
-20
-30
-70 -60 -50 -40 -30
-70 -60 -50 -40 -30
PTFs published in the literature evaluated
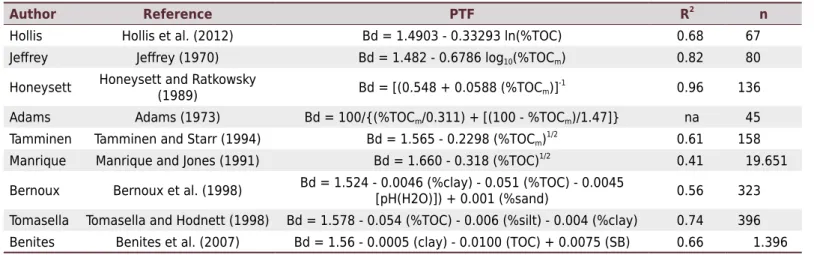
Nine PTFs of Bd already published in the literature were evaluated from the database presented in this study. The PTFs analyzed were obtained from Hollis et al. (2012) for Europe, Jeffrey (1970) for northern England, Honeysett and Ratkowsky (1989) for Tasmanian forest soil (Australia), Adams (1973) for a Welsh forest, Tamminen and Starr (1994) for Finish forest soil, Manrique and Jones (1991) for the USA, Bernoux et al. (1998) and Tomasella and Hodnett (1998) for the Brazilian Amazon, and Benites et al. (2007) for different areas of Brazil. The equations, their coefficient of determination (R2), and number of samples (n
) used to fit the equations are shown in table 1. Except for Bernoux et al. (1998), Tomasella and Hodnett (1998), and Benites et al. (2007), the equations were developed using TOC as the only independent variable for Bd prediction.
Accuracy assessment of PTFs
The accuracy of the equations was evaluated from information from 50 soil horizons, which constituted an independent data set (not used for modeling). Scatterplot graphics of observed and predicted values a, mean error (ME), and root mean square of error (RMSE) were used for assessing the accuracy of the PTFs. Calculation of ME and RMSE was performed through the following equations:
ME = 1 n
Σ
n
i=1 (yˆi - yi)
RMSE = 1 n
Σ
n
i=1 (yi - yi)
2 ˆ
in which ŷi are the predicted values, yi are the observed values, and n are the number of samples observed. RMSE measures the overall error (accuracy) of the predicted equation. Mean error (ME) evaluates the positive or negative inclination of the regression, indicating
648 organic horizons from 210 soil profiles
Selection of 280 horizons
Isolation of 50 Use of 230 samples for
PTF development
Use of 75 samples for PTF1 development based
on clay and TOC
Use of 230 samples for PTF2 development independent samples
with data on Bd available
Validation of PTF1, PTF2, and already existing equations
the tendency of over- or underestimating mean error, respectively (De Vos et al., 2005). The closer ME is to zero, the better the fit of the equation.
To obtain validation data, horizons with data available on sand, silt, clay, TOC, water-saturated soil paste, and V were selected. These variables were needed to validate the Bernoux et al. (1998), Tomasella and Hodnett (1998), and Benites et al. (2007) equations (Table 1).
Descriptive statistics
The number of samples (n) shown is different for each attribute because the horizons
evaluated do not contain data on all the variables (Table 2). For instance, sand and clay data may be available for a particular horizon but not for base saturation (V), whereas another site may have information on V but not clay content.
Table 1. Pedotransfer functions published by others authors and tested in this study
Author Reference PTF R2
n Hollis Hollis et al. (2012) Bd = 1.4903 - 0.33293 ln(%TOC) 0.68 67
Jeffrey Jeffrey (1970) Bd = 1.482 - 0.6786 log10(%TOCm) 0.82 80
Honeysett Honeysett and Ratkowsky
(1989) Bd = [(0.548 + 0.0588 (%TOCm)] -1
0.96 136
Adams Adams (1973) Bd = 100/{(%TOCm/0.311) + [(100 - %TOCm)/1.47]} na 45 Tamminen Tamminen and Starr (1994) Bd = 1.565 - 0.2298 (%TOCm)
1/2
0.61 158 Manrique Manrique and Jones (1991) Bd = 1.660 - 0.318 (%TOC)1/2 0.41 19.651
Bernoux Bernoux et al. (1998) Bd = 1.524 - 0.0046 (%clay) - 0.051 (%TOC) - 0.0045
[pH(H2O)]) + 0.001 (%sand) 0.56 323 Tomasella Tomasella and Hodnett (1998) Bd = 1.578 - 0.054 (%TOC) - 0.006 (%silt) - 0.004 (%clay) 0.74 396 Benites Benites et al. (2007) Bd = 1.56 - 0.0005 (clay) - 0.0100 (TOC) + 0.0075 (SB) 0.66 1.396 n: number of training samples; PTF: pedotransfer function; na: not-available; Bd: bulk density (Mg m-3
); R2: coefficient of determination; TOC: total organic carbon; TOCm: total organic carbon determined in muffle furnace; SB: sum of bases; Ln: Neperian logarithm. In Benites et al. (2007), clay and TOC are represented in g kg-1
, and SB in cmolc kg -1
.
Table 2. Descriptive statistics of the variables tested
Statistic Sand Clay Silt TOC Bd SB CEC Al3+ H+ V P pH(H
2O)
g kg-1
Mg m-3
cmolc kg -1
% mg kg-1
n 119 125 119 280 280 254 248 274 247 248 201 272
Minimum 0 0 9 82.4 0.05 0.18 6.8 0.0 0.7 0.3 0 2
Maximum 970 903 960 638.6 1.42 88.8 179 81.5 142.94 99 88 7.5
1st quartile 54 125 171 138.1 0.17 1.65 35.17 1.2 18.57 6 2 3.9
Median 158 310 270 229.9 0.41 7.25 44.8 3.45 30.2 16 5 4.4
3rd quartile 570 590 385 408.9 0.68 16.6 62.12 6.46 40.83 31 14.2 4.8
Mean 297.63 350.82 315.98 259.31 0.46 12.43 52.60 6.02 32.17 22.73 12.06 4.36
SD 302.67 259.77 213.93 137.69 0.30 16.25 28.52 9.31 21.09 22.65 16.68 0.77
CV (%) 102 74 68 53 65 131 54 155 66 100 138 18
Asymmetry 0.79 0.17 1.14 0.54 0.67 2.32 1.66 4.07 1.92 1.40 2.18 0.16
Kurtosis -0.87 -1.44 0.93 -1.00 -0.04 5.82 3.86 22.08 6.61 1.49 4.84 1.67
Shapiro-Wilk normality test
W 0.84 0.91 0.90 0.91 0.93 0.71 0.87 0.57 0.86 0.84 0.70 0.98
p-value <0.001 <0.001 <0.001 <0.001 <0.001 <0.001 <0.001 <0.001 <0.001 <0.001 <0.001 <0.001
n: number of samples; SD: standard deviation; CV: coefficient of variation; Sand, clay and silt: pipette method; TOC: total organic carbon (Walkley-Black
method); Bd: bulk density; SB: sum of bases (Ca, Mg, K, and Na); CEC: cation exchange capacity; Al3+
: exchangeable aluminum; H+
The coefficient of variation (CV) of the attributes is high (>50 %), except for pH (Table 2). Asymmetry and kurtosis values are related to data distribution, with data considered symmetric when asymmetry is zero. Data showed positive symmetry (>0), indicating left-skewed distribution (left of the median value).
Kurtosis for sand, clay, TOC, and Bd shows a flatter pattern (platykurtic distribution). The values for silt, sum of bases (SB), cation exchange capacity (CEC), Al3+, H+, base saturation (V), P, and pH are more concentrated around the mean and median (leptokurtic distribution) (Table 2). This behavior is not suitable for linear regression because it tends to show a low association with other variables, as was observed in the Bd of the present study. None of the variables showed normal distribution according to the Shapiro-Wilk test (p<0.05; Table 2).
Considering equation validation based on independent data, Bd was the only variable with a CV lower than 50 % (only 18.5 %) (Table 3). The other variables show high dispersion values. Clay showed the best data asymmetry (close to zero), and sand, silt, TOC, Bd, and SB were left skewed. Only pH distribution tended to be right skewed.
Sand and SB data were more concentrated (kurtosis >0.263). Clay, silt, TOC, and pH showed a flatter distribution (kurtosis <0.263), and Bd exhibited mesokurtic distribution. Only Bd and pH exhibited normal distribution (p>0.05, Table 3). In general, the group of independent data used for validation represents the shape of training data distribution.
RESULTS AND DISCUSSION
The development of the PTFs prioritized easily obtainable variables, an important principle in producing prediction equations. The attributes of table 2 were used as input data for regression, and the stepwise procedure selected the significant variables to integrate the equations. As such, only total organic carbon (TOC) and clay were significant for Bd prediction.
The TOC content is the most significant variable in Bd prediction models (Jalabert et al., 2010). However, Benites et al. (2007) reported that TOC is more important than clay for Bd prediction in the 0.00-0.10 m soil layer, but clay is the most important at 0.30-1.00 m.
Table 3. Descriptive statistics of the independent data set used for validation
Statistic Sand Clay Silt TOC Bd SB pH(H2O)
g kg-1
Mg dm-3
cmolc kg-1
Minimum 0 0 30 82.4 0.08 0.3 2.2
Maximum 920 903 960 512 1.38 56.06 5.3
1st quartile 22.2 182.5 214.7 125 0.36 1.78 3.8
Median 93 433 310 197.6 0.54 7.2 4.25
3rd quartile 282.5 650 492.5 296.8 0.72 14.72 4.67
Mean 186 406 378 229.2 0.56 10.33 4.16
SD 226.13 270.24 235.40 126.22 0.30 11.00 0.77
CV (%) 121.2 66.6 62.3 55.1 53.1 106.5 18.5
Asymmetry 1.49 -0.11 0.93 0.73 0.61 1.82 -0.45
Kurtosis 1.44 -1.41 -0.06 -0.68 0.20 4.23 -0.51
Shapiro-Wilk normality test
W 0.79 0.92 0.90 0.90 0.96 0.81 0.96
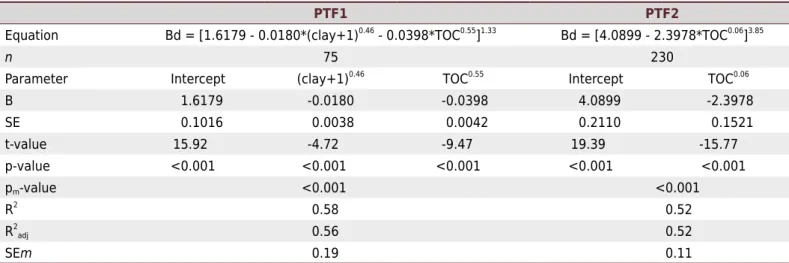
Two equations were developed in the present study, PTF1 and PTF2 (Table 4). PTF2 was developed based only on TOC, but PTF1 was based on TOC and clay, although clay content is not frequently assessed in organic soils. Equation exponents were determined by data transformation using the Box-Cox transformation. This procedure identifies the most adequate value to use as exponent, promoting normality of equation residues.
The parameters of both equations produced were significant (p<0.05), as were the equations (pm<0.05) (PTF1 and PTF2). R
2 was 0.58 and 0.52 and R2
adj was 0.56 and 0.52 for PTF1 and PTF2, respectively. SE was 0.19 Mg m-3 for PTF1 and 0.11 Mg m-3 for PTF2 (Table 4). Analysis of variance also shows that the variables were significant at 5 % for both equations (Table 5).
Residue analysis
Residue analysis of the two PTFs proposed is shown in table 6. Residue mean tendency toward zero is a favorable condition. The low standard deviation (SD) of PTF2 and the maximum and minimum values close to zero indicate equation accuracy. The PTF2 residues were close to zero, which is also a positive result. Asymmetry and kurtosis were adequate, indicating normal distribution. In general, the PTF2 residues are slightly better than those of the PTF1.
The Shapiro-Wilk test indicated data normality, with p=0.34 for PTF1 and p=0.21 for PTF2. Residue association for a normal distribution indicates that the mean of model errors tends towards zero, as confirmed by the Student t test (Table 7). These features are desirable for regression analysis.
Table 4. Pedotransfer functions developed to predict bulk density and the respective indexes of regression
PTF1 PTF2
Equation Bd = [1.6179 - 0.0180*(clay+1)0.46
- 0.0398*TOC0.55 ]1.33
Bd = [4.0899 - 2.3978*TOC0.06 ]3.85
n 75 230
Parameter Intercept (clay+1)0.46
TOC0.55
Intercept TOC0.06
B 1.6179 -0.0180 -0.0398 4.0899 -2.3978
SE 0.1016 0.0038 0.0042 0.2110 0.1521
t-value 15.92 -4.72 -9.47 19.39 -15.77
p-value <0.001 <0.001 <0.001 <0.001 <0.001
pm-value <0.001 <0.001
R2
0.58 0.52
R2adj 0.56 0.52
SEm 0.19 0.11
n: number of training samples; B: beta value; SE: standard error; pm-value: p-value for the model; R 2
adj: adjusted regression coefficient; SEm: standard error of the model; Bd: soil bulk density (Mg m-3
); Clay, in g kg-1
; TOC: total organic carbon (g kg-1 ).
Table 5. Analysis of variance for the regressions produced
Model Source of variation Degrees of freedom Sum of squares Mean square F value p-value
PTF1
Clay 1 0.306 0.306 8.191 0.005
Total organic carbon 1 3.352 3.352 89.770 <0.001
Residue 72 2.689 0.037
PTF2 Total organic carbon 1 2.776 2.776 248.59 <0.001
Residue 228 2.546 0.011
Table 6. Residuals of the regression analysis for the PTF1 and PTF2 models
Mean Standard deviation Minimum Maximum Asymmetry Kurtosis
PTF1 -6.38e-20
0.19 -0.38 0.38 -0.07 -0.86
The errors also meet the homoscedasticity assumption (homogeneous distribution of variances), as calculated by the Breusch-Pagan test (p=0.23 and 0.81 for PTF1 and PTF2, respectively). Homoscedasticity is important in validating regression functions.
Model evaluation: error parameters
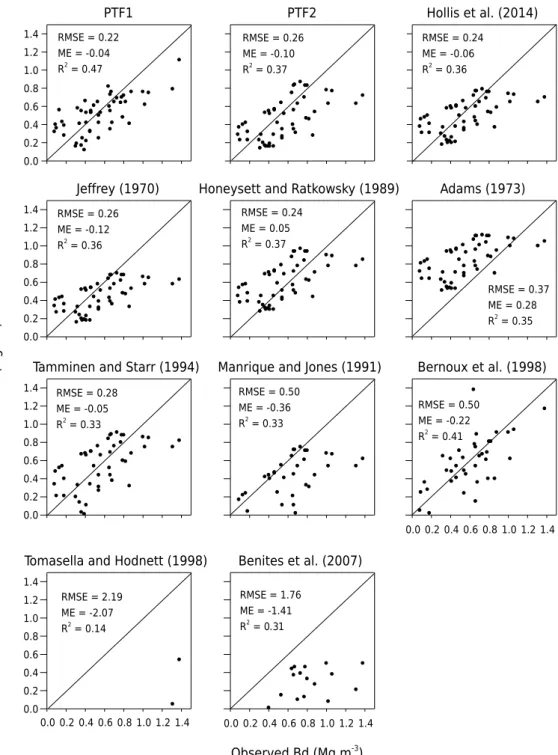
The performance of the PTFs was assessed by RMSE, ME, and the determination coefficient (R2), fitting them to the independent sample and comparing them to the PTFs developed in other studies. Figure 3 shows that all equations, except for those of Honeysett and Adams, underestimated Bd. The Tomasella and Benites equations exhibited the worst performance, with likelihood of higher ME and RMSE because they were developed for mineral soils. The Bernoux and Manrique equations were also limited, showing high RMSE values.
The equations with the best performance were PTF1, PTF2, Hollis, and Honeysett (Figure 3), with RMSE from 0.22 to 0.26 and ME from -0.12 to 0.05. In general, these were the best parameters for validating the equations based on independent data. Furthermore, these equations showed the highest correlations.
Validation of the Hollis equation explained 29 % of Bd variance, with error probability of ± 39 % (Hollis et al., 2012). In the present study, the Hollis equation explained 36 % of Bd variance, with error probability of ± 13 %. The authors observed that for all the equations developed, Bd prediction is relatively limited when applied to a data set with validation of independent data, even when they were obtained from a same area or soil type.
The PTF1, which showed the highest accuracy, adopts TOC and clay as predictor variables. As such, use of this equation is recommended to estimate Bd in organic soils. The high clay content in soils must be considered. Table 2 shows average clay content of 350 g kg-1, with a maximum value of 900 g kg-1, indicating the significant presence of the mineral fraction. However, clay content is not analyzed for many organic soils. In these cases, the alternative manner to determine Bd uses the PTF2, Hollis, and Honeysett equations, which contain only TOC as a predictor variable.
The PTF2, Hollis, and Jeffrey equations showed the best performance (which contain only TOC), with lower RMSE and ME (Figure 3). The Hollis equation applies the log values of TOC data to linearize the equations, that is, the Bd of organic soils showed a good logarithm relationship with TOC. To produce PTF2, the Box-Cox transformation was used to meet linear regression assumptions.
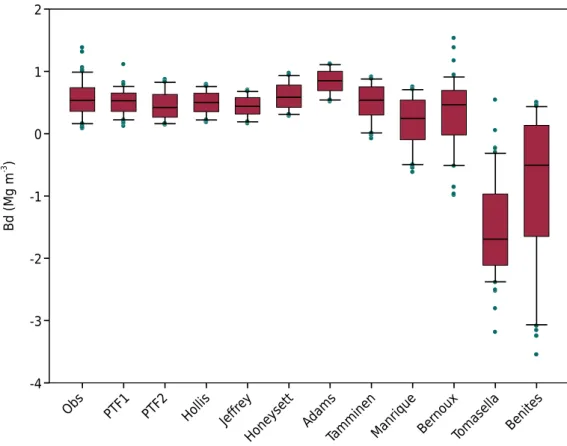
Distribution of the results predicted by the equations tested is shown in figure 4. The box-plots for the PTF1, PTF2, Hollis, Jeffrey, and Honeysett equations were closest to those of the observed data. In turn, the box-plots for the Benites, Tomasella, and Bernoux equations indicated that they provided the worst Bd prediction. The latter three equations used more than two variables for Bd prediction, including chemical properties. This suggests that chemical attributes are not good variables for predicting Bd in organic soils.
The methods used for chemical and physical analysis of organic soils have been called into question in other studies (Pereira et al., 2006; Gatto et al., 2009). Most procedures are calibrated to mineral soils, hindering interpretation of results.
Table 7. Student, Shapiro-Wilk, and Breusch-Pagan tests for means, normality, and homoscedasticity of model residues, respectively
Model Student t test (means) Shapiro-Wilk test (normality) Breusch-Pagan test (homocedasticity)
Mean t p (>0.05) W p (>0.05) BP p (>0.05)
PTF1 < -0.001 a 0 1 0.9817 0.349 2.902 0.234
PTF2 < -0.001 a 0 1 0.9916 0.211 0.052 0.818
The coefficients of determination obtained by the authors (Table 1) are higher than those obtained by the equations proposed in this study, with the exception of the Manrique equation. These equations were developed for a wider range of soil classes, and with the exception of the equations developed in Brazil, in environments with predominantly temperate climates. The only equation developed exclusively for soils with high organic matter content is the Hollis equation, however, for a temperate climate. The variability of soils with high organic matter content is wide because the database comprises organic soils of a predominantly tropical country, but with data from cold regions, such as southern Brazil and montane regions, especially of the states of Minas Gerais and Rio Janeiro. Removal of outliers was tested, but there was no significant improvement in R2. The technique that enabled improvement was the Box-Cox transformation. For the same reasons, the RMSE and ME were also affected, but in validation, they showed similar values to the equations tested (Figure 3).
Figure 3. Observed and predicted values of functions developed and obtained from other studies, considering the validation data set (50 samples). Bd: soil bulk density; RMSE: root mean square error; ME: mean error.
PTF1 0.0 0.2 0.4 0.6 0.8 1.0 1.2 1.4
PTF2 Hollis et al. (2014)
Jeffrey (1970) 0.0 0.2 0.4 0.6 0.8 1.0 1.2 1.4
Honeysett and Ratkowsky (1989) Adams (1973)
Tamminen and Starr (1994)
0.0 0.2 0.4 0.6 0.8 1.0 1.2 1.4
Manrique and Jones (1991) Bernoux et al. (1998)
0.0 0.2 0.4 0.6 0.8 1.0 1.2 1.4
Tomasella and Hodnett (1998)
0.0 0.2 0.4 0.6 0.8 1.0 1.2 1.4 0.0 0.2 0.4 0.6 0.8 1.0 1.2 1.4
Benites et al. (2007)
0.0 0.2 0.4 0.6 0.8 1.0 1.2 1.4
Observed Bd (Mg m-3)
RMSE = 0.22 ME = -0.04
R2
= 0.47
RMSE = 0.26 ME = -0.10
R2
= 0.37
RMSE = 0.24 ME = -0.06
R2
= 0.36
RMSE = 0.26 ME = -0.12
R2
= 0.36
RMSE = 0.24 ME = 0.05
R2
= 0.37
RMSE = 0.37 ME = 0.28
R2
= 0.35
RMSE = 0.28 ME = -0.05
R2 = 0.33
RMSE = 0.50 ME = -0.36
R2 = 0.33
RMSE = 0.50 ME = -0.22
R2 = 0.41
RMSE = 2.19 ME = -2.07
R2
= 0.14
RMSE = 1.76 ME = -1.41
R2
= 0.31
Pr
edicted Bd (Mg
m
The soil samples evaluated had high C content, characterizing them as one of the most restricted groups among the different soil types. Despite attempts to search for specifications in development of predictive equations for organic soils, limitations in generating and processing the data set were observed. Difficulties include differences in methods of soil analysis and differences in organic soil categories. Soils with high TOC levels encompass a wide range of soil classes, with different compositions. For instance, Histosols can exhibit sapric, hemic, or fibric characteristics. This limitation, however, was not found by Hollis et al. (2012), who combined histic and folic soils in a single group, given that they did not observe significant differences in mean Bd. The limitations reported do not compromise the findings of the present study, which proposes specific and accurate equations for Bd prediction in organic soils.
Therefore, the most significant limitations are the use of different methods of soil analysis and high data variability. Carbon content in soils that make up the database was determined by different methods, such as combustion in a muffle furnace, titration with dichromate (Walkley and Black, 1934; Yeomans and Bremner, 1988), and automatic elemental analyzers (CHN), which commonly increases variation in C content among the samples (Pereira et al., 2006; Gatto et al., 2009). These variations may have affected the validation parameters of the equations produced.
One of the qualities of regression models, called regression toward the mean, determines equation parameters based on mean training data values. Therefore, the values obtained by different methods tend to be similar to the mean obtained using different analysis methods. In that case, linear regression is the most appropriate method for reducing these effects in predictive equations, irrespective of the use of an equation developed by the present study or by other authors.
CONCLUSIONS
The use of PTF1, produced using stepwise linear regression, is recommended for predicting Bd in organic soils with data available on clay content, given that it uses not only TOC,
Obs PTF1 PTF2 Hollis Jeffre
y
Honeysett Adam s
Tammin en
Manrique Ber nou
x
Tomasella Benite s
Bd (Mg m
-3 )
-4 -3 -2 -1 0 1 2
but also clay as a predictor variable. The statistical indexes calculated indicate that this equation achieved the highest accuracy among the PTFs studied.
The analysis of clay content is scarce for organic soils, and in the absence of these data, the use of the PTF2, Hollis, and Honeysett equations is recommended because they provided the highest accuracy in Bd determination based on TOC as the only predictor variable.
The better performance of the equations produced and applied to data collected in Brazil highlights the importance of the environmental context, especially soil and climate conditions, in the development and accuracy of pedotransfer functions.
ACKNOWLEDGMENTS
Thanks to the CAPES, CNPq, and FAPERJ for financial support.
REFERENCES
Adams WA. The effect of organic matter on the bulk and true densities of some uncultivated podzolic soils. J Soil Sci. 1973;24:10-7. https://doi.org/10.1111/j.1365-2389.1973.tb00737.x
Aria LM, Paris JF. A physicoempirical model to predict the soil moisture characteristic from particle size distribution and bulk density data. Soil Sci Soc Am J. 1981;45:1023-30. https://doi.org/10.2136/sssaj1981.03615995004500060004x
Benedetti MM, Sparovek G, Cooper M, Curi N, Carvalho Filho A. Representatividade e potencial de utilização de um banco de dados de solos do Brasil. Rev Bras Cienc Solo. 2008;32:2591-600. https://doi.org/10.1590/S0100-06832008000600036
Benites VM, Machado PLOA, Fidalgo ECC, Coelho MR, Madari BE. Pedotransfer functions for estimating soil bulk density from existing soil survey reports in Brazil. Geoderma. 2007;139:90-7. https://doi.org/10.1016/j.geoderma.2007.01.005
Bernoux M, Arrouays D, Cerri C, Volkoff B, Jolivet C. Bulk densities of Brazilian Amazon soils related to other soil properties. Soil Sci Soc Am J. 1998;62:743-9. https://doi.org/10.2136/sssaj1998.03615995006200030029x
Blake GR, Hartge KH. Bulk Density. In: Klute A, editor. Methods of soil analysis: Physical and Mineralogical Methods. Madison: American Society of Agronomy; 1986. Pt 1. p.363-75. https://doi.org/10.2136/sssabookser5.1.2ed.c13
Bouma J. Using soil survey data for quantitative land evaluation. Adv Soil Sci. 1989;9:177-213.
Chimner RA, Ewel KC. A tropical freshwater wetland: II. Production, decomposition, and peat formation. Wetlands Ecol Manage. 2005;13:671-84. https://doi.org/10.1007/s11273-005-0965-9
De Vos B, van Meirvenne M, Quataert P, Deckers J, Muys B. Predictive quality of pedotransfer functions for estimating bulk density of forest soils. Soil Sci Soc Am J. 2005;69:500-10. https://doi.org/10.2136/sssaj2005.0500
Ebeling AG, Anjos LHC, Perez DV, Pereira MG, Gomes FWF. Atributos químicos, carbono orgânico e substâncias húmicas em Organossolos Háplicos de várias regiões do Brasil. Rev Bras Cienc Solo. 2011;35:325-36. https://doi.org/10.1590/S0100-06832011000200004
Eswaran H, van den Berg E, Reich P. Organic carbon in soils of the world. Soil Sci Soc Am J. 1993;57:192-4. https://doi.org/10.2136/sssaj1993.03615995005700010034x
Fidalski J, Tormena CA. Funções de pedotransferência para as curvas de retenção de água e de resistência do solo à penetração em sistemas de manejo com plantas de cobertura permanente em citros. Cienc Rural. 2007;37:1316-22. https://doi.org/10.1590/S0103-84782007000500015
Heuscher SA, Brandt CC, Jardine PM. Using soil physical and chemical properties to estimate bulk density. Soil Sci Soc Am J. 2005;69:51-6. https://doi.org/10.2136/sssaj2005.0051
Hillel D. Environmental soil physics. San Diego: Academic Press; 1998.
Hollis JM, Hannam J, Bellamy PH. Empirically-derived pedotransfer functions for predicting bulk density in European soils. Eur J Soil Sci. 2012;63:96-109. https://doi.org/10.1111/j.1365-2389.2011.01412.x
Honeysett JL, Ratkowsky DA. The use of ignition loss to estimate bulk density of forest soils. J Soil Sci. 1989;40:299-308. https://doi.org/10.1111/j.1365-2389.1989.tb01275.x
Jalabert SSM, Martin MP, Renaud JP, Boulonne L, Jolivet C, Montanarella L, Arrouays D. Estimating forest soil bulk density using boosted regression modeling. Soil Use Manage. 2010;26:516-28. https://doi.org/10.1111/j.1475-2743.2010.00305.x
Jeffrey DW. A note on the use of ignition loss as a means for the approximate estimation of soil bulk density. J Ecol. 1970;58:297-9. https://doi.org/10.2307/2258183
Manrique LA, Jones CA. Bulk density of soils in relation to soil physical and chemical properties. Soil Sci Soc Am J. 1991;55:476-81. https://doi.org/10.2136/sssaj1991.03615995005500020030x
Mcbratney AB, Minasny B, Cattle SR, Vervoort RW. From pedotransfer functions to soil inference systems. Geoderma. 2002;109:41-73. https://doi.org/10.1016/S0016-7061(02)00139-8
Nasri B, Fouché O, Torri D. Coupling published pedotransfer functions for the estimation of bulk density and saturated hydraulic conductivity in stony soils. Catena. 2015;131:99-108. https://doi.org/10.1016/j.catena.2015.03.018
Odgers NP, Libohova Z, Thompson JA. Equal-area spline functions applied to a legacy soil database to create weighted-means maps of soil organic carbon at a continental scale. Geoderma. 2012;189-190:153-63. https://doi.org/10.1016/j.geoderma.2012.05.026
Peña EA, Slate EH. Global Validation of Linear Models Assumptions. (Gvlma) R package version 1.0.0.2. Available at: http://CRAN.R-project.org/package=gvlma. 2014.
Pereira MG, Valladares GS, Anjos LHC, Benites VM, Espíndula Jr A, Ebeling AG. Organic carbon determination in Histosols and soil horizons with high organic matter content from Brazil. Sci Agric. 2006;63:187-93. https://doi.org/10.1590/S0103-90162006000200012
R Core Team R: A language and environment for statistical computing. R Foundation for Statistical Computing. Vienna, Austria: 2013. Available at: https://www.r-project.org/.
Rodríguez-Lado L, Rial M, Taboada T, Cortizas AM. A pedotransfer function to map soil bulk density from limited data. Procedia Environmental Sciences. 2015;27:45-8. https://doi.org/10.1016/j.proenv.2015.07.112
Santos HG, Jacomine PKT, Anjos LHC, Oliveira VA, Oliveira JB, Coelho MR, Lumbreras JF, Cunha TJF. Sistema brasileiro de classificação de solos. 3a ed. Rio de Janeiro: Embrapa Solos; 2013. Sequeira CH, Wills SA, Seybold CA, West LT. Predicting soil bulk density for incomplete databases. Geoderma. 2014;213:64-73. https://doi.org/10.1016/j.geoderma.2013.07.013 Silva AP, Tormena, CA, Fidalski J, Imhoff S. Funções de pedotransferência para as curvas de retenção de água e de resistência do solo à penetração. Rev Bras Cienc Solo. 2008;32:1-10. https://doi.org/10.1590/S0100-06832008000100001
Tamminen P, Starr M. Bulk density of forested mineral soils. Silva Fenn. 1994;28:53-60.
Tomasella J, Hodnett MG. Estimating soil water retention characteristics from limited data in Brazilian Amazonia. Soil Sci.1998;163:190-202.
Valladares GS. Caracterização de Organossolos, auxílio à sua classificação [tese]. Seropédica: Universidade Federal Rural do Rio de Janeiro; 2003.
Venables WN, Ripley BD. Modern applied statistics with S. 4th ed. New York: Springer; 2002.
Walkley A, Black IA. An examination of the Degtjareff method for determining soil organic matter, and a proposed modification of the chromic acid titration method. Soil Sci. 1934;37:29-38. Wischmeier WH, Mannering JV. Relation of soil properties to its erodibility. Soil Sci Soc Am Proc. 1969;39:131-7. https://doi.org/10.2136/sssaj1969.03615995003300010035x
Yeomans JC, Bremner JM. A rapid and precise method for routine determination of organic carbon in soil. Commun Soil Sci Plant Anal. 1988;19:1467-76. https://doi.org/10.1080/00103628809368027