Accumulation and oxidation of elemental mercury in tropical soils
Liliane Catone Soares
a, Fernando Barboza Egreja Filho
a,⇑, Lucília Alves Linhares
b,
Cláudia Carvalhinho Windmoller
a, Maria Irene Yoshida
aaDepartamento de Química, Instituto de Ciências Exatas, Universidade Federal de Minas Gerais, 31270-901 Belo Horizonte, MG, Brazil
bDepartamento de Ciências Exatas e Aplicadas, Instituto de Ciências Exatas e Aplicadas, Universidade Federal de Ouro Preto, 35931-008 João Monlevade, MG, Brazil
h i g h l i g h t s
Retention and oxidation of Hg0in tropical soils depends on soil properties. Those processes vary greatly both quantitatively and qualitatively with soil type. Organic matter is the main soil characteristic in Hg adsorption and oxidation. pH and CEC also appear to be important soil characteristics in Hg adsorption. Hg0oxidation occurred at the air/soil interface rather than only in the air.
a r t i c l e
i n f o
Article history: Received 7 July 2014
Received in revised form 27 March 2015 Accepted 9 April 2015
Available online 15 May 2015
Handling Editor: X. Cao
Keywords:
Atmospheric mercury Chemical transformations Adsorption
Thermal desorption Soil chemistry
a b s t r a c t
The role of chemical and mineralogical soil properties in the retention and oxidation of atmospheric mercury in tropical soils is discussed based on thermal desorption analysis. The retention of gaseous mercury by tropical soils varied greatly both quantitatively and qualitatively with soil type. The average natural mercury content of soils was 0.08 ± 0.06lg g 1with a maximum of 0.215 ± 0.009lg g 1. After gaseous Hg0incubation experiments, mercury content of investigated soils ranged from 0.6 ± 0.2 to
735 ± 23lg g 1, with a mean value of 44 ± 146lg g 1. Comparatively, A horizon of almost all soil types adsorbed more mercury than B horizon from the same soil, which demonstrates the key role of organic matter in mercury adsorption. In addition to organic matter, pH and CEC also appear to be important soil characteristics for the adsorption of mercury. All thermograms showed Hg2+peaks, which were
predom-inant in most of them, indicating that elemental mercury oxidized in tropical soils. After four months of incubation, the thermograms showed oxidation levels from 70% to 100%. As none of the samples pre-sented only the Hg0peak, and the soils retained varying amounts of mercury despite exposure under
the same incubation conditions, it became clear that oxidation occurred on soil surface. Organic matter seemed to play a key role in mercury oxidation through complexation/stabilization of the oxidized forms. The lower percentages of available mercury (extracted with KNO3) in A horizons when compared to B
horizons support this idea.
Ó2015 Elsevier Ltd. All rights reserved.
1. Introduction
Mercury and mercury-containing compounds are toxic to humans and the environment (Bernhoft, 2012). One significant aspect of the global biogeochemical cycling of mercury, which dif-fers from those of other metals, is its volatility (Fergusson, 1990). Most mercury in the air is gaseous elemental mercury, which is deposited onto the ground and water in various ways and may be transformed into methylmercury through microbial action
(UNEP, 2008). Since gaseous elemental mercury has a long atmo-spheric lifetime (6–18 months) and can be transported around the globe, it is characterized as a global pollutant (UNEP, 2008). The behavior of the mercury remaining in soil is initially governed by physical and chemical processes that redistribute it within the soil and allow some of it to enter the soil solution (Renneberg and Dudas, 2001).
Abiotic oxidation of elemental mercury to Hg2+occurs in the
atmosphere, in water and in soil, but because so far research has focused on atmospheric transformations, little is known about the oxidation mechanisms of elemental mercury in water and soil (Barkay et al., 2003).
http://dx.doi.org/10.1016/j.chemosphere.2015.04.020
0045-6535/Ó2015 Elsevier Ltd. All rights reserved. ⇑ Corresponding author.
E-mail address:[email protected](F.B. Egreja Filho).
Chemosphere 134 (2015) 181–191
Contents lists available atScienceDirect
Chemosphere
Several studies have demonstrated that atmospheric deposition from nearby industries is the most likely source of mercury in soil (Wang et al., 2003; Hissler and Probst, 2006; Guédron et al., 2013; González-Fernández et al., 2014) and water (Hissler and Probst, 2006; González-Fernández et al., 2014). A comparison of vertical mercury profiles in soil from Grenoble, France, to those of other metals not emitted by the same plant suggested mercury enrich-ment in surface horizons due to atmospheric mercury input from the chlor-alkali plant (Guédron et al., 2013). A study conducted in Gijón, Spain (González-Fernández et al., 2014) showed that the recharge area of the springs exhibited mercury concentrations higher than the base level established for sandstone in the region and that the concentration of easily mobilized mercury was higher in the superficial soil horizon, suggesting mercury enrichment via atmospheric deposition. According to the authors, the source of mercury for atmospheric deposition on soil surface and its accu-mulation in soil was nearby industrial activity. The mining and roasting of Mercury-ore-containing rocks are also important sources of mercury release to the environment because of atmo-spheric mercury emissions (Li et al., 2009) and mercury leaching from contaminated soils to surface water and deeper into the soil (Tersic et al., 2014). Field investigation experiments showed a pos-itive correlation between atmospheric mercury concentration and mercury content in a Cambisol (Wang et al., 2003). The same authors demonstrated in simulated experiments that a higher Hg0content in the air resulted in a higher mercury retention in a
specific soil sample; however, they did not evaluate different soil classes.
In Brazil, gold mining is the major source of mercury in the atmosphere (UNEP, 2008). During the gold mining boom in the late 1980’s, gold mining contributed about 110 t yr 1mercury to the
environment, with nearly 65% to the atmosphere. The most recent mercury release estimates show that gold mining has been greatly reduced due to the exhaustion of easy mining deposits, but that it still contributes about 31 t yr 1 of mercury, about 20 t yr 1 is
released into the atmosphere (Lacerda et al., 1999).
According to the annual report by the Brazilian National Department of Mineral Production (DNPM), Brazil has gold reserves of 2592 tons, 582 tons (22% of total) of which are in Minas Gerais (DNPM, 2010). The scarce data available on atmo-spheric deposition due to mining are estimated for the Amazon region, where this activity is concentrated (Lacerda et al., 1999). Recent studies have also shown the importance of burning pro-cesses in the remobilization of mercury in the Amazonian ecosys-tem (Perez et al., 2014).
Most studies have been conducted on Northern hemisphere soils in addition to a few studies focused mostly on the Amazon region in the Southern hemisphere. Thermal desorption has been used to determine the total content of mercury in cinnabar since 1904. In this technique, solid samples are heated to high tempera-ture and the vaporized mercury is swept by a gas flow to an atomic absorption spectrometer cell for quantification (Henry et al., 1972). Subsequently, Goleb also used this technique to differentiate cury from natural and anthropogenic sources. They obtained mer-cury release profiles as a function of temperature for different rocks (Goleb, 1971).
Many other studies have shown the potential of this technique for the speciation and/or determination of different mercury inter-actions in contaminated area soils (Windmöller et al., 1996; Biester and Scholz, 1997; Biester et al., 2000; Biester et al., 2002; Valle et al., 2005).
Recently, in a study of fifteen commercial mercury compounds, researchers analyzed their use as fingerprints and showed that the identification of mercury species by thermal desorption is possible (Rumayor et al., 2013). Thermal desorption has also been used
even in the development of an innovative technology for the reme-diation of contaminated soils (Navarro et al., 2009).
Therefore, in order to evaluate mercury retention and oxidation in tropical soils, we analyzed several types of tropical soils exposed to an atmosphere saturated with gaseous mercury using thermal desorption coupled to atomic absorption spectrometry (TDAAS), a technique that allows the qualitative speciation of mercury (Valle et al., 2005).
Studies have demonstrated that soil characteristics affect the mercury exchange flux between the soil and the atmosphere (Hissler and Probst, 2006; Liu et al., 2014).
In this work, the role of chemical and mineralogical soil proper-ties in the retention and oxidation of atmospheric mercury in trop-ical soils is discussed based on laboratory experiments and thermal desorption analysis.
Therefore, this study goes beyond the simulation of soil con-tamination by gaseous mercury to distinguish possible processes of gaseous mercury retention and oxidation in tropical soils and in two of their horizons (A and B) as well.
2. Material and methods
2.1. Sampling area and geological setting
One of the study areas is located in Southeast Brazil and covers most of Minas Gerais state and the other, Itaperuna town, is in Rio de Janeiro state. The soil sampling points, sample horizon and identification, geographical location, soil classification and chemi-cal and textural characteristics are given inTable 1.
Minas Gerais is a large state, with an area of 586,522.122 km2,
comparable to the size of Ukraine. It has a great geological variabil-ity, with two outstanding regions: Triângulo Mineiro, a region of volcanism, with mafic rocks, and the Quadrilátero Ferrífero, with geochemical anomalies and mineral deposits (Mello and Abrahão, 2013). Most samples were collected in and around the Quadrilátero Ferrífero. Quadrilátero Ferrífero is the greatest Brazilian iron mining region. It also presents deposits of man-ganese, gold, bauxite and gems like topaz and emerald (Roeser and Roeser, 2010). Two of the most important hydrographic basins are located in Minas Gerais state, the Doce River basin and the Velhas River basin.
2.2. Soil sampling
Samples of typical tropical soils (ultisol, oxisols, inceptisols, alfi-sols and entisol) were collected at three points at two depths (hori-zons A and B) from areas not affected either by agricultural or industrial activities. The samples were disaggregated, sieved with a 2-mm sieve and air dried (air-dried fine earth). These samples were submitted to textural analysis. For chemical analysis, the sam-ples were also ground and sieved with a mesh 80 (0.177 mm) sieve.
2.3. Characterization
The following soil parameters were determined: pH, cation exchange capacity (CEC) and carbon, clay, silt, sand and iron and aluminum oxide contents were determined. pH, CEC and granu-lometry values were determined following EMBRAPA (1997). Crystalline iron oxides were extracted using a dithionite-citrate-bi-carbonate (DCB) and amorphous iron oxides were extracted using ammonium oxalate, following Mehra and Jackson (1960) and
Table 1
Identification, classification, geographical location, chemical and physical (textural analysis) characteristics of soilsa.
Soil Soil classificationb Coordinates Horizon pH CEC (cmol
ckg 1) Clay (g kg1) Silt (g kg 1) Sand (g kg 1) Texture %C Fe2O3(g kg 1) Al2O3(g kg1)
H2O KCl DCB oxalate DCB oxalate
PVA Typic Hapludult S 20°4501400 A 5.10(5) 4.39(4) 4.5(2) 436.3 211.7 342.0 Clayey 1.62(5) 116.1(2) 3.01(7) 3.24(1) 2.75(1)
W 42°5205500
LVd Rhodic Hapludox S 20°3903700 A 4.98(3) 4.20(3) 3.1(3) 454.5 127.2 418.3 Clayey 3.02(7) 182.9(5) 2.51(2) 17.2(2) 10.4(2)
W 43°4701000 B 5.10(6) 5.42(1) 2.4(3) 633.3 239.4 127.3 Clayey 1.83(8) 155.8(4) 2.54(2) 31.5(4) 3.83(1)
LVAd1 Humic Xanthic Hapludox S 21°1303300 A 5.24(2) 4.55(3) 2.2(7) 551.8 208.7 239.5 Clayey 2.4(2) 31.6(3) 2.7(3) 6.93(1) 7.68(8)
W 43°4602500 B 6.22(1) 5.48(2) 4.2(1) 484.5 174.6 340.9 Clayey 0.4(1) 33.04(1) 0.71(5) <LQ 1.62(1)
LVj Humic Rhodic Acrudox S 19°5900800 A 5.31(4) 4.83(3) 4.8(2) 216.0 414.2 369.8 Medium 3.5(4) 428.8(7) 7.8(9) 102.6(3) 7.8(2)
W 43°5004800 B 5.81(1) 5.67(2) 6.4(7) 250.3 431.5 318.2 Medium 2.49(7) 454.9(6) 8.2(6) 123.0(6) 3.27(4)
NVef Typic Rhodudalf S 21°0002800 A 6.17(1) 5.12(2) 8.0(2) 413.9 217.6 368.4 Clayey 1.5(3) 90.2(1) 2.65(2) 11.11(4) 2.76(7)
W 42°4300400 B 5.44(2) 4.41(4) 9.6(1) 542.4 404.7 53.0 Clayey 0.37(1) 181.1(6) 5.70(1) 19.94(8) 2.55(8)
TCp Typic Haplustalf S 19°3700500 A 6.13(1) 5.32(1) 6.3(4) 418.1 244.3 337.6 Clayey 3(3) 72.12(5) 1.10(1) 5.18(2) 1.34(2)
W 44°0203500 B 6.10(2) 5.65(3) 5.8(2) 619.5 199.2 181.3 Clayey 0.60(2) 79.8(2) 1.14(1) 7.06(5) 1.03(4)
CXbe Oxic Eutric Haplustept S 19°3700500 A 7.52(1) 6.85(3) 12.2(2) 524.4 380.6 95.0 Clayey 3.220(0) 68.6(3) 1.73(5) 13.43(3) 13.1(2)
W 44°0203500 B 6.91(1) 6.29(3) 5.5(2) 703.5 209.4 87.1 Clayey 0.93(4) 64.1(7) 1.08(1) 10.11(7) 2.49(2)
FFcd1 Petroferric Acrustox S 17°0405300 A 5.45(2) 4.32(2) 6.6(2) 114.2 318.2 567.7 Medium 2.5(7) 23.15(6) 1.48(2) 3.73(2) 0.96(5)
W 46°0001600 B 4.88(3) 3.85(6) 2.4(1) 221.7 315.3 463.1 Medium 0.74(6) 23.05(1) 0.47(3) <LQ 0.91(5)
FFcd2 Petroferric Acrustox S 17°0501600 A 5.61(3) 4.48(2) 3.36(2) 147.1 521.1 331.8 Medium 1.9(1) 18.1(2) 1.04(4) 3.65(3) 0.89(1)
W 45°5901200 B 4.30(4) 3.73(1) 2.3(3) 193.2 297.7 509.1 Medium 0.700(0) 24.6(5) 0.36(1) <LQ 0.73(1)
CXd Typic Dystrudept S 17°0405900 A 5.66(3) 4.47(5) 7.2(1) 193.4 315.8 490.1 Medium 4(1) 55.1(1) 2.09(5) 6.20(5) 1.66(1)
W 46°0000500 B 5.05(2) 3.91(2) 2.9(1) 285.6 225.2 410.8 Medium 0.66(1) 36.8(6) 1.10(5) <LQ 1.38(7)
RQo Quartzipsamment S 17°2504800 A 4.49(3) 3.68(4) 1.30(8) 110.1 36.9 853.0 Sandy 0.55(1) 2.73(2) 0.20(1) 0.92(2) 0.73(3)
W 46°0403600 B 4.71(1) 3.91(1) 1.1(5) 148.5 29.8 821.8 Sandy 0.5(2) 2.17(3) 0.18(1) 0.71(1) 0.48(3)
LVAd2 Xanthic Hapludox S 17°4705000 A 5.40(5) 3.97(3) 7.6(4) 338.1 107.5 554.4 Medium 2.8(6) 48.3(3) 1.5(2) 17.07(9) 6.50(5)
W 46°0800500 B 4.61(2) 4.10(2) 7.7(4) 472.7 78.5 454.6 Clayey 0.73(9) 62.3(5) 0.75(1) 18.05(7) 1.13(9)
aLQ = Limit of Quantification. Numbers in brackets represent the error in the last significant digit, estimated as the standard deviations from the mean of three replications. b According to Soil Taxonomy (approximately).
L.C.
Soares
et
al.
/Chemosphere
134
(2015)
181–191
model Analyst 200, by direct aspiration of aqueous samples using acetylene/air and acetylene/nitrous oxide flame, respectively.
2.4. Quantification of total natural mercury in soil
Air-dried fine earth samples were ground in an agate mortar and about 0.1000 g of each sample was submitted to mercury quantification in aMilestone Direct Milestone Analyzer(DMA-80). Accuracy was verified with the standards Montana Soil Nist-2711 (6.25 ± 0.19
lg g
1) and River Sediment GBW–GBW 08301 RCV8221 (0.220 ± 0.040
lg g
1).2.5. Soil incubation experiment
2.5.1. Incubation
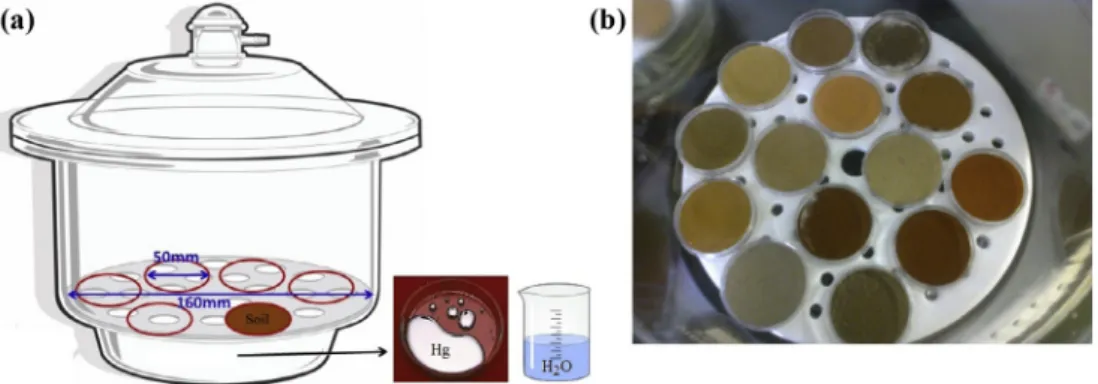
About 2.00000 g of each soil sample were plated onto 50-mm id Millipore plastic plates, which were randomly placed into five identical 160-mm desiccators. The samples were randomly placed in the desiccators, but for each soil class A and B horizon samples were place in the same desiccator for proper comparison. A 50-mm Petri dish with 100 g of metallic mercury and two 5-mL beakers filled with ultrapure water were also placed in each desiccator (Fig. 1). The desiccators were then closed under reduced pressure.
After two weeks the beakers containing water were removed and the desiccators were then left open for 48 h for excess con-densed water evaporation and closed again for another four months, the first three months under reduced pressure and the fourth month under room pressure.
After this time, the samples were exposed to air for 24 h at room temperature for removal non-adsorbed mercury before being submitted to thermal desorption analysis. The samples that presented characteristic peaks for the release less oxidized mer-cury (Hg0 and Hg
2
2+) after incubation were analyzed again to
check for changes in the thermal desorption profiles one week after air drying.
2.5.2. Thermal desorption analysis
Mercury speciation was determined using an atomic absorp-tion spectrometer (CG Analytical model GBC 932 AA) coupled to a thermal desorption oven (TDAAS). This technique is based on heating the sample from room temperature to approximately 600°C at a constant rate (33°C min 1). Thermograms of vapor released by the samples were obtained in an atomic absorption detector cell using nitrogen flow (200 mL min 1) as a carrier
gas.
Thermograms, which are records of the absorbance per gram as a function of temperature, were then obtained. The differentiation between Hg0/Hg
2
2+and Hg2+present in the samples was determined
by comparing the obtained thermal desorption profiles with stan-dard mercury profiles from previous studies (Valle et al., 2005, 2006). The thermograms were obtained with a sample mass between 10 and 100 mg and mathematically treated to normalize the absorbance for mass; unresolved peaks were deconvoluted using Microcal Origin 8.0 software.
2.5.3. Extraction and quantification of total retained mercury The total mercury content retained in the soils was quantified by cold vapor atomic absorption spectrometry - CVAAS (USEPA SW-846, Method: 7470A/1994) after extraction with 10.00 mL of a 7 M HNO3solution added to 0.1000 g of each soil sample in a
Falcon tube.
The suspensions were stirred for 1 h on a horizontal table with the tubes set in vertical position and allowed to stand for 16 h. After this, the soil solutions were filtered through qualitative filter paper, washed with ultrapure water and the collected supernatant was transferred to 50.00 mL volumetric flasks, which were com-pleted with ultrapure water. The supernatant was analyzed to determine the mercury content.
The background was obtained by subjecting each non-incu-bated soil sample to the same extraction procedure. Extraction and quantification were performed in duplicate for both non-incu-bated and incunon-incu-bated soil samples.
2.5.4. Extraction and quantification of available mercury
The available mercury content in incubated soils was quantified after extraction with KNO3solution. To 1.0000 g of each soil sample,
in a Falcon tube, 20.00 mL of 0.1 M KNO3solution was added. The
suspensions were stirred for 12 h on a horizontal shaker and were centrifuged at 2493 g (RCF) (3500 rpm – SIGMA Lab Centrifuge 6– 15) for ten minutes. The supernatants were analyzed for mercury content in a Milestone Direct Milestone Analyzer (DMA-80). The background was obtained by subjecting each non-incubated soil sample to the same extraction procedure. Extraction and quantifi-cation were performed in duplicate for both non-incubated and incubated soil samples.
3. Results and discussion
The main objective of this study was not to simulate natural contamination of soil by elemental mercury, but to differentiate the retention processes in action in horizons (A and B) of different tropical soils upon sample contact with gaseous mercury. The sam-ples were exposed to a large quantity of gaseous mercury for a long period. The amounts of mercury retained by each soil sample under long exposure to high mercury concentrations can be said to be the maximum mercury retention capacity of the soils under
the study conditions (contact with elemental mercury, pH, mois-ture, microorganisms, etc.).
Table 1gives the soil sample characterization results. Soil clas-sification is according to Soil Taxonomy (Soil Survey Staff, 2010) and sample identification code of the sample is in agreement with the Brazilian soil classification (Santos et al., 2006), followed by capital letters A or B, corresponding to A or B soil horizon, as for example: NVef-A is a A horizon Eutrophic Red Nitosol sample.
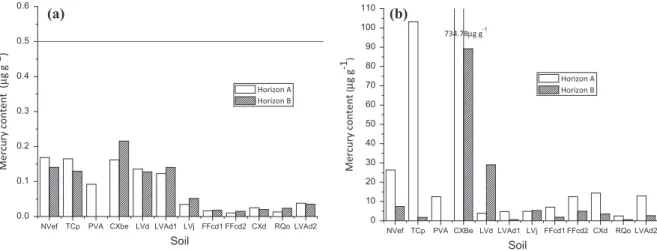
The analyzed samples presented a maximum natural mercury content of 0.215 ± 0.009
lg g
1 and a mean value of0.08 ± 0.06
lg g
1, which are below the prevention level of0.500
lg g
1(Fig. 2a) set forth for soils by Brazilian environmentalregulations (CONAMA, 2009), and also below the thermal desorp-tion detecdesorp-tion limit, for which reason pre-incubadesorp-tion thermograms are not shown. The mercury content of incubated samples ranged from 0.6 ± 0.2 to 735 ± 9
lg g
1 (Fig. 2b) with a mean value of44 ± 146
lg g
1. This result gives evidence that mercury retentiondepends on soil characteristics, because, although all the samples had been submitted to the same incubation conditions (mercury atmosphere, moisture, etc.), the retained mercury contents varied greatly.
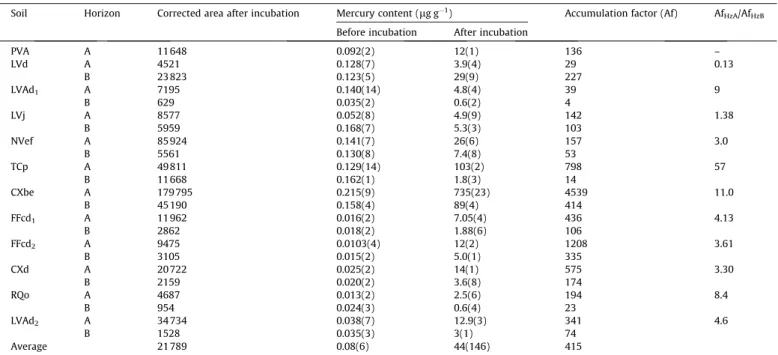
Table 2shows the mercury contents of the samples before and after incubation with elemental mercury. It also gives the normal-ized absorbance values (ratio of the area under the curve to the analyzed sample mass) and the mercury retention factors (ratio of the mercury contents before and after incubation) for each soil. These results will be discussed in detail further ahead.
The mercury retention factors ranged from 4 to 4539 (Table 2). Out of the 23 investigated samples, only LVAd1-B had a retention
factor lower than 10; 5 samples had factors between 14 and 53 (TCp-B, RQo-B, LVd-A, LVAd1-A, and NVef-B) and 8 had retention
factors between 74 and 227 (LVAd2-B, LVj-B, FFcd1-B, PVA-A,
LVj-A, NVef-LVj-A, CXd-B, RQo-A and LVd-B). The other samples had reten-tion factors higher than 335, with the highest values for samples FFcd2-A, 1208, and CXbe-A, 4539.
The results in Table 2 demonstrate that mercury retention depends on the soil characteristics and horizon as well. Comparison of same soil A and B horizons (Fig. 2b) showed that in almost all soils, A horizon adsorbed a greater amount of mercury than B horizon. The retention factors (Table 2) of A horizon ples were about 1.4–46 times higher than those of B horizon sam-ples, with the highest value for TCp-A.
Considering that the main difference between A and B horizons in these soils is the organic matter content, we can infer that organic matter plays a major role in mercury retention by soil, even
though the retained mercury content did not correlate significantly with the organic matter content.Ravichandran (2004)investigated mercury retention in aquatic systems and proposed that the lack of correlation between these two parameters does not mean that their interaction is weak or little significant, since the binding of mercury to organic matter depends on a small number of mole-cules that present sulfur functional groups.
CXBe-A had the highest mercury retention capacity according to both after the nitric acid extraction method and detection by CVAAS and the normalized absorbance result, after TDAAS analysis. This soil sample also had the greatest pH (7.52) and CEC values and one of the greatest clay and organic matter contents (Table 1). The synergy of these factors is responsible for the great adsorption capacity of this soil, since it presents specific and non-specific mer-cury adsorption sites. Clay has a large specific surface area, which allows physical sorption to occur, and it contains minerals that provide specific adsorption sites, such as iron oxides, present in a high content in this sample. Organic matter also presents specific adsorption sites, such as hydroxyl and -SH functional groups, the latter being the main group responsible for mercury chemical binding. According toFergusson (1990), mercury in soil probably occurs mainly chelated to S-containing amino acids, proteins and humic acid-like substances. Since this is a eutrophic soil with a high organic matter content and near-neutral pH, conditions that are favorable to great microbial activity, it may have greatly affected the oxidation of elemental mercury (Smith et al., 1998; Colombo et al., 2013; Colombo et al., 2014) and its retention through different mechanisms by specific and non-specific adsorp-tion sites and even precipitaadsorp-tion after oxidaadsorp-tion.
For the soil with the lowest retention capacity, the two employed methods, TDAAS and CVAAS, disagreed to a degree for adsorption capacity order, but agreed that the lowest adsorption capacity soils were RQo-B and LVAd1-B (Table 2). The low retention
capacity of RQo-B is explained by the simultaneous occurrence of low CEC, pH, and organic matter, clay and iron oxide contents.
To determine which soil characteristics are the most important for mercury retention, they were correlated with their retained mercury contents and the significance of the obtained correlation coefficients was validated with t-test at 95% confidence.
The mercury contents obtained by CVAAS, after nitric acid extraction and normalized absorbance (by TDAAS) showed high and significant correlation (r= 0.90⁄, 95%t-test confidence), that is, the two methods agreed in the comparison of mercury retention in the investigated soils. Both the extracted mercury contents and the normalized absorbance values correlated significantly with pH
NVef TCp PVA CXbe LVd LVAd1 LVj FFcd1 FFcd2 CXd RQo LVAd2 0.0
0.1 0.2 0.3 0.4 0.5 0.6
Mercury content (
µ
g g
-1 )
Soil
Horizon A Horizon B
(a)
NVef TCp PVA CXBe LVd LVAd1 LVj FFcd1 FFcd2 CXd RQo LVAd2 0
10 20 30 40 50 60 70 80 90 100 110
Mercury content
(
µ
g g
-1 )
Soil
Horizon A Horizon B 734.78µg g-1
(b)
Fig. 2.Mercury content in soils: (a) before incubation. Line plotted parallel to theXaxis withy= 0.5000lg g 1, prevention level set forth for soils by Brazilian environmental regulations (CONAMA, 2009). (b) After incubation.
(r= 0.65⁄and r= 0.74⁄, respectively), CEC (r= 0.57⁄andr= 0.66⁄, respectively) and amorphous iron oxide contents isomorphically substituted with aluminum, Alox (r= 0.55⁄and r= 0.60⁄,
respec-tively). One can see that the thermal desorption results had higher coefficients, which may indicate a greater sensitivity to variations in mercury content or that some data may have been lost during the nitric acid extraction. Pearson correlation also shows that the A horizon samples showed a greater correlation for extracted mer-cury content and normalized absorbance values with pH and CEC probably due to the influence of organic matter. Again, thermal desorption was more sensitive, with the exception of pH in B hori-zon samples, which had practically the same values from CVAAS and TDAAS. The separate investigation of the two horizons showed the major role that organic matter seems to play. The correlation of retained mercury with pH in A horizon samples was 26.5% higher on average than for whole soil values. In contrast, the effect of pH on mercury retention in B horizon samples was much smaller. The high correlation values of pH and mercury retention may have been due to the extreme importance of pH in soil sorption pro-cesses. For example, increasing the pH may increase the quantity of negative charges in soil and the CEC of the organic and mineral fractions in variable charge soils (McBride, 1994; Zhang and Zhang, 1997). pH influences specific adsorption (Yu et al., 1997) and non-specific adsorption (Ji and Li, 1997) of metals, as well as the forma-tion of precipitates and redox processes (McBride, 1994).
Another important characteristic of soils with near-neutral pH, good availability of mineral nutrients and organic matter is a greater microbial activity,to which the oxidation of Hg0in contact
with soil may be attributed, as will be discussed later on. Bacteria may oxidize elemental mercury to ionic mercury (Smith et al., 1998; Colombo et al., 2013; Colombo et al., 2014), which can be adsorbed by the soil.
After oxidization to Hg2+, the main mercury retention factors in
soil are: inorganic and organic CEC and iron oxide and organic mat-ter contents. The former promotes electrostatic adsorption and the latter also contribute to specific adsorption with the formation of strongly covalent bonds (Yu et al., 1997). Since the CEC of highly
weathered soils is strongly dependent on organic matter negative charges (McBride, 1994; Zhang and Zhang, 1997; Ji and Li, 1997), its effect on the surface horizon seems to be more important (r= 0.85⁄andr= 0.72⁄with TDAAS or CVAAS, respectively). This was corroborated by the lack of correlation of CEC with the retained mercury contents in B horizon soil samples. In contrast to what was observed for A horizon samples, extremely low corre-lations were observed for B horizon samples, and CEC and retained mercury content did not correlate significantly either with TDAAS or CVAAS results after nitric acid extraction, which had correlation coefficients of 0.08 and 0.17, respectively.
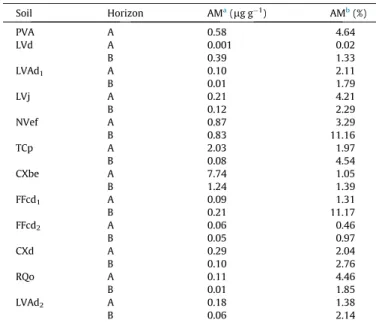
3.1. Available mercury
Table 3shows the available mercury content in soils after Hg0
incubation and its percentage related to the total retained mercury. The available mercury is expected to include soluble and exchangeable Hg22+and Hg2+species. Considering all the mercury
present in the form of Hg0, its solubility in water
(5.610 5g L 1according to theCommittee on the Toxicological
Effects of Methylmercury, 2000), according to the method used, a recovery of 1.12
lg g
1mercury might be achieved from allsam-ples, except LVAd1-B and RQo-B, which exhibited a total mercury
content lower than 1
lg g
1. However, that was not observed.The available mercury content of soils after Hg0incubation ranged
from 0.001 to 7.74
lg g
1, with an average of 0.67lg g
1(Table 3).The available mercury content ranged from 1120 times lower to 6.9 times higher than the Hg0solubility itself could produce. This
behavior was expected since Hg2+ originated on the soil surface
may be weakly adsorbed on a negatively charged soil matrix and may form stronger inner sphere complexes with OM, Fe and Al oxi-des, besides precipitates that the KNO3solution cannot extract. The
average percentage of available mercury in soils after Hg0
incuba-tion was 2.97%, with a maximum of 13.38% (Table 3). Furthermore, the available mercury content was correlated with CEC and pH (r= 0.61⁄and 0.68⁄, respectively), which supports the hypothesis on Hg0oxidation to Hg2+in soils.
Table 2
Corrected thermogram areas after incubation, mercury contents before (natural content) and after (extracted content) incubation, accumulation factor (Af) of each soil (ratio between mercury contents before and after incubation) and ratio between the accumulation factors of A horizons (AfHzA) and B horizons (AfHzB).
Soil Horizon Corrected area after incubation Mercury content (lg g 1) Accumulation factor (Af) AfHzA/AfHzB
Before incubation After incubation
PVA A 11 648 0.092(2) 12(1) 136 –
LVd A 4521 0.128(7) 3.9(4) 29 0.13
B 23 823 0.123(5) 29(9) 227
LVAd1 A 7195 0.140(14) 4.8(4) 39 9
B 629 0.035(2) 0.6(2) 4
LVj A 8577 0.052(8) 4.9(9) 142 1.38
B 5959 0.168(7) 5.3(3) 103
NVef A 85 924 0.141(7) 26(6) 157 3.0
B 5561 0.130(8) 7.4(8) 53
TCp A 49 811 0.129(14) 103(2) 798 57
B 11 668 0.162(1) 1.8(3) 14
CXbe A 179795 0.215(9) 735(23) 4539 11.0
B 45 190 0.158(4) 89(4) 414
FFcd1 A 11 962 0.016(2) 7.05(4) 436 4.13
B 2862 0.018(2) 1.88(6) 106
FFcd2 A 9475 0.0103(4) 12(2) 1208 3.61
B 3105 0.015(2) 5.0(1) 335
CXd A 20 722 0.025(2) 14(1) 575 3.30
B 2159 0.020(2) 3.6(8) 174
RQo A 4687 0.013(2) 2.5(6) 194 8.4
B 954 0.024(3) 0.6(4) 23
LVAd2 A 34 734 0.038(7) 12.9(3) 341 4.6
B 1528 0.035(3) 3(1) 74
Average 21 789 0.08(6) 44(146) 415
The available mercury content also correlated with the total mercury content (r= 0.99). This high correlation coefficient is obvi-ous since the source of soil mercury was gaseobvi-ous Hg0and the more
mercury is transferred to the soil and oxidized, the greater the amount that may be available (exchangeable and soluble).
3.2. Role of organic matter
Hissler and Probst (2006) demonstrated the relevance of organic matter in mercury retention. They proposed that most atmospheric mercury is retained by organic matter in soil and stream sediments.Rennerberg and Duda (2001)showed that dec-ades after the contamination of soil with metallic mercury, over 85% of mercury was associated to the soil organic matter.
Guedron and colleagues (2013) investigated the mechanisms of incorporation of mercury into soil near a chlor-alkali industry and concluded that it was strongly bound to organic matter. The relation between organic matter and Hg0 oxidation was also
observed byValle and colleagues (2006)studying Amazon soils. They observed a range of 28–68% of Hg0 oxidation, and kinetic
studies concluded that the oxidation processes are predominant over the reduction processes. The efficiency of retention/stabiliza-tion by organic matter explain the high these findings and the background values found in these soils.
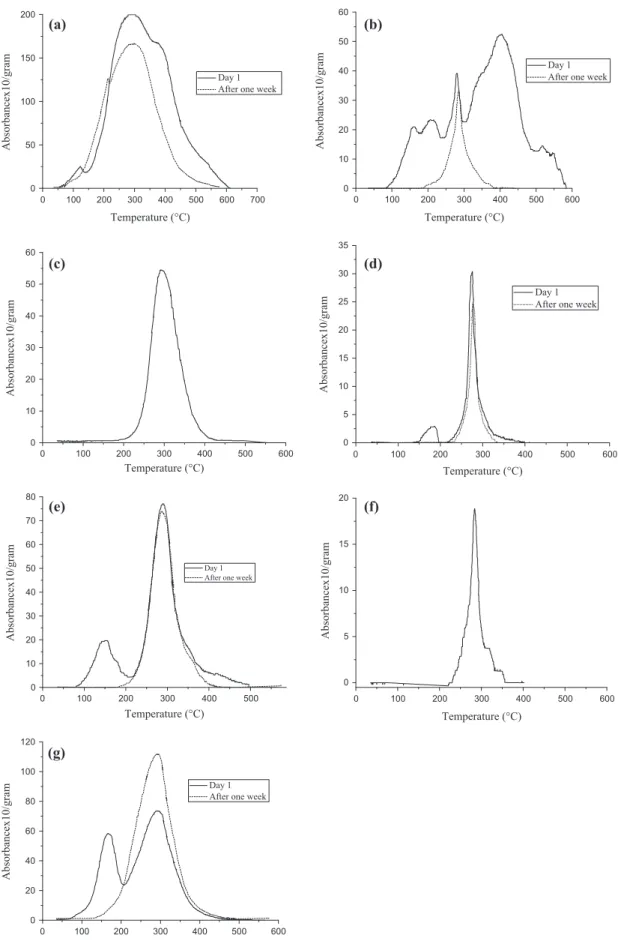
Fig. 3shows the thermograms of some incubated samples. The areas under the thermogram replicates show a coefficient of vari-ation from 2% to 31%, with an average of 14%, demonstrating the good precision of the thermal desorption analysis.
The thermograms of 15 of the 23 samples had only one peak around 300°C (Fig. 3c), the region characteristic of Hg2+release, which shows that mercury was oxidized during incubation under the investigation conditions. Another three types of thermograms were also observed: thermograms with a peak in the typical Hg2+
region with a shoulder around 100°C (Fig. 3a), characteristic of thermal desorption of less oxidized forms of mercury (Hg0/Hg
2 2+);
thermograms with two distinct peaks, one between 100 and 200°C (Hg0/Hg22+ peak) and another around 300°C (Hg2+ peak)
(Fig. 3d) and a rather broad thermogram with various peaks start-ing around 100°C, which occurred with only one sample (Fig. 3b). From these 15 samples with only one peak around 300°C, 10 were from A horizon. Considering that the main difference between A and B horizons from the same soil is the organic matter content, we deduced that organic matter influenced mercury oxi-dation either through biotic via (Smith et al., 1998; Colombo et al., 2013; Colombo et al., 2014) or abiotic via (Yamamoto, 1995). Abiotic mercury oxidation occurs because the organic matter has -SH groups, which have a high affinity to mercury ions, and as already demonstrated (Yamamoto, 1995), mercury oxidation is favored by the presence of compounds with high affinity to the mercury ion.
The microbial contribution to mercury oxidation was first pro-posed bySmith and colleagues (1998), who demonstrated that typ-ical soil bacteria (BacillusandStreptomyces) can oxidize elemental mercury to Hg2+ through enzymatic paths. Recent studies have
shown that mercury can also be oxidized by anaerobic bacteria (Colombo et al., 2013; Colombo et al., 2014).
Oxidation probably occurs on the soil surface at the moment of or after the adsorption of elemental mercury. A rarefied and satu-rated gaseous mercury atmosphere in the desiccator ensured the presence of elemental mercury. If mercury were oxidized in the air and then deposited, the thermal desorption profiles of the sam-ples from the same desiccator would not be much different either qualitatively or quantitatively, in contrast to the current observa-tions (Fig. 2b). This behavior demonstrates that the characteristics soil play an essential role in the retention and speciation of adsorbed mercury. In the atmosphere, where 95% of the total mer-cury is in elemental form, Hg0 is slowly oxidized to Hg2+, with
ozone as its main oxidant (Morel et al., 1998). Considering the ozone concentration inside the desiccator is nearly null, a probable abiotic oxidation path is the oxidation of elemental mercury in the air–soil interface by the oxygen in contact with the soil. Once in the Hg2+ form, mercury binds to the organic matter. According to
Yamamoto (1995), the conversion of Hg0into Hg2+is fast due to
the change in the equilibrium of these forms caused by the forma-tion of the stable RS-Hg2+complex. The lower percentages of
avail-able mercury in A horizons when compared to B horizons (Table 3) support this idea.
Correlation analysis of these 15 samples revealed a positive and significant correlation between the extracted retained mercury content and the pH and CEC values (r= 0.73⁄andr= 0.67⁄, respec-tively). The positive correlation with CEC corroborates the hypoth-esis of microbial oxidation, since a greater CEC may result in greater soil nutrient availability, which also corroborates the fact that in soils with near-neutral pH, greater amounts of mercury are retained. One can see that at and below pH 5 (Tables 1 and 2), mercury retention was very low, even for LVd-A, which had a high organic matter content, and that the soil samples with very low mercury retention and pH higher than 5 were all from B hori-zon samples (TCp-B and LVAd1-B).
The characteristics of soils TCp and LVAd1(Table 1) clearly show
that organic matter is the most important factor among the factors considered important for mercury retention (pH, CEC and organic matter). The pH and CEC values of TCp sample A and B horizons did not differ much. The organic matter content of A horizon (2.92%) was 4.9 times higher than that of B horizon (0.595%) This different organic matter content was probably responsible for the retention of 46 times more mercury in A horizon than in B horizon in this soil (Table 2). This means that despite the high pH, the sim-ilar CEC values of A and B horizons and the high clay content of B horizon, the near non-existence of organic matter in B horizon pre-vented the retention of large amounts of mercury in sample TCp-B. The thermograms inFig. 3a show that A horizon of TCp soil (TCp-A) retained mercury through the partial oxidization of Hg0to Hg2+
Table 3
Available mercury content (AM) in soils after Hg0incubation.
Soil Horizon AMa(
lg g 1) AMb(%)
PVA A 0.58 4.64
LVd A 0.001 0.02
B 0.39 1.33
LVAd1 A 0.10 2.11
B 0.01 1.79
LVj A 0.21 4.21
B 0.12 2.29
NVef A 0.87 3.29
B 0.83 11.16
TCp A 2.03 1.97
B 0.08 4.54
CXbe A 7.74 1.05
B 1.24 1.39
FFcd1 A 0.09 1.31
B 0.21 11.17
FFcd2 A 0.06 0.46
B 0.05 0.97
CXd A 0.29 2.04
B 0.10 2.76
RQo A 0.11 4.46
B 0.01 1.85
LVAd2 A 0.18 1.38
B 0.06 2.14
a Extracted with 0.1 M KNO 3solution.
b Ratio between mercury concentration on KNO
3extract and total mercury concentration, extracted with 7 M HNO3.
0 50 100 150 200
Absorbancex10/gram
Temperature (°C)
Absorbancex10/gram
Temperature (°C)
Absorbancex10/gram
Temperature (°C)
Absorbancex10/gram
Temperature (°C)
Absorbancex10/gram
Temperature (°C)
Absorbancex10/gram
Temperature (°C)
Absorbancex10/gram
Temperature (°C) Day 1 After one week
(a)
0 10 20 30 40 50 60
Day 1 After one week
(b)
0 10 20 30 40 50 60
(c)
0 5 10 15 20 25 30 35
Day 1 After one week
(d)
0 10 20 30 40 50 60 70 80
Day 1 After one week
(e)
0 5 10 15 20
(f)
0 100 200 300 400 500 600 700 0 100 200 300 400 500 600
0 100 200 300 400 500 600 0 100 200 300 400 500 600
0 100 200 300 400 500 0 100 200 300 400 500 600
0 100 200 300 400 500 600
0 20 40 60 80 100 120
Day 1 After one week
(g)
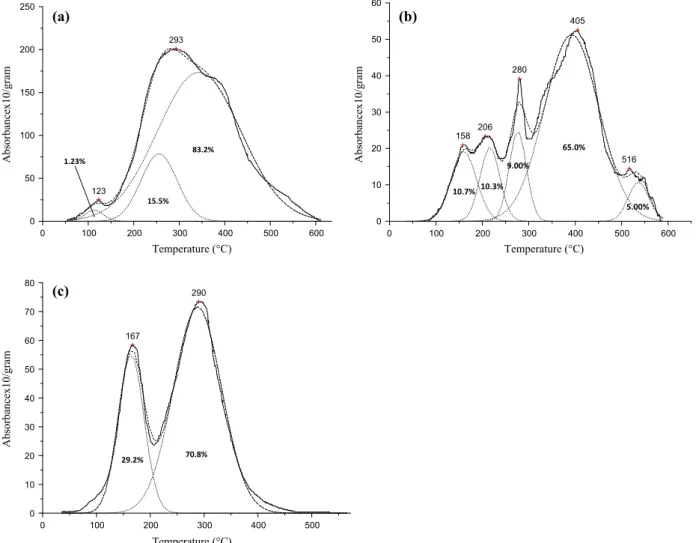
and the desorption of excess elemental mercury. The initial ther-mogram (day 1) had a broad band with a small shoulder with an area of 1.23% of the total area (Fig. 4a) in the 100°C temperature range. This shoulder, characteristic of Hg0, disappeared after one
week of exposure to the air. Comparatively, the final thermogram had an area reduction of 29% that cannot be justified only by the loss of the mercury corresponding to the shoulder in the initial thermogram. The deconvolution of the initial curve suggests a band with a peak around 250°C that certainly corresponds to Hg2+. Additionally, the one-week thermogram started at a lower
temperature, which indicates the presence of Hg0in addition to
Hg2+. Therefore, it is possible that for this soil there was adsorption
of a great excess of elemental mercury that was partially oxidized but that after one week was not completely desorbed.
The thermogram of sample TCp-B obtained 24 h after interrup-tion of the incubainterrup-tion presented a characteristic Hg2+ peak at
280°C with an area of only 9.0% (Fig. 4b) and other peaks at lower temperatures, which may mean that this sample adsorbed elemen-tal mercury only on the surface through weak bonds that were bro-ken after one week of exposure to the air. The fact that the peak at 280°C did not increase after one week (Fig. 3b) leads to the conclu-sion that the initially adsorbed elemental mercury was neither oxi-dized nor remained in the soil and therefore was completely desorbed. The bands observed at very high temperatures in the ini-tial thermogram (Fig. 4b) may have been due to elemental mercury trapped in micropores that had been released upon heating and not
by oxidized forms, as proposed byBiester and colleagues (2002). In contrast to A horizon, B horizon desorbed excess elemental mercury after one week, which shows that even though the retention of ele-mental mercury took place through physisorption, the interaction with mercury in A horizon was stronger than in B horizon.
The greater importance of the role of organic matter in the reten-tion of mercury was also evident in sample LVAd1, which had an
organic matter content 5.59 times greater in A horizon (2.41%) than in B horizon (0.43%). Despite the organic matter content slightly higher than those of TCp soil, the mercury content retained in A horizon was 9.13 times greater than in B horizon, in contrast to the value 46 times greater of TCp (Table 2). This smaller concentra-tion factor may have been set off by the greater pH of B horizon (6.22) in comparison to A horizon (5.24) and the greater CEC of B horizon (4.17 cmolckg 1) in relation to A horizon (2.16 cmolckg 1).
Despite these compensatory effects, the mercury retention ratios of LVAd1horizons were the third highest, being lower only than TCp
and CXbe, which corroborates the role of organic matter. One must bear in mind that besides the organic matter content, its quality directly influences the chemical and biological phenomena involved in mercury retention, which makes the comparison of dif-ferent soil types very difficult, but which is feasible for same soil horizons. In contrast to that observed for TCp, LVAd1B horizon
did not present a characteristic Hg0peak (Fig. 3f).
A horizon of LVAd1soil presented an Hg0peak that disappeared
after 1 week of exposure to the air without the appearance of any
0 50 100 150 200 250
123
293
15.5% 1.23%
Absorbancex10/gram
Temperature (°C)
Absorbancex10/gram
Temperature (°C)
Absorbancex10/gram
Temperature (°C) 83.2%
(a)
0 10 20 30 40 50 60
158 206
280
405
516 65.0%
9.00%
10.3% 10.7%
5.00%
(b)
0 100 200 300 400 500 600 0 100 200 300 400 500 600
0 100 200 300 400 500
0 10 20 30 40 50 60 70 80
167
290
29.2% 70.8%
(c)
Fig. 4.Deconvolution of the thermograms of soils (a) TCp-A, (b) TCp-B, (c) PVA-A obtained 24 h after incubation (day 1). The thermograms show the temperature peaks and the percent contribution of the area of each band to the total area under the curve.
Hg2+-related peak (Fig. 3e). In most cases of physical adsorption,
Hg0was not further oxidized upon air exposure and followed by
an increase in the Hg2+peak, with the exception of PVA A horizon
(Fig. 3g). Initially the area under the peak associated with Hg0was
29.2% of the total area (Fig. 4c). After 1 week, this peak disappeared and the Hg2+peak increased, while the total area under the curve
remained the same, suggesting that the Hg0in the soil had been
completely oxidized at the air–soil interface and remained adsorbed in the soil. Once more, this behavior shows that various mechanisms determined by soil physical, chemical, microbiologi-cal and possibly mineralogimicrobiologi-cal characteristics may act in the reten-tion and transformareten-tion of elemental mercury in contact with soil. When two different soils are compared, the soil with a greater organic matter content does not necessarily adsorb a greater quan-tity of mercury because beside differences in the organic matter characteristics other soil characteristics may influence the soil mercury retention capacity. However, same soil A and B horizons are more similar to each other both chemically and mineralogically and because both probably present much more qualitatively simi-lar organic matters than soils from different regions. Nevertheless, care must be taken since organic matter composition may vary with profile depth because of preferential migration of more sol-uble organic compounds, such as fulvic acid, in addition to a possi-ble constant input of organic matter not decomposed in the surface horizon (Stevenson, 1994). Nevertheless, the comparison of same soil A and B horizons still is the best way to compare soils with similar organic matters with only quantitative differences.
Comparison of the ratios between the HNO3-extracted mercury
content, normalized TDAAS absorbance and the carbon content from A and B horizons shows that these parameters are greater in A horizon than in B horizon in all the soils for most of the samples.
The behavior of the amounts of mercury retained in A and B horizons of soil LVd was atypical with a greater retention in B hori-zon than in A horihori-zon, despite the greater organic matter content of A horizon. B horizon (Table 1) presented more aluminum-substi-tuted iron oxides than A horizon, as shown by the aluminum extraction values by DCB and A horizon had greater amounts of exchangeable aluminum, as shown by the lower pH in KCl in rela-tion to the pH in water and greater aluminum content by oxalate extraction. The greater exchangeable aluminum content of A hori-zon may have hindered the complexation of mercury at the organic matter complexation sites, since Al3+has great affinity for the same
sites (Stevenson, 1994). On the other hand, more isomorphically aluminum-substituted iron oxides have a greater specific surface area (Cornell and Schwertmann 1996), which may have favored a greater adsorption of mercury in B horizon.
4. Conclusions
The retention of gaseous mercury by tropical soils varied quan-titatively and qualitatively as a function of soil type and soil horizon.
The different soil samples exposed to high concentrations of Hg0presented different mercury oxidation and adsorption
capaci-ties. The maximum adsorption capacity ranged from 0.6 ± 0.2 to 735 ± 23
lg g
1, with a mean value of 44 ± 146lg g
1of retainedmercury.
For samples from the same soil, A horizon retained more mer-cury than B horizon, with one exception, which demonstrated the essential role of organic matter in this process.
The thermograms of all samples presented characteristic Hg2+
peaks, corroborating that elemental mercury had been oxidized not in the air, but in the air/soil interface, since the Hg2+contents
of the samples varied greatly.
No significant correlation was found between mercury reten-tion capacity and organic matter content for any of the soil sam-ples, which demonstrates that quantitative comparison of distinct organic matter may be unviable.
Among the soil characteristics responsible for the retention of elemental mercury, organic matter content, and soil pH and CEC stand out.
Soils with pH below 5.0 retained low amounts of mercury, even soil with high organic matter contents. The greatest mercury reten-tion occurred in more eutrophic soils with near-neutral pH and with larger organic matter contents, which may suggest that the retention of mercury from the atmosphere was mediated by microorganisms.
Some thermograms presented characteristic adsorbed Hg0
peaks that disappeared one-week after incubation. With the excep-tion of Ultisol (PVA sample) which presented oxidaexcep-tion after incu-bation, the Hg0 peak of the thermograms of the other samples
disappeared after 1 week of exposure to the air without the corre-sponding increase in the Hg2+peak.
The available mercury content after Hg0incubation ranged from
0.001 to 7.74
lg g
1, with an average of 0.67lg g
1and correlatedwith the total mercury content, CEC and soil pH.
The soils that retained more mercury, due mainly to organic matter, were those that presented the lowest exchangeable frac-tion recovery percentages. This strong retenfrac-tion of mercury by organic matter may make the remediation of these soils more difficult.
Acknowledgments
To CNPq (National Council of Technological and Scientific Development) and to FAPEMIG (Minas Gerais Research Support Foundation) for the financial resources for project CRA-APQ-03861-09.
References
Barkay, T., Miller, M.S., Summer, A.O., 2003. Bacterial mercury resistance from
atoms to ecosystems. FEMS Microbiol. Rev. 27, 355–384.
Bernhoft, A.B., 2012. Mercury toxicity and treatment: a review of the literature. J.
Environ. Public. Health, 1–10.
Biester, H., Gosar, M., Covelli, S., 2000. Mercury speciation in sediments affected by dumped mining residues in the drainage area of the Idrija mercury mine.
Environ. Sci. Technol. 34, 3330–3336.
Biester, H., Müller, G., Schöler, H.F., 2002. Binding and mobility of mercury in soils contaminated by emissions from chlor-alkali plants. Sci. Total Environ. 284,
191–203.
Biester, H., Scholz, C., 1997. Determination of mercury binding forms in contaminated soils: mercury pyrolysis versus sequential extractions. Environ.
Sci. Technol. 31, 233–239.
Colombo, M.J., Ha, J., Reinfelder, J.R., Barkay, T., Yee, N., 2013. Anaerobic oxidation of Hg(0) and methylmercury formation by Desulfovibrio desulfuricans ND132.
Geochim. Cosmochim. Ac. 112, 166–177.
Colombo, M.J., Ha, J., Reinfelder, J.R., Barkay, T., Yee, N., 2014. Oxidation of Hg(0) to
Hg(II) by diverse anaerobic bacteria. Chem. Geol. 363, 334–340.
Committee on the Toxicological Effects of Methylmercury, Board on Environmental Studies and Toxicology, Commission on Life Sciences, National Research Council, 2000. Toxicological Effects of Methylmercury. National Academy Press, Washington, DC.
CONAMA – CONSELHO NACIONAL DO MEIO AMBIENTE, 2009. Dispõe sobre critérios e valores orientadores de qualidade do solo quanto à presença de substâncias químicas e estabelece diretrizes para o gerenciamento ambiental de áreas contaminadas por essas substâncias em decorrência de atividades antrópicas. Resolução n°420, de 28 de dezembro de 2009. Diário Oficial da União n°249, p. 81–84, 30 dez. 2009.
Cornell, R.M., Schwertmann, U., 1996. The Iron Oxides: Structure, Properties,
Reactions, Occurrence and Uses, 1st ed. VCH, New York.
DNPM – DEPARTAMENTO NACIONAL DE PRODUÇÃO MINERAL. Anuário Mineral Brasileiro, 2010. Brasília. 2010. <http://www.dnpm.gov.br/relatorios/amb/
Completo_2010.pdf>.
EMBRAPA – Centro Nacional de Pesquisa de Solos. 1997. Manual de métodos de análise de solo, 2nded. EMBRAPA-CNPS, Rio de Janeiro.
Goleb, J.A., 1971. The determination of mercury in small terrestrial and nonterrestrial rock samples by atomic-absorption spectroscopy, and the study
of mercury release at elevated temperatures. Appl. Spectrosc. 25, 522–525.
González-Fernández, B., Menéndez-Casares, E., Meléndez-Asensio, M., Fernández-Menéndez, S., 2014. Sources of mercury in groundwater and soils of west Gijón
(Asturias, NW Spain). Sci. Total Environ. 481, 217–231.
Guédron, S., Grangeon, S., Jouravel, G., Charlet, L., Sarret, G., 2013. Atmospheric mercury incorporation in soils of an area impacted by a chlor-alkali plant (Grenoble, France): contribution of canopy uptake. Sci. Total Environ. 445–446,
356–364.
Henry, H.G., Stever, K.R., Barry, W.L., Heady, H.H., 1972. Determination of mercury
in low-grade ores. Appl. Spectrosc. 26, 288–293.
Hissler, C., Probst, J.L., 2006. Impact of mercury atmospheric deposition on soils and streams in a mountainous catchment (Vosges, France) polluted by chlor-alkali industrial activity: the important trapping role of the organic matter. Sci. Total
Environ. 361, 163–178.
Ji, G.L., Li, H.Y., 1997. Electrostatic adsorption of cations. In: YU, T.R. (Ed.), Chemistry
of Variable Charge Soils. Oxford Press, New York, pp. 64–111.
Lacerda, L.D., Ribeiro, M.G., Cordeiro, R.C., Siffedine, A., Turcq, B., 1999. Mercury atmospheric deposition during the past 30,000 years in Brazil. Cienc. Cult. J.
Braz. Ass. Adv. Sci. 51, 363–371.
Li, P., Feng, X., Qiu, G., Shang, L., Wang, S., Meng, B., 2009. Atmospheric mercury emission from artisanal mercury mining in Guizhou Province, Southwestern
China. Atmos. Environ. 43, 2247–2251.
Liu, F., Cheng, H., Yanga, K., Zhao, C., Liu, Y., Peng, M., Li, K., 2014. Characteristics and influencing factors of mercury exchange flux between soil and air in Guangzhou
City. J Geochem. Explor. 139, 115–121.
Mcbride, M.B., 1994. Environmental Chemistry of Soils. Oxford Press, New York.
Mckeague, J.A., Day, J.H., 1966. Dithionite and oxalate-extractable Fe and Al as aids
in differentiating various classes of soil. Can. J. Soil Sci. 46, 13–22.
Mehra, O.P., Jackson, M.L., 1960. Iron oxide removal from soils and clays by a dithionite-citrate system buffered with sodium bicarbonate. In: Clays & Clay Mineral Conference, Proceedings. v. 7. London, pp. 317–327.
Mello, J.W.V., Abrahão, W.A.P., 2013. Solos contaminados no Brasil. O desafio de definir valores de referência. In: Valores de referência de qualidade para elementos traço nos solos de Minas Gerais e Espírito Santo: os bastidores de uma experiência. Boletim informativo Sociedade Brasileira de Ciência do Solo, v. 38, Viçosa, pp. 12–17.
Morel, F.M.M., Kraepiel, A.M.L., Amyot, M., 1998. The chemical cycle and
bioaccumulation of mercury. Annu. Rev. Ecol. Syst. 29, 543–566.
Navarro, A., Canadas, I., Martinez, D., Rodriguez, J., Mendonza, J.L., 2009. Application of solar thermal desorption to remediation of mercury-contaminated soils. Sol.
Energy 83, 1405–1414.
Perez, J.M., Fostier, A.H., Carvalho Jr, J.A., Windmöller, C.C., Santos, J.C., Carpi, A., 2014. Soil and biomass mercury emissions during a prescribed fire in the
Amazonian rain forest. Atmos. Environ. 6, 4537–4541.
Ravichandran, M., 2004. Interactions between mercury and dissolved organic
matter-a review. Chemosphere 55, 319–331.
Renneberg, A.J., Dudas, M.J., 2001. Transformations of elemental mercury to inorganic and organic forms in mercury and hydrocarbon co-contaminated
soils. Chemosphere 45, 1103–1109.
Roeser, H.M.P., Roeser, P.A., 2010. O Quadrilátero Ferrífero – MG, Brasil: aspectos sobre sua história, seus recursos minerais e problemas ambientais relacionados.
Geonomos 18, 33–37.
Rumayor, M., Diaz-Somoano, M., Lopez-Anton, M.A., Martinez-Tarazona, M.R., 2013.
Mercury compounds characterization by thermal desorption. Talanta 114, 318–322.
Santos, H.G., Jacomine, P.K.T., Anjos, L.H.C., Oliveira, V.A., Oliveira, J.B., Coelho, M.R., Lumbreras, J.F., Cunha, T.J.F., 2006. Sistema brasileiro de classificação de solos.
Embrapa Solos, Rio de Janeiro.
Smith, T., Pitts, K., Mcgarvey, J.A., 1998. Summers AO. Bacterial oxidation of mercury
metal vapor, Hg(0). Appl. Environ. Microb. 64, 1328–1332.
Soil Survey Staff, 2010. Keys to Soil Taxonomy. United States Department of Agriculture, Washington.
Stevenson, F.J., 1994. Húmus Chemistry, 2nd ed. John Wiley & Sons, New York.
Tersic, T., Biester, H., Gosar, M., 2014. Leaching of mercury from soils at extremely contaminated historical roasting sites (Idrija area, Slovenia). Geoderma 226–
227, 213–222.
UNEP Chemicals Branch, 2008. The Global Atmospheric Mercury Assessment: Sources, Emissions and Transport. UNEP-Chemicals, Geneva.
Valle, C.M., Santana, G.P., Windmöller, C.C., 2006. Mercury conversion processes in amazon soils evaluated by thermodesorption analysis. Chemosphere 65, 1966–
1975.
Valle, C.M., Santana, G.P., Augusti, R., Egreja Filho, F.B., Windmöller, C.C., 2005. Speciation and quantification of mercury in Oxisol, Ultisol and Spodosol from
Amazon (Manaus, Brazil). Chemosphere 58, 779–792.
Wang, D., Shi, X., Wei, S., 2003. Accumulation and transformation of atmospheric
mercury in soil. Sci. Total Environ. 304, 209–214.
Windmöller, C.C., Wilken, R.D., Jardim, W.F., 1996. Mercury speciation in contaminated soils by thermal release analysis. Water Air Soil Pollut. 89,
399–416.
Yamamoto, M., 1995. Possible mechanism of elemental mercury oxidation in the
presence of SH compounds in aqueous solution. Chemosphere 31, 2791–2798.
Yu, T.R., Sun, H.Y., Zhang, H., 1997. Specific adsorption of cations. In: Yu, T.R. (Ed.),
Chemistry of Variable Charge Soils. Oxford Press, New York, pp. 140–174.
Zhang, X.N., Zhang, A.Z., 1997. Surface charge. In: Yu, T.R. (Ed.), Chemistry of
Variable Charge Soils. Oxford Press, New York, pp. 17–63.