www.ccarevista.ufc.br ISSN 1806-6690
Land use and trophic state dynamics in a tropical semi-arid reservoir
1Uso da terra e a dinâmica do estado trófico em reservatório do semiárido tropical
Júlio César Neves dos Santos2*, Eunice Maia de Andrade3, José Ribeiro de Araújo Neto4, Ana Célia Maia Meireles3 e Helba Araújo de Queiroz Palácio4
ABSTRACT -Water body eutrophication process has been a serious problem around the world, especially in semiarid and arid region where main approach to storage water is reservoir. The aim of this work was to investigate the spatial and seasonal variability in water quality of a reservoir in a semi-arid tropical region with regards to its trophic state, and to identify the sources of nutrient input to the reservoir. Essa pesquisa foi realizada no reservatório Orós, segundo maior do estado do Ceará-Brasil. This research was developed in the Orós reservoir, the second one most important reservoir in Ceará State, Brazil. Samples were collected bimonthly during the period April 2008 to April 2010, from sex sampling points representing the outlet of tributaries, and one point down of the dam. The study included the following variables: total phosphorus, transparency and chlorophyll-a. Trophic state was evaluated by application of the Carlson modified Trophic State Index (TSI). Maps of the spatial and seasonal dynamics of the water quality in the reservoir were constructed using GIS soft. According to the average values of total phosphorus (> 0.050 mg L-1), the waters can be classified as eutrophic. The highest concentrations of chlorophyll-a were found during the
dry season, with values ranging from 3.8 to 26.5 µg L-1, showing high temporal and spatial variations. The waters presented
as eutrophic regarding average TSI, at all points sampled. The results indicate a deterioration in water quality and the need for intervention to reduce the release of waste, and thus improve the trophic state of the waters of the Orós reservoir.
Key words: Water resources. Reservoirs. Water quality.
RESUMO - O processo de eutrofização de corpos aquáticos tem se tornado um sério problema em diferentes partes do
globo, sobretudo em regiões áridas e semiáridas no qual o armazenamento d’água ocorre principalmente em reservatórios superficiais. Objetivou-se com este trabalho investigar a variabilidade espacial e sazonal da qualidade da água em reservatório do semiárido tropical, quanto ao seu estado trófico bem como identificar as fontes de aportes de nutrientes ao reservatório. Essa pesquisa foi realizada no reservatório Orós, segundo maior do estado do Ceará-Brasil. As coletas foram realizadas bimestralmente no período de abril/08 a abril/10, em sete pontos de amostragem, sendo seis nos principais afluentes do reservatório e o sétimo logo a jusante da barragem. O estudo considerou as seguintes variáveis: fósforo total, transparência e a clorofila “a”. Para a avaliação do estado trófico foi aplicado o Índice de Estado Trófico (IET) modificado de Carlson. Foram elaborados mapas da dinâmica espacial e sazonal da qualidade das águas do reservatório. De acordo com os valores médios do fósforo total (> 0,050 mg L-1), as águas enquadram-se na classe eutrófica. As maiores concentrações de clorofila
“a” foram verificadas na estação seca, com valores variando de 3,8 a 26,5 µg L-1, expressando elevadas variações temporais
e espaciais. As águas apresentaram-se estróficas, quanto ao IET médio, em todos os pontos amostrados. Os resultados indicam uma deterioração da qualidade da água e uma necessidade de intervenções destinadas a reduzir o lançamento de resíduos e, consequentemente, melhorar o estado trófico das águas do açude Orós.
Palavras-chave: Recursos hídricos. Reservatórios. Qualidade de água.
*Autor para correspondência
1Recebido para publicação em 02/06/2012; aprovado em 17/09/2013
Pesquisa realizada em cooperação entre a Universidade Federal do Ceará e o Instituto Federal do Ceará, Campus de Iguatu-CE e financiada pelo CNPq
2Programa de Pós-Graduação em Engenharia Agrícola/CCA/UFC, Campus do PICI Bloco 804, Caixa Postal 12.168, Fortaleza-CE, Brasil,
60.450-760, juliocesarnds@yahoo.com.br
INTRODUCTION
The rapid process of degradation of bodies of water has become a serious problem in water body
around the world (BARBOSAet al., 2006; CORREIA;
MIRANDA; GUIMARÃES, 2012). In addition to this fact, water stored in surface reservoirs may ndergo significant changes on a temporal and spatial scale, substantially altering conditions of usage for those who
benefit from such water (COOKet al., 2010).
These reservoirs are usually located downstream of areas with multiple land use, such as farmland and cities. In addition, in many of these rural and urban areas, raw effluent is released directly into the watercourses, resulting in an increased flow of water rich in nutrients
that reaches the reservoir (KARADŽI et al., 2010;
SOARESet al., 2009). Agricultural production, because
of the extensive use of fertilizers, mainly of phosphate and nitrogen compounds, also contributes to the supply of nutrients, especially through surface runoff
(CROSSETTI; BICUDO, 2008; DOMAGALSKIet al.,
2007; KRUPAet al., 2011).
The availability of nutrients such as phosphorus promotes the excessive growth of aquatic plants both floating and submerged, with a consequent imbalance in the ecosystem, and progressive degeneration of the quality of lentic bodies of water (WANG; WANG, 2009). The process of eutrophication of the water in reservoirs, especially when intended for multiple-usage, has often been studied by researchers in different parts of the globe (ALEXANDRE
et al., 2010; KAGALOUA; PAPASTERGIADOUB;
LEONARDOSA, 2008; KARADŽI et al., 2010; MATTAR
NETO; KRÜGER; DZIEDZIC, 2009).
The enrichment of bodies of water is associated with increased primary production and the occurrence of episodes of excessive development of algae or aquatic macrophytes, which may affect the use of the water for supply, for energy production, for recreation and for the protection of aquatic life
(FERREIRA, 2004; LACERDAet al., 2004). In reservoirs
with a slowed water velocity, prolonged presence and high nutrient concentration increase the tendency to eutrophication of the water bodies (SPERLING; FERREIRA; GOMES,
2008; ZENGet al., 2006).
The quality of the water in semi-arid tropical regions is greatly influenced by the high rate of evaporation (MEIRELES; FRISCHKORN; ANDRADE, 2007; SPERLING; FERREIRA; GOMES, 2008) and during the rainy season, may turn the reservoirs into veritable deposits of those chemicals carried by suspended sediments. The water stored in surface reservoirs undergoes changes in quality, either through physical processes (mainly evaporation, which consumes
around 30 to 40% of the stored water), chemical processes (reactions, dissolution and precipitation) and biological processes (growth, death and decomposition)
(SÁNCHEZ-CARRILLOet al., 2007).
Findings like these show the need for the monitoring of bodies of water where the areas with greater or lesser potential for degradation of those waters can be mapped. One possible alternative, to be used in identifying areas of reservoirs which are at risk of eutrophication, is the development of information schemes that, once overlapping, can generate maps (ANDRADE
et al., 2006) of those areas at risk of eutrophication, using
a GIS (Geographic Information System).
This study is aimed to investigate the spatial and seasonal water quality variability of a semi-arid tropical region reservoir, as regards its trophic state, also to identify the sources of nutrient input to the reservoir with the aid of a Geographic Information System (GIS).
MATERIALS AND METHODS
Description of study site
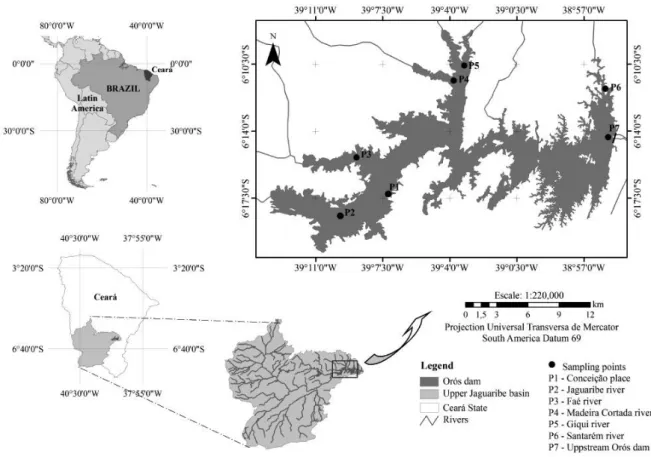
The research was carried out in the Orós reservoir (Figure 1), which dams the Jaguaribe river and is located between the coordinates, 6°8’31’’ S to 6°20’26’’ S and 38°54’56’’ W to 39°13’28’’ W. The total accumulation capacity of the reservoir is approximately 1.94 billion cubic meters. The water supplies year-round a population of approximately 500,000 people living in 20 cities located downstream, irrigation of the Middle and Lower Jaguaribe, fish farming, tourism, and also to complement the water supply of the state capital, which has a population of over 2 million people.
According to the Köppen classification, the climate zone of the region is BSw’h’, a very hot, semi-arid climate, with 88% of the annual rainfall being recorded in the period summer-autumn (January to April), and 65% in the months of March to April, showing a high rainfall concentrated in a short period of the year. In addition to this concentration, the region is characterized by many hours of sunshine and high evaporation rates (Table 1).
Nowadays, only 7.8% of the Permanent Preservation Area surrounding the Orós has natural vegetation, the other 92.2% having the following land uses: 42.4% for pasture, 24% for secondary vegetation formed by sparse grasses and shrubs, 2.1% for corn, 15.8%
for rice and 7.9% for other crops and uses (SOARESet al.,
Figure 1 - Basin of the Upper Jaguaribe and location of the Orós reservoir, Ceará
Table 1 - Climatological data of the area and average water temperature of the Orós dam in the dry and rainy seasons
SOURCE: FUNDAÇÃO CEARENSE DE METEOROLOGIA E RECURSOS HÍDRICOS, 2010
Season Precipitation Average wind speed Radiation Insolation Evaporation Water temperature
(mm) (m s-1) (kJ m-2 h-1) (h) (mm) (°C)
Rainy (January/April) 877 1.99 1548.91 1277.7 861 29.13
Dry (May/December) 117 3.04 1755.43 1570.3 1198 28.28
Sampling
Water samples were collected every two months during the period April, 2008 to April, 2010 at six points, corresponding to the principal tributaries of the reservoir, and at one further point located upstream of the dam (Figure 1). Samples were taken on the surface of the water, at a maximum depth of 0.30m, the limit of the photic zone. The attributes analyzed were total phosphorus, chlorophyll-a and transparency. The samples, conservation of the samples, and analysis of the studied attributes, followed the analytical methodology as described in Standard Methods. The analyses were carried out at the Residual Water Laboratory at the
Instituto Federal do Ceará, in Ceará State, Brazil. The sampling points were geo-referenced using GPS, with coordinates in UTM (SAD 69), zone 24S.
Procedures of analyses
To qualify the trophic state of the waters, the Trophic State Index, introduced by Carlson modified
by Toledo Júnior et al. (1984) was used. This index
was chosen as it had been adjusted for subtropical environmental conditions, and has therefore greater similarity to the region under study. The Mean Trophic State – TSI was then calculated. This is composed of the following sub-indices: the Trophic State Index for
transparency - TSIS, modified by Toledo Júnior et al.
(1984).
(1)
(2)
(3)
(4)
Where:
PT = concentration of total phosphorus, measured
at the water surface and expressed in mg m-3;
Cl-a = concentration of chlorophyll-a, measured at
the water surface and expressed in µg L-1;
S = transparency, measured by Secchi disk, expressed in m;
TSI = simple mean of the indices for total phosphorus, chlorophyll-a and transparency (Secchi disk).
For the classification of these indexes, the following trophic states were adopted: ultraoligotrophic, oligotrophic, mesotrophic, eutrophic and hypereutrophic, as shown in Table 2 (TOLEDO JÚNIOR, 1990). In the characterization and evaluation of the temporal and spatial variability of the risk of eutrophication, maps were made to delimit the influenced areas of total phosphorus, chlorophyll-a, transparency (Secchi disk) and the TSI for the wet and dry seasons.
Making use of geo-processing techniques, and with the average concentrations of total phosphorus and chlorophyll-a for the dry and rainy seasons, “grids of points” were generated for all parameters by the kriging interpolation method, using the SURFER 7.0 software.
Table 2 - Limits for different trophic state levels, according to the classification system proposed by Toledo Júnior (1990)
Trophic State Criteria Total Phosphorous (mg L-1) Chlorophyll-a (µg L-1) Transparency (m)
Ultraoligotrophic TSI 24 0.006 0.51 7.8
Oligotrophic 24 < TSI 44 0.007 – 0.026 0.52 – 3.81 7.7 – 2.0
Mesotrophic 44 < TSI 54 0.027 – 0.052 3.82 – 10.34 1.9 – 1.0
Eutrophic 54 < TSI 74 0.053 – 0.211 10.35 – 76.06 0.9 – 0.3
Hipertrophic TSI > 74 > 0.211 > 76.06 < 0.3
The maps of TSI, TSICL and TSIPT were developed from
Equations 1-4 respectively, in an interactive process with the ArcGIS 9.3 software, by using ArcToolbox, Analyst
Tools and Map Algebra (ANDRADEet al., 2006).
To evaluate temporal and spatial variability, the Student mean test “t” was carried out for the values of total phosphorus, chlorophyll, transparency and TSI, for the rainy season in relation to the dry season. The statistical program used was SPSS, version 16.0.
RESULTS AND DISCUSSION
The main problem in dealing with water-supply reservoirs, especially in semi-arid regions, is to provide a stable composition of the water where the processes of mineral dissolution and production of organic materials are acceptable for use amid the climatic conditions favorable to eutrophication (nutrient-rich sediments and abundant solar energy). The high intensity of solar radiation and high water temperatures (Table 1) accelerate the absorption of nutrients by the algae. The eutrophication process compromises the water quality, being reflected in the proliferation of algae, oxygen deficit, bad odors and the excessive growth of macrophytes (CORREIA; MIRANDA; GUIMARÃES,
2012; KARADŽI et al., 2010).
Phosphorus Contribution
It was possible to identify a seasonal character, together with the existence of different levels of total phosphorus intake to the Orós dam, the highest concentrations being recorded in the rainy season (COOK
et al., 2010; SÁNCHEZ-CARRILLOet al., 2007), and the
largest contributions from the Faé river (0.187 mg L-1) and
the Giqui stream (0.177 mg L-1), represented by points P3
and P5 respectively (Figure 2A).
These two rivers are intermittent, and drain areas used for agriculture and livestock farming (SOARES
et al., 2009), thereby contributing to increase the
In the rainy season, the phosphorus concentration is increased, not only by the supply of nutrients, but also by the thermal inversion observed for this period, which turns the hypolimnion anoxic, and makes the environment prone to the release of phosphates from the
sediment (DOMAGALSKI et al., 2007; CROSSETTI;
BICUDO, 2008). Whereas in the dry season, the oxygenation of the water mass by the action of strong winds (Table 1), and the maintaining of an oxidizing environment, inhibit the release of phosphates from the sediment and also promote its sedimentation by the presence of ferric ions (FERREIRA, 2004).
The sampling points P1 (the Conceição stream) and P2 (entry of the Jaguaribe river) displayed a mean concentration of phosphorus which was not significant at a level of 5% (Figure 2, Table 3). This similarity (p <0.05) can be explained by the low flow of the Jaguaribe river in the dry season, balanced by the input of sediments rich in total phosphorus during the rainy season. During the
dry season, when the river is at minimum flow, there is the injection of liquid waste (raw sewage) from the city of Iguatu (96,260 inhabitants), located 20 km upstream (INSTITUTO BRASILEIRO DE GEOGRAFIA E ESTATÍSTICA, 2010), as well as agricultural activities in lowland areas, with the use of fertilizers based on phosphorus compounds. Occurrences of eutrophication related to the intake of phosphorus in reservoirs in
semi-arid regions were identified by Domagalskiet al., (2007).
As for point P6, land-use on the edges of the dam, with crops (rice, beans and other) and cattle-grazing around the area, may contribute to the increase in phosphorus concentration. In addition to these activities, in a lake or the arm of a lake, which is shaped like a long funnel, although the phosphorus load is small for the lake as a whole, a tributary discharging nutrients into a small area would cause an increased concentration of the element at that place. It is noteworthy that the high rates of evaporation (Table 1) and zero flow of the stream
Figure 2 - Concentration of average total phosphorus (mg L-1) for the Orós Dam in the rainy season (A) and in the dry season (B)
Table 3 - Classification of the eutrophication of the Orós dam, Ceará, by Total Phosphorus
Sampling Points Rainy Season Dry Season
Total phosphorous (mg L-1) Trophic State Total phosphorous (mg L-1) Trophic State
P1 0.083 Aa Eutrophic 0.082 Aa Eutrophic
P2 0.092 Aa Eutrophic 0.093 Aa Eutrophic
P3 0.187 Aa Eutrophic 0.059 Aa Eutrophic
P4 0.082 Aa Eutrophic 0.057 Aa Eutrophic
P5 0.177 Aa Eutrophic 0.073 Aa Eutrophic
P6 0.074 Aa Eutrophic 0.129 Aa Eutrophic
P7 0.072 Aa Eutrophic 0.050 Aa Mesotrophic
Averages followed by the same upper-case latter for a line and lower-case letter for a column, show no difference for the Student “t” test (p < 0.05)
Figure 4 - Map of the spatial distribution of the average concentration of chlorophyll-a in g L-1 for the Orós Dam in the rainy season
(A) and the dry season (B)
and not by concentrations of total nitrogen (WANG, WANG, 2009).
Chlorophyll-a Contribution
Just as with the concentrations of total phosphorus, the average concentrations of chlorophyll-a varied in time and space (Figure 4), demonstrating the effect of the seasonal climate and land use. The highest average values of chlorophyll-a were recorded during the dry season. These results can be attributed to the fact that during that period there is no sediment input by drainage, consequently turbidity is reduced, enlarging the photic zone, and increasing algae and photosynthetic activity. The high temperatures and the intensity of incident radiation (Table 1), promote the development of the algae and consequently an increase in the concentration of chlorophyll-a. This effect of the proliferation of algae, due to high water temperatures and the constant input of nutrients both from point and diffuse sources, was also verified by Sperling, Ferreira and Gomes (2008) in a reservoir located in northeastern Brazil.
(intermittent courses) during the dry season, contribute to the highest concentrations of phosphorus, with the consequent increased risk of eutrophication of the body of
water (SÁNCHEZ-CARRILLOet al., 2007).
The sampling points P4 (the Madeira Cortada stream) and P5 (the Giqui stream), both in the rainy and dry seasons (Figure 4, Table 4) were classified as eutrophic. The high values found are justified by the excessive use of the land without the adoption of conservation practices in their area of contribution, fact proven by field observations as shown in Figure 3 (explored with agriculture and livestock). Another factor that may have influenced the spatial variability of concentrations of chlorophyll-a, is the time of sampling at these points, which occurred around noon. Due to the size of the
dam’s hydraulic basin (190.57 km2) taking the samples
at different times is unavoidable. Chlorophyll-a is closely related to the incidence of solar radiation, with the highest production and concentrations occurring around noon, due to the greater availability of solar
energy (LACERDAet al., 2004).
Most of the waters of the reservoir (Table 4) showed a trophic state index for chlorophyll, of from mesotrophic (average concentration) to eutrophic (high
concentration) during both seasons. It can be seen that although the differences in concentrations of chlorophyll-a between the points shows stchlorophyll-atisticchlorophyll-al significchlorophyll-ance chlorophyll-at a level of 5%, concentrations between seasons did not differ, demonstrating greater spatial than temporal dynamics. This fact is explained by the dissimilarity of water quality tributaries of the reservoir. The evaluation corresponding to chlorophyll-a, on the other hand, should be considered as a measure of the response of the body of water to the causative agent, adequately showing the level of growth of algae present in its waters.
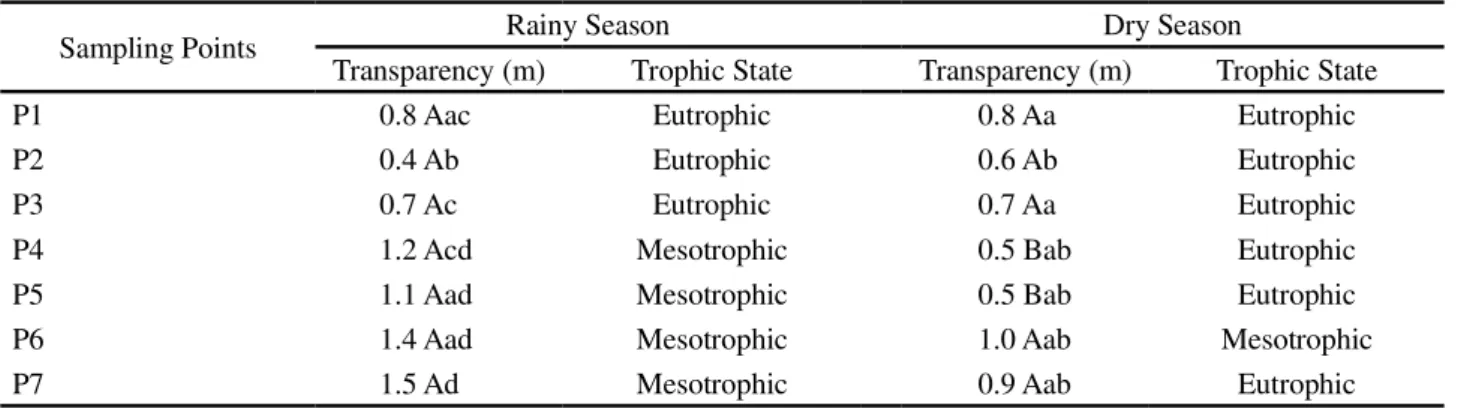
Photic Zone
The adoption of transparency (Figure 5 and Table 5), assessed by using a Secchi Disk, as an indicator of trophic status is associated with studies that correlate the increase in phytoplankton density with the decrease in light penetration through a process of shading. At sampling points P1, P2 and P3 the lowest values for transparency were recorded. The low level of light penetration seen at
Table 4 -Classification of the eutrophication of the Orós dam, Ceará, by Chlorophyll-a
Averages followed by the same upper-case latter for a line and lower-case letter for a column, show no difference for the Student “t” test (p < 0.05)
Sampling Points Rainy Season Dry Season
Chlorophyll-a (µg L-1) Trophic State Chlorophyll-a (µg L-1) Trophic State
P1 5.2 Aa Mesotrophic 6.6 Aa Mesotrophic
P2 7.9 Aab Mesotrophic 3.8 Aa Oligotrophic
P3 8.5 Aab Mesotrophic 10.3 Aab Mesotrophic
P4 17.4 Aab Eutrophic 18.8 Aab Eutrophic
P5 16.9 Aab Eutrophic 26.5 Ab Eutrophic
P6 16.5 Ab Eutrophic 9.0 Ab Mesotrophic
P7 19.3 Ab Eutrophic 9.4 Ab Mesotrophic
Figure 5 - Map of the spatial distribution of average transparency (Secchi disc) in meters for the Oros Dam in the rainy season
Table 5 -Classification of the eutrophication of the Orós reservoir, Ceará, by Transparency (Secchi disk)
Averages followed by the same upper-case latter for a line and lower-case letter for a column, show no difference for the Student “t” test (p < 0.05)
Sampling Points Rainy Season Dry Season
Transparency (m) Trophic State Transparency (m) Trophic State
P1 0.8 Aac Eutrophic 0.8 Aa Eutrophic
P2 0.4 Ab Eutrophic 0.6 Ab Eutrophic
P3 0.7 Ac Eutrophic 0.7 Aa Eutrophic
P4 1.2 Acd Mesotrophic 0.5 Bab Eutrophic
P5 1.1 Aad Mesotrophic 0.5 Bab Eutrophic
P6 1.4 Aad Mesotrophic 1.0 Aab Mesotrophic
P7 1.5 Ad Mesotrophic 0.9 Aab Eutrophic
Figure 6 - Map of the spatial distribution of the trophic state index - TSI for the Orós Dam in the rainy season (A) and the dry season (B)
these three points is a function of water-mixing processes which are aided by the winds in the region (Table 1), and the depth at the points analysed, which causes a susceptibility to re-suspension of the material (organic and inorganic) deposited on the substrate at the deeper
layers of the environments (BARBOSAet al., 2006). This
reduction in the photic zone may be the main limitation to phytoplankton productivity at those points. Although for the phosphorus and Secchi-disk indices, the waters were found to be in a eutrophic state, for the concentrations of chlorophyll-a, the points P1, P2 and P3 were classified as mesotrophic, indicating that there is some limiting factor which reduces the productivity of the algae.
The highest values for transparency were observed at points P6 and P7 (Table 5), which are closest to the dam and receive contributions from waters with greater sedimentation, accordingly transparency is now defined by the mass of phytoplankton. From this table it can be seen that the spatial variability of transparency during the rainy season was significant (p <0.05), which is explained by the different nutrient inputs from the
tributaries. The non-significant difference during the dry season is a result of the low additional discharges into the reservoir, since with the exception of the Jaguaribe river (artificially perennial), the other tributaries have zero discharge during the dry season.
Trophic State Index -TSI
The seasonal spatial distribution of the Trophic State Index -TSI (Figure 6) allows a somewhat rough limnological assessment of the level of nutritional enrichment of a body of water, covering three parameters (chlorophyll-a, total phosphorus and transparency). Unlike the original concept, in which eutrophication is gradual and inexorable, this is a dynamic index, meaning that lakes may present different classifications over time, for those classes in both a higher or lower trophic state (CROSSETTI; BICUDO, 2008).
P5. During the rainy season these points are supplied with the runoff from agricultural fields and livestock farming, whereas in the dry season the margins of the reservoirs show a large amount of exposed soil and intensive livestock-farming activity (Figure 3), besides various other agricultural activities such as the growing of rice. Therefore, the trophic level at these points is mainly influenced by the use and occupation of the land (KAGALOUA; PAPASTERGIADOUB; LEONARDOSA, 2008).
Using the values of the mean TSI and trophic state (Table 6) it is possible to see that throughout the whole period, and at all sampling points, the reservoir showed a trophic state index classified as eutrophic (high nutrient concentration). Further, from that same table, it can be seen that there was no significant difference across the seasons, but in the dry season it was identified a statistical difference among samples at a level of 5%. These results reinforce the concern about the useful life of the reservoir as regards human consumption and other uses, stressing the need for public policies to mitigate the effects of the sources of pollution. Another worrying fact is that the reservoir reached its maximum bleeding quota for several months during the first two years of the study, renewing part of its water, and should therefore show a tendency for water of a higher quality, which was not seen (high trophic state index, classified as eutrophic).
Similar results were obtained by Karadži et al., (2010)
studying two water-supply reservoirs in Serbia, in which a TSI ranging from mesotrophic to eutrophic.
CONCLUSION
The deterioration of water quality expresses the need for intervention intended to reduce the release of waste, and thereby improve the trophic state of the Orós dam. The major sources of nutrients for the eutrophication
process come from agricultural land and livestock farming. The mapping or zoning of the trophic state index of the dam with GIS support has shown itself to be an important tool in the interpretation of the risk of eutrophication, and the identification of the main entry points of contaminants into the reservoir. The total phosphorus, despite showing variability, was not statistically significant at a level of 5%, and except for points P1, P2 and P6, there was an increase in the average concentration of phosphorus during the rainy season. The highest concentrations of chlorophyll-a were found during the dry season. The reservoir presented as eutrophic with regards to mean TSI, at all points sampled throughout the period studied.
ACKNOWLEDGEMENTS
The authors thank CNPq and CAPES for the financial support given to this research, and for the graduate-student grant given to the first author.
REFERENCES
ANDRADE, E. M.et al. Mapa de vulnerabilidade da bacia do Acaraú, Ceará, à qualidade das águas de irrigação, pelo emprego do GIS.Revista Ciência Agronômica,v. 37, n. 3, p. 279-286, 2006.
ALEXANDRE, D. M. B.et al. The water quality investigation using GIS and multivariable analysis in a semiarid region reservoir.Revista Ciência Agronômica, v. 41, n. 4, p. 554-561, 2010.
BARBOSA, J. E. L. et al. Diagnóstico de estado trófico e aspectos limnológicos de sistema aquáticos da Bacia hidrográfica do rio Taperoá, Trópico semi-árido Brasileiro.
Revista de Biologia e Ciências da Terra, v. 1, n. 1, p. 81-89, 2006.
Table 6- Classification of the eutrophication of the Orós dam, Ceará, by TSI
Averages followed by the same upper-case latter for a line and lower-case letter for a column, show no difference for the Student “t” test (p < 0.05)
Sampling Points Rainy Season Dry Season
TSI Trophic State TSI Trophic State
P1 58.583 Aa Eutrophic 59.014 Aa Eutrophic
P2 61.713 Aa Eutrophic 59.681 Aa Eutrophic
P3 62.168 Aa Eutrophic 58.277 Aa Eutrophic
P4 58.891 Aa Eutrophic 62.824 Aab Eutrophic
P5 62.463 Aa Eutrophic 64.264 Ab Eutrophic
P6 59.247 Aa Eutrophic 59.672 Aab Eutrophic
COOK, P. L. M. et al. Retention of nitrogen, phosphorus and silicon in a large semi-arid riverine lake system.Biogeochemistry,
v. 99, n. 1/3, p. 49-63, 2010.
CORREIA, R. R. S.; MIRANDA, M. R.; GUIMARÃES, J. R. D. Mercury methylation and the microbial consortium in periphyton of tropical macrophytes: effect of different inhibitors.
Environmental Research, v. 112, p. 86-91, 2012.
CROSSETTI, L. O.; BICUDO, C. E. M. Phytoplankton as a monitoring tool in a tropical urban shallow reservoir (Garças Pond): the assemblage index application. Hydrobiologia,
v. 610, p. 161-173, 2008.
DOMAGALSKI, J. et al. Eutrophication study at the Panjiakou-Daheiting Reservoir system, northern Hebei Province, People’s Republic of China: Chlorophyll-a model and sources of phosphorus and nitrogen. Agricultural Water Management, v. 94, p. 43–53, 2007.
FERREIRA, A. C. S. Persistente floração da cianobactéria Planktothrix agardhii (Gomont) Anagnostidis & Komárek no açude Gavião, Pacatuba/CE, e suas implicações para o abastecimento da cidade de Fortaleza. In: SIMPÓSIO LUSO BRASILEIRO DE ENGENHARIA SANITÁRIA E AMBIENTAL, 11., 2004, Natal.Anais...Natal: ABES, 2004.
FUNDAÇÃO CEARENSE DE METEOROLOGIA E RECURSOS HÍDRICOS. Séries pluviométricas do Ceará (1974 – 2008). 2010. Disponível em: <http://www.funceme.
br/>. Acesso em: 20 set. 2010.
INSTITUTO BRASILEIRO DE GEOGRAFIA E ESTATÍSTICA.
Fundação Instituto Brasileiro de Geografia e Estatística. 2010. Disponivel em: <http://www.ibge.gov.br/home/ estatística/ população/senso2007/principal.shtm>. Acesso em:19 ago. 2010. KAGALOUA, I.; PAPASTERGIADOUB, E.; LEONARDOSA, I. Long term changes in the eutrophication process in a shallow Mediterranean lake ecosystem of W. Greece: Response after the reduction of external load. Journal of Environmental Management, v. 87, n. 3, p. 497-506, 2008.
KARADŽI , V. et al. Phytoplankton and eutrophication development in the water supply reservoirs Garaši and Bukulja (Serbia).Desalination, v. 255, n. 1/3, p. 91-96, 2010.
KRUPA, M. et al. Water quality in rice-growing watersheds in a mediterranean climate. Agriculture, Ecosystems & Environment, v. 144, n. 1, p. 290-301. 2011.
LACERDA, S. R. et al. Phytoplankton nyctemeral variation at a tropical river estuary (Itamaracá - Pernambuco - Brazil).
Brazilian Journal Biology, v. 64, n. 1, p. 81-94, 2004. MATTAR NETO J.; KRÜGER C.M.; DZIEDZIC M. Análise de indicadores ambientais no reservatório do Passaúna.Engenharia Sanitária Ambiental, v. 14, n. 2, p. 205-214, 2009.
MEIRELES. A. C. M.; FRISCHKORN, H.; ANDRADE, E. M. Sazonalidade da qualidade das águas do açude Edson Queiroz, bacia do Acaraú, no Semi-Árido cearense. Revista Ciência Agronômica, v. 38, n. 1, p. 25-31, 2007.
SÁNCHEZ-CARRILLO, S. et al. Eutrophication and Sedimentation Patterns in Complete Exploitation of Water Resources Scenarios: An Example from Northwestern Semi-arid Mexico.Environmental Monitoring and Assessment,
v. 132, n. 1/3, p. 377-393, 2007.
SOARES, Z. M. L.et al. Uso e ocupação da terra nas áreas de entorno do açude Orós com vistas ao ordenamento territorial.In: SIMPÓSIO BRASILEIRO DE SENSORIAMENTO REMOTO, 14., 2009. Natal.Anais... Natal: INPE, 2009. p. 4417-4424. SPERLING, E. V.; FERREIRA, A. C. S.; GOMES, L. N. L. Comparative eutrophication development in two Brazilian water supply reservoirs with respect to nutrient concentrations and bacteria growth. Desalination, v. 226, n. 1/3, p. 169-174, 2008. TOLEDO JÚNIOR, A. P. Informe preliminar sobre os estudos para a obtenção de um índice para a avaliação do estado trófico de reservatórios de regiões quentes tropicais. São Paulo: Companhia de Tecnologia de Saneamento Ambiental, 1990. 12 p.
TOLEDO JÚNIOR, A. P. et al. A aplicação de modelos simplificados para a avaliação de processo da eutrofização em lagos e reservatórios tropicais. In: CONGRESSO INTERAMERICANO DE ENGENHARIA SANITÁRIA AMBIENTAL, 19., 1984. Santiago do Chile.Anais.. . Santiago: AIDIS, 1984. p. 56.
WANG, H.; WANG, H. Mitigation of lake eutrophication: Loosen nitrogen control and focus on phosphorus abatement.