! " # $ %
&'' ( ) * $ $ % ! $
+ ,- . ) ' / '& ' &
Complexo enzimático e “Saccharomyces cerevisiae” em dietas para frangos de corte na fase inicial
SOUSA, Regina Fialho de1*; DOURADO, Leilane Rocha Barros1; SANTOS, Edna Teles dos1; BIAGIOTTI, Daniel1; FARIAS, Leonardo Atta1;ALBUQUERQUE, Francisca das Chagas Fontenele de1; CARVALHO,Maria Letícia Araújo Marques de1;
FERREIRA, Guilherme José Bolzani de Campos1; LOPES, João Batista2
1
Universidade Federal do Piauí, Campus Professora Cinobelina Elvas, Departamento de Zootecnia, Bom Jesus, Piauí, Brasil
2
Universidade Federal do Piauí, Campus Universitário Ministro Petrônio Portella, Centro de Ciência Animal, Teresina, Piauí, Brasil
*Endereço para correspondente: regina>so>[email protected]
011 2
This study aimed at evaluating the use of exogenous enzymes in diets withSaccharomyces cerevisiae and their impact on zootechnical performance, carcass yield, intestinal histomorphometry and of broiler diets in the initial phase. A completely randomized design was used in a 2x3 + 1 factorial arrangement, with two levels of enzyme complex (EC), (0 and 200g / ton), three yeast levels (0, 6 and 12%) and a control diet, making up seven treatments, with five replicates of 20 broilers per experimental unit. We evaluated the performance (feed intake, weight gain and feed conversion ratio), carcass yield and cuts, histomorphometry of the small intestine (height, circumference and width of villi, height and width of the crypt, thickness of the intestinal muscle wall and villi/crypt relationship). From 1 to 7 and 1 to 21 days, the inclusion of yeast led to reduced broiler performance. At 21 days, the addition of EC resulted in an increase of (p <0.05) in the thickness of the muscular wall of the duodenum and decreased the width of the crypt in the ileum. The 12% level of yeast without the EC provided a thicker jejunum intestinal muscle wall when compared to the positive control. There was no significant effect on carcass yield and cuts between treatments. In conclusion, the inclusion of yeast reduces performance from 1>21 days. The enzyme
complex and yeast does not change the
performance or carcass yield, however, it does bring benefits to the intestinal mucosa.
3 -4 : glucanase, mannanase, yeast, villus
+ 015
Objetivou>se avaliar o uso de enzimas exógenas em dietas comSaccharomyces cerevisiaesobre o desempenho zootécnico, rendimento de carcaça e histomorfometria intestinal de frangos de corte na fase inicial. Utilizou>se o delineamento inteiramente casualizado em esquema fatorial 2x3+1, sendo dois níveis de complexo enzimático (CE), (0 e 200g/ton), três níveis de levedura (0, 6 e 12%) e uma dieta controle, perfazendo sete tratamentos, cinco repetições de 20 aves por unidade experimental. Foram avaliados o desempenho (consumo de ração, ganho de peso e conversão alimentar), rendimento de carcaça e cortes e a histomorfometria do intestino delgado (altura, perímetro e largura de vilo, altura e largura de cripta, espessura da parede muscular intestinal e relação vilo/cripta). Na fase de 1 a 7 e de 1 a 21 dias, a inclusão de levedura na dieta promoveu redução no desempenho dos frangos. Aos 21 dias a adição de CE resultou em aumento (p<0,05) da espessura da parede muscular do duodeno, e reduziu a largura da cripta no íleo. O nível de 12% de levedura sem o CE proporcionou parede muscular intestinal do jejuno mais espessa quando comparada ao controle positivo. Não houve efeito significativo para rendimento de carcaça e cortes entre os tratamentos. Conclui>se que, a inclusão de levedura reduz o desempenho de 1 a 21 dias. A adição de complexo enzimático e levedura em dietas para frangos de corte não melhora o desempenho e rendimento de carcaça, todavia, beneficia à mucosa intestinal.
"#6 57086"5#
Sugarcane yeast and protein feed have been studied by researchers in the search for a substitute to soybean meal in poultry feed (FREITAS et al., 2013), as this is a product that is widely available on the market through its link to the processes of ethanol production (LOPES et al., 2011). The interest in this ingredient concerning animal feed is founded principally on its high rate of protein, at around 37.20% of crude protein, however, only 21.58% of this is digestible (ROSTAGNO et al., 2011). This low digestibility of whole yeast in broilers is related to physiological limitations in broilers, as they do not have the necessary enzymatic apparatus capable of breaking down the cellular wall composed of non>starch polysaccharides (NSPs) such as glucans and mannans, and as such they are not capable of benefitting fully from the potential nutrition in yeast (FLEURI & SATO, 2007).
In animal nutrition, the use of exogenous enzymes have shown satisfactory results, mainly through their allowing for the use of alternative feeds with greater efficiency (BARBOSA et al., 2014). The collaborators Fleuri & Sato (2007) observed by means of studiesin vitrothat the use of the enzyme β>glucanase, associated or not with other enzymes, are capable of breaking down the cellular wall of yeast.
The use of exogenous enzymes has already been widely researched in terms of improving digestibility of feeds with a high rate of non>starch polysaccharides. The benefits of supplementing with polysaccharides in diets with high rates of NSPs reported in the literature refer to the capacity of partially hydrolyzing these compounds, along with reducing the viscosity of intestinal contents (WANG et al., 2005). In addition, this can improve the use of other nutrients present in the
diet, such as protein through the disruption of the cell wall by means of rupture of the cell, thus resulting in nutrient absorption improvements, as well as performance (ESMAEILIPOUR et al., 2011).
Even with all the benefits that these technological advances bring, they are used more in cereals, such as rye, barley, wheat, oats and rice (TACHIBANA et al., 2010). However, reports in the literature are scarce concerning the combined use of yeast and exogenous enzymes in poultry diets.
The objective behind this study was to evaluate the use of exogenous enzymes in diets with Saccharomyces cerevisiae, on the zootechnical performance, carcass yield and intestinal histomorphometry of broilers in the initial phase.
1 6+ " 9 #7 1+6:57
! " # $ %
&'' ( ) * $ $ % ! $
The treatment procedures used were: TP1>feed reference based on corn and soya (PC); TP2>feed reference based on corn and soya with a 70 kcal reduction of metabolizable energy from the diet (NC) with 0% yeast without enzymatic complex; TP3>NC + 6% yeast without enzymatic complex; TP4>NC +12% yeast without enzymatic complex; TP5>NC
+0% of yeast with enzymatic complex; TP6>NC +6% of yeast with enzymatic complex; TP7>NC+ 12% of yeast with enzymatic complex.
The diets (Tables 1 and 2) were formulated by means of nutritional requirement adjustments recommended by Rostagno et al. (2011) and the lineage manual Ross 308®.
Table 1. Composition of experimental diets for broilers in the 1 to 7>day old phase
Ingredient PC NC (0%) NC + YEAST (%)
6% 12% 0%+CE 6%+EC 12%+EC
Corn 52.388 54.003 51.981 49.965 54.003 51.981 49.965
Soybean meal 38.460 38.162 33.963 29.763 38.162 33.963 29.763
Soybean oil 3.354 2.013 2.167 2.319 2.013 2.167 2.319
Phosphate bic. 1.969 1.967 1.938 1.908 1.967 1.938 1.908
Lime 1.171 1.173 1.175 1.176 1.173 1.175 1.176
NaCl 0.458 0.457 0.430 0.403 0.457 0.430 0.403
L>lysine HCl 79% 0.216 0.222 0.204 0.187 0.222 0.204 0.187
DL>methionine 0.352 0.351 0.379 0.407 0.351 0.379 0.407
L>threonine 0.079 0.080 0.089 0.098 0.080 0.089 0.098
L>valine 0.151 0.152 0.167 0.182 0.152 0.167 0.182
L>arginine 0.000 0.000 0.077 0.147 0.000 0.077 0.147
L>tryptophan 0.000 0.000 0.011 0.021 0.000 0.011 0.021
Suppl. Vita. Min1 0.400 0.400 0.400 0.400 0.400 0.400 0.400
Inert2 1.000 1.020 1.020 1.020 1000 1.000 1.000
Yeast > > 6.000 12.000 > 6.000 12.000
CE3 > > > > 0.020 0.020 0.020
Total 100.00 100.00 100.00 10,.00 100.00 100.00 100.00
Calculated composition
PB (%) 22.500 22.500 22.500 22.500 22.500 22.500 22.500
EM (kcal/kg) 3000 2930 2930 2930 2930 2930 2930
Ca (%) 1.050 1.050 1.050 1.050 1.050 1.050 1.050
P disp. (%) 0.500 0.500 0.500 0.500 0.500 0.500 0.500
Lysine dig. (%) 1.270 1.270 1.270 1.270 1.270 1.270 1270
Meth. dig. (%) 0.637 0.637 0.660 0.682 0.637 0.660 0.682
Meth+cist. dig. (%) 0.940 0.940 0.940 0.940 0.940 0.940 0.940
Threonine dig.(%) 0.830 0.830 0.830 0.830 0.830 0.830 0.830
Tryptophan dig. (%) 0.249 0.249 0.249 0.249 0.249 0.249 0.249
Arginine dig. (%) 1.418 1.414 1.418 1.418 1.414 1.418 1.418
Valine dig. (%) 1.090 1.090 1.090 1.090 1.090 1.090 1.090
Phenylalanine dig. (%) 1.034 1.032 0.983 0.934 1.032 0.983 0.934
Isoleucine dig. (%) 0.876 0.874 0.850 0.826 0.874 0.850 0.826
Sodium (%) 0.200 0.200 0.200 0.200 0.200 0.200 0.200
Crude Fiber (%) 2.945 2.957 2.729 2.502 2.957 2.729 2.502
1
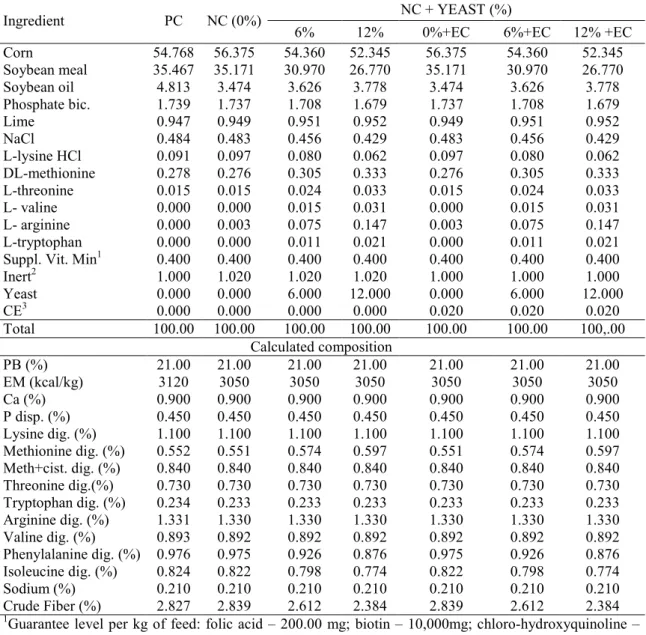
Table 2. Composition of the experimental diets for broilers in the 8 to 21>day old phase
Ingredient PC NC (0%) NC + YEAST (%)
6% 12% 0%+EC 6%+EC 12% +EC
Corn 54.768 56.375 54.360 52.345 56.375 54.360 52.345
Soybean meal 35.467 35.171 30.970 26.770 35.171 30.970 26.770
Soybean oil 4.813 3.474 3.626 3.778 3.474 3.626 3.778
Phosphate bic. 1.739 1.737 1.708 1.679 1.737 1.708 1.679
Lime 0.947 0.949 0.951 0.952 0.949 0.951 0.952
NaCl 0.484 0.483 0.456 0.429 0.483 0.456 0.429
L>lysine HCl 0.091 0.097 0.080 0.062 0.097 0.080 0.062
DL>methionine 0.278 0.276 0.305 0.333 0.276 0.305 0.333
L>threonine 0.015 0.015 0.024 0.033 0.015 0.024 0.033
L> valine 0.000 0.000 0.015 0.031 0.000 0.015 0.031
L> arginine 0.000 0.003 0.075 0.147 0.003 0.075 0.147
L>tryptophan 0.000 0.000 0.011 0.021 0.000 0.011 0.021
Suppl. Vit. Min1 0.400 0.400 0.400 0.400 0.400 0.400 0.400
Inert2 1.000 1.020 1.020 1.020 1.000 1.000 1.000
Yeast 0.000 0.000 6.000 12.000 0.000 6.000 12.000
CE3 0.000 0.000 0.000 0.000 0.020 0.020 0.020
Total 100.00 100.00 100.00 100.00 100.00 100.00 100,.00
Calculated composition
PB (%) 21.00 21.00 21.00 21.00 21.00 21.00 21.00
EM (kcal/kg) 3120 3050 3050 3050 3050 3050 3050
Ca (%) 0.900 0.900 0.900 0.900 0.900 0.900 0.900
P disp. (%) 0.450 0.450 0.450 0.450 0.450 0.450 0.450
Lysine dig. (%) 1.100 1.100 1.100 1.100 1.100 1.100 1.100
Methionine dig. (%) 0.552 0.551 0.574 0.597 0.551 0.574 0.597
Meth+cist. dig. (%) 0.840 0.840 0.840 0.840 0.840 0.840 0.840
Threonine dig.(%) 0.730 0.730 0.730 0.730 0.730 0.730 0.730
Tryptophan dig. (%) 0.234 0.233 0.233 0.233 0.233 0.233 0.233
Arginine dig. (%) 1.331 1.330 1.330 1.330 1.330 1.330 1.330
Valine dig. (%) 0.893 0.892 0.892 0.892 0.892 0.892 0.892
Phenylalanine dig. (%) 0.976 0.975 0.926 0.876 0.975 0.926 0.876
Isoleucine dig. (%) 0.824 0.822 0.798 0.774 0.822 0.798 0.774
Sodium (%) 0.210 0.210 0.210 0.210 0.210 0.210 0.210
Crude Fiber (%) 2.827 2.839 2.612 2.384 2.839 2.612 2.384
1
Guarantee level per kg of feed: folic acid – 200.00 mg; biotin – 10,000mg; chloro>hydroxyquinoline – 7500.00 mg; vitamin A – 1680000.00 UI; vitamin B1 – 436.50 mg; vitamin B12 – 2400.00 mcg; vitamin B2 – 1200.00 mg; vitamin B6 – 624,00 mg; vitamin D3 – 400000.00 UI; vitamin E – 3500.00 mg ; vitamin K 3 – 360.00 mg; niacin – 8400.00 mg; monensin sodium – 25000.00 mg; pantothenic acid – 3119.00 mg; choline chloride – 80.710 mg; selenium >75.00 mg; iron sulphate 11.250 mg; manganese monoxide – 18740.00 mg; copper sulphate – 1996.00 mg; iodine – 187.47mg; zinc – 17500.00 mg;2inert washed sand;3EC>enzymatic complex(α galactosidase, galactomannan, xylanase and β glucanase).
The enzymatic complex was composed of
α galactosidase, galactomannan, xylanase and β glucanase, which was added to the feed at a rate of 200g/ton. On the first day of the experiment, the animals (male chicks from the Ross lineage) were weighed and distributed uniformly in pens, with the floor covered with rice husk, equipped with a pendulum
water dispenser and tubular feeder with water and feed ad libitum, under a regime of 24 hours of light (natural + artificial), with management undertaken as set out in the manual for this lineage.
&'' ( ) * $ $
euthanasia was performed on per group for the collecting intestine for future histom evaluation. From these, seg collected at 2.0 cm in leng small intestine (duodenum, j ileum, ten centimeters from t diverticulum). After the col fragments were opened lon washed in distilled water, exte serous tunic and fixed in Bo for 24 hours, then these w under running water for 12 maintained in alcohol 50° Gl 2003).
Posteriorly, the samples wer to standard histological proc their inclusion in Histopar® Erviegas Ltda.) and posterior thickness 4`m in a semi>auto microtome (Leica® – RM224 were stained with hematoxyli (HU et al. 2012; SOUSA et al assemblage was carried
Figure 1. Photomicrography Thickness of the Crypt Depth; V Perimeter. Staining
In order to evaluate the ca two boilers were used in with the average weigh experimental unit, these wer and fasted for 8 hours. After they were weighed to obtain
!
$ % ! $
ed on one animal cting of the small istomorphometric e, segments were length from the num, jejunum and from the Meckel's he collection, the longitudinally, er, extended by the in Bouin solution ese were washed for 12 hours and 0° Gl (BEHMER,
es were submitted l processing with
®
(Easypath > sterior section at a automatic rotary M2245), the cuts atoxylin and eosin et al., 2015), the rried out using
colorless stained>glass (Acrilex®) (PAIVA et al., 2 The morphometric ana histological cuts were pe the Trinocular optical mic Optical Systems), coupled camera TOUPCAM™ (5 M order to perform the mea software ToupView® 3.7 variables measured we height, and breadth of th and width of the crypt an muscle layer of the inte order to obtain these mea best cut was selected fro where 10 villi, 10 crypts were measured.
The measurements were following manner: villi (V until its apex; crypts perpendicular diameters measured villus; thicknes wall muscle (IM) from the the serosa (Figure 1).
raphy showing how the variables were measure f the Intestinal Wall Muscle Layer; CW – Crypt VW – Villus Width; VH – Villus Height; taining HE.
the carcass yield, d in accordance ght of the se were identified After this period, obtain the fasting
weight, then they wer bleed, plucked and gut removal of the feet, neck cleaned carcass was weig the cuts were weighed s carcass yield was determ
" # $ %
varnish 500 et al., 2006).
analyses of the ere performed using al microscope (Nova oupled with a digital 5 Megapixels). In measurements, the 3.7 was used. The d were: perimeter, of the villus, depth rypt and thickness of e intestinal wall. In se measurements, the ted from each slide, crypts and 10 walls
were taken in the (V), from the base crypts (C), largest eters closest to the ickness of intestinal om the blade itself to
easured, with: IM – Crypt Width; CD – eight; VP – Villus
the relationship between the weight of the eviscerated carcass without feet, head or neck and the live weight of the broilers in fasting at the time of slaughter. The main cuts, breasts, thighs and drumsticks, and wings were weighed and their yields calculated in relation to weight of the eviscerated carcass.
The performance data, carcass yield and histomorphometry were submitted to variation analysis through the GLM procedure of the SAS (Statistical Analysis System, 9.0). The Dunnett test (α=0.05) was used to check for significant differences between the positive control treatment and the yeast
factors and enzymatic complex. Estimations for the yeast level were established by means of linear and polynomial regression models. The means were compared through the SNK test with α=0.05.
+ 096 #7 7" 80 "5#
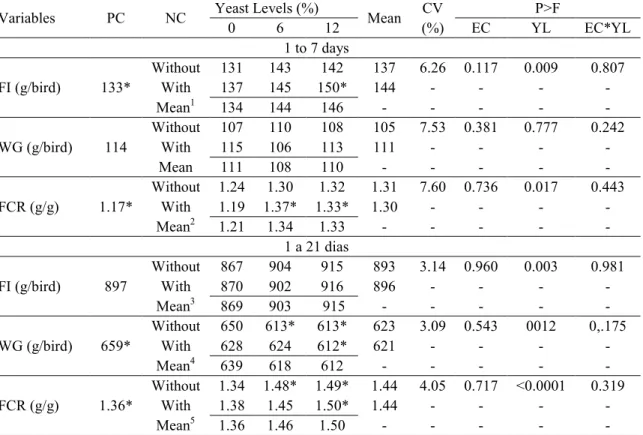
No interaction was observed between the enzymatic complex (EC) and the yeast levels (YL), for the variables Feed Intake (FI), weight gain (WG) and feed conversion ratio (FCR) during the 1 to 7> day old phase of the broilers (Table 3).
Table 3. Effect of the yeast levels from sugarcane (Saccharomyces cerevisiae) with or without the addition of the enzymatic complex concerning the feed intake (FI) weight gain (WG) and feed conversion ratio (FCR) of broilers during the 1 to7 and 1 to 21>day old phases
Variables PC NC Yeast Levels (%) Mean CV P>F
0 6 12 (%) EC YL EC*YL
1 to 7 days
FI (g/bird) 133*
Without 131 143 142 137 6.26 0.117 0.009 0.807
With 137 145 150* 144 > > > >
Mean1 134 144 146 > > > > >
WG (g/bird) 114
Without 107 110 108 105 7.53 0.381 0.777 0.242
With 115 106 113 111 > > > >
Mean 111 108 110 > > > > >
FCR (g/g) 1.17*
Without 1.24 1.30 1.32 1.31 7.60 0.736 0.017 0.443
With 1.19 1.37* 1.33* 1.30 > > > >
Mean2 1.21 1.34 1.33 > > > > >
1 a 21 dias
FI (g/bird) 897
Without 867 904 915 893 3.14 0.960 0.003 0.981
With 870 902 916 896 > > > >
Mean3 869 903 915 > > > > >
WG (g/bird) 659*
Without 650 613* 613* 623 3.09 0.543 0012 0,.175
With 628 624 612* 621 > > > >
Mean4 639 618 612 > > > > >
FCR (g/g) 1.36*
Without 1.34 1.48* 1.49* 1.44 4.05 0.717 <0.0001 0.319
With 1.38 1.45 1.50* 1.44 > > > >
Mean5 1.36 1.46 1.50 > > > > >
*Positive control mean differs in the Dunnett test (p<0,05).
! " # $ %
&'' ( ) * $ $ % ! $
Feed intake and feed conversion ratio (p<0.05) were influenced by the level of yeast inclusion to the diet. In this case, when there were effects from yeast levels, division was performed by means of polynomial regression (Table 4). There was an increase (p<0.05) in feed intake (FI=135.13 + 1.036YL, F2=0.87) and in feed conversion ratio (FCR=1.235+0.009YL, F2=0.69) at the rate the levels of yeast increased in the diet. The increased intake of higher levels of yeast, can be attributed to the higher demand of nutrients and energy, while considering the rigidity and low digestibility of its cell wall (FREITAS et al., 2013), as the broilers did not obtain an increase in weight gain. According to Perdomo et al. (2004), the low utilization of the yeast cell wall by the animals reduces digestibility of the nutrients from the feed, and consequently its energetic value. If one considers that energy is the main factor that controls feed intake in broilers (FREITAS et al., 2013), and that there was a reduction in the energetic density of the diets (NC), this influence on feed intake was boosted, as the animals need to find more feed to attend to their energy needs, due to the low energy extraction from the feed.
The comparison between the feed intake and feed conversion ratio data from the
positive control, regarding the negative control at 12% yeast, reinforces this statement. Noteworthy here is that broilers fed with a negative control and 12% yeast with enzymatic complex present a higher feed intake (p<0.05). The negative control diet with 6% and 12% yeast with enzymes demonstrated higher feed conversion ratios at seven days, when compared to broilers fed with positive control. The addition of the enzymatic complex had no influence over the performance variables in the 1 to 7>day phase.
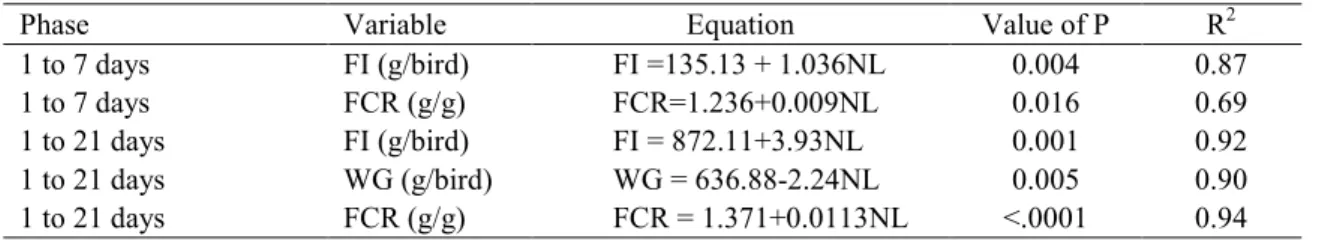
Over the total phase (1 to 21 days), there was no interaction observed between yeast levels, and the enzymatic complex in the diets for feed intake, weight gain and feed conversion ratio (Table 3). The yeast levels of (0, 6 and 12%) increased (p<0.05) the feed intake and feed conversion ratio, in addition to reduced weight gain. There was an increasing linear effect (p<0.05) for feed intake (FI=872.11+3.936NL, F2=0.92) and feed conversion ratio (FCR=1.371+0.113NL, F2=0.94) in broilers with yeast included in their diets, and a decreasing linear effect for weight gain (WG=636.88>2.24NL, F2=0.90) in the 1 to 21>day old phase (Table 4).
Table 4. Regression equations for the weight gain, feed intake and feed conversion ratio variables of broilers, submitted to levels of sugarcane yeast inclusion into the feed at the age of 01 to 21 days
Phase Variable Equation Value of P R2
1 to 7 days FI (g/bird) FI =135.13 + 1.036NL 0.004 0.87
1 to 7 days FCR (g/g) FCR=1.236+0.009NL 0.016 0.69
1 to 21 days FI (g/bird) FI = 872.11+3.93NL 0.001 0.92
1 to 21 days WG (g/bird) WG = 636.88>2.24NL 0.005 0.90
1 to 21 days FCR (g/g) FCR = 1.371+0.0113NL <.0001 0.94
The behavior observed in the feed conversion ratio of broilers fed with different levels of yeast can be attributed to a lower nutrient utilization from the feed, as the increase in feed intake was not followed by extra weight gain. A similar result was found by Silva et al. (2003) that stated that the inclusion of yeast in the feed, until 10%, produced losses in performance of broilers in the period of 1 to 21 days of age.
The addition of the enzymatic complex had no influence over the feed intake, weight gain and feed conversion ratio. According to Rodríguez>Peña et al. (2013), only two enzymes are essential for breaking down the yeast cell: specific lytic protease, which breaks down the external layer of the mannoprotein, and β> 1,3 lytic glucanase, which breaks down the internal layer of glucan. This justifies in part the principle that the action of proteases produces an increase in porosity of the cell wall, thus allowing access for lytic activity, which is glucanase acting synergistically upon the lysis of the cell wall (FLEURI & SATO, 2010).
At 21 days old, the animals that received feed with 6% and 12% yeast without enzyme and 12% yeast with enzyme showed less weight gain and an increase in feed conversion ratio (p<0.05), when compared to animals that received the positive control diet.
Weight gain and feed conversion ratio of broilers at 1 to 21 days of age that were fed a diet with 6% yeast and enzymatic complex resembled those with positive control, which indicated that the complex may have acted on the yeast, thus minimizing performance losses. However, the same variables of broilers fed the diet with 6% yeast without enzyme, with 12% yeast with and without enzyme were different to the positive control, this may indicate that the dose of 200g/ton of the enzymatic complex was not sufficient, due to the increase of substrate in the diets of 12% yeast.
Note that the performance of those broilers that consumed positive control diets was similar to negative control with and without enzymatic complex, and that the addition of enzyme did not result in any difference concerning negative control. In research studies by Gonal et al. (2004) and Mourão & Pinheiro (2009) the evaluation of the use of exogenous enzymes did not demonstrate improved performance in broilers and justified the absence of a response being due to the low dose of the additive to the feed. For these authors, the addition of higher doses of enzymes can bring potential performance gains.
The relative values of carcass yield and cuts at 21 days of age, are presented on Table 5. No interaction was noted between the yeast levels and the supplement with enzymatic complex for any of the carcass yield and cut variables, which indicates that yeast can be used until a 12% inclusion rate for broilers without the addition of enzymes, as this does not cause losses in the yield of the carcass, breast, legs, thigh and wings of the broilers.
The supplementing with enzymatic complex did not show any significant effect on carcass or cuts yield (Table 5). No significant effect was seen on the yield or cuts of animals supplied with up to 12% of yeast in the diet in the 21>day phase. Similar results were seen by Grangeiro et al. (2001) and Silva et al. (2003) who did not observe any significant effect on carcass yield when supplying increasing levels of yeast from sugarcane at a level of up to 10%.
! " # $ %
&'' ( ) * $ $ % ! $
Table 5. Relative values for the carcass yield and cuts (%) of broilers fed on diets containing different levels of yeast and the addition of enzymatic complex at 21 days of age
Variable (%) PC NC Yeast Levels (%) Mean CV P>F
0 6 12 (%) EC YL EC*YL
CARCY 67
Without 67.00 66.00 66.00 66.00 1.62 0.172 0.462 0.449
With 66.00 67.00 66.00 66.00 > > > >
Mean 66.00 67.00 66.00 > > > > >
BY 32
Without 32.00 32.00 32.00 32.00 3.90 0.658 0.166 0.084
With 31.00 32.00 34.00 32.00 > > > >
Mean 32.00 32.00 33.00 > > > > >
TY 14.71
Without 14.50 14.83 14.58 14.64 4.51 0.891 0.439 0.712
With 14.77 14.88 14.36 14.67 > > > >
Mean 14.63 14.86 14.47 > > > > >
ULY 16.88
Without 15.98 16.22 15.70 15.97 5.89 0.599 0.623 0.801
With 16.05 15.73 15.58 15.79 > > > >
Mean 16.02 15.98 15.64 > > > > >
WINGY 12.02
Without 12.73 12.21 12.58 12.50 4.83 0.601 0.053 0.732
With 12.59 12.59 11.88 12.36 > > > >
Mean 12.66 12.40 12.23 > > > > >
CARCY= carcass yield; BY> breast yield; TY= thigh yield; ULY= upper leg yield; WINGY= wing yield; PC= positive control; NC= negative control; YL= yeast level; CV= coefficient of variation; SV= source of variation; EC= enzymatic complex.
Table 6. Effect of the yeast levels and addition of enzymatic complex on the morphometric variables of duodenal mucosa at 21 days
Variable (µm) PC NC Yeast Levels (%) Mean CV P>F
0 6 12 (%) YL EC EC*YL
CD 211
Without 209 256 273 246 25.16 0.686 0.155 0.174
With 238 198 214 217 > > > >
Mean 224 227 244 > > > > >
VH 1015
Without 994 1033 1000 1009 15.61 0.774 0.126 0.695
With 879 979 976 944 > > > >
Mean 937 1006 988 > > > > >
CW 53
Without 61 56 65 61 10.98 0.561 0.438 0.135
With 59 63 63 62 > > > >
Mean 60 60 64 > > > > >
VW 204
Without 235 240 256 244 24.70 0.677 0.075 0.956
With 201 191 218 203 > > > >
Mean 218 216 237 > > > > >
MW 222
Without 150 184 155 163b 22.38 0.669 0.024 0.593
With 198 207 209 205a > > > >
Mean 174 196 182 > > > > >
VP 2216
Without 2270 2378 2249 2299 16.02 0.691 0.081 0.648
With 1910 2193 2176 2093 > > > >
Mean 2090 2285 2213 > > > > >
VH/CD 4.95
Without 4.77 4.02 3.83 4.20 25.68 0.810 0.363 0.226
With 4.08 5.19 4.63 4.63 > > > >
Mean 4.43 4.60 4.23 > > > > >
Noteworthy here is that the intestinal muscle wall of the animals that did not receive the enzymatic complex was thinner in relation to animals that received the enzymatic mixture in the feed. As with abnormal increase, the sharp reduction in the thickness of the muscle wall, can be attributed to a physiological response to some external agent, such as microorganisms, pathogens and antinutritional substances. The collaborators Bonapaz et al. (2010) noted a reduction in the thickness of the intestinal wall within the group of broilers deliberately infected with microorganisms in relation to the control group.
The exogenous enzymes stimulate the intestinal mucosa through reducing the
quantity of substrate available for bacterial growth, as a lower quantity of substrate results in a lower quantity of bacteria (OLIVEIRA et al., 2009). The broilers fed on feed without enzymatic complex had, quite possibly, a higher bacterial load in their intestine, which may have caused a reduction in the thickness of the wall.
There was no effect from the inclusion of yeast over any morphometric variable of the duodenum at 21 days of age.
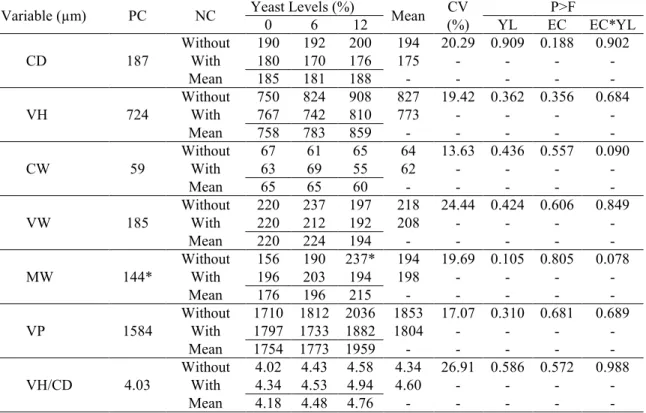
The morphometric analysis of the jejunum (Table 7), did not demonstrate a significant reaction between the enzyme and yeast over the variables under consideration.
Table 7. Effect of yeast levels and addition of the enzymatic complex on the morphometric variables of jejunal mucosa at 21 days of age.
Variable (µm) PC NC Yeast Levels (%) Mean CV P>F
0 6 12 (%) YL EC EC*YL
CD 187
Without 190 192 200 194 20.29 0.909 0.188 0.902
With 180 170 176 175 > > > >
Mean 185 181 188 > > > > >
VH 724
Without 750 824 908 827 19.42 0.362 0.356 0.684
With 767 742 810 773 > > > >
Mean 758 783 859 > > > > >
CW 59
Without 67 61 65 64 13.63 0.436 0.557 0.090
With 63 69 55 62 > > > >
Mean 65 65 60 > > > > >
VW 185
Without 220 237 197 218 24.44 0.424 0.606 0.849
With 220 212 192 208 > > > >
Mean 220 224 194 > > > > >
MW 144*
Without 156 190 237* 194 19.69 0.105 0.805 0.078
With 196 203 194 198 > > > >
Mean 176 196 215 > > > > >
VP 1584
Without 1710 1812 2036 1853 17.07 0.310 0.681 0.689
With 1797 1733 1882 1804 > > > >
Mean 1754 1773 1959 > > > > >
VH/CD 4.03
Without 4.02 4.43 4.58 4.34 26.91 0.586 0.572 0.988
With 4.34 4.53 4.94 4.60 > > > >
Mean 4.18 4.48 4.76 > > > > >
*Differs from the mean of the positive control treatment by the Dunnett test (p<0.05).
! " # $ %
&'' ( ) * $ $ % ! $
The levels of yeast in the diet did not alter the measurements of the jejunal mucosa structures at 21 days of age. Noted here was that the broilers that belonged to the group with 12% yeast without the enzymatic complex, presented a thicker muscle wall in relation to the positive control group (p<0.05).
The presence, in greater part, of NSPs in the diet results in an increase in the quantity and digesta weight, thus causing an increase in the longitudinal muscle layer (BRENES et al., 2002), which is one of the layers responsible for peristalsis, justifying in this way the
increase in the thickness of the wall, as a physiological manifestation of the organism to maintain digesta flow. The activation of the smooth muscle present on the muscle wall leads to a study of hypercontractility for the expulsion of digesta from the tract (BAUER, 2008). There was no significant effect from the use of the enzymatic complex on the variables studied in this segment of the small intestine.
There was no significant interaction between the yeast and the enzymatic complex (Table 8) for the morphometric variables of the ileus at 21 days.
Table 8. Effect from yeast levels and the addition of enzymatic complex on the morphometric variables of ileal mucosa at 21 days
Variable (µm) PC NC Yeast Levels (%) Mean CV P>F
0 6 12 (%) YL EC EC*YL
CD 131
Without 148 118 140 135 30.44 0.932 0.463 0.415
With 116 133 120 123 > > > >
Mean 132 126 130 > > > > >
VH 562
Without 664 551 530 581 21.71 0.177 0.590 0.583
With 588 490 583 554 > > > >
Mean 626 521 557 > > > >
CW 63
Without 64 68 68 67a 12.27 0.897 0.028 0.474
With 62 60 56 59b > > > >
Mean 63 64 62 > > > > >
VW 260
Without 206 224 255 228 23.36 0.466 0.070 0.619
With 178 204 186 190 > > > >
Mean 192 214 221 > > > > >
PM 147
Without 153 133 155 147 25.66 0.098 0.070 0.365
With 163 149 223 178 > > > >
Mean 158 141 189 > > > > >
VP 1358
Without 1485 1278 1280 1348 20.63 0.269 0.572 0.606
With 1329 1135 1390 1285 > > > >
Mean 1407 1207 1335 > > > > >
VH/CD 4,30
Without 4,91 4,75 3,83 4,50 19.95 0.154 0.854 0.092
With 5,10 3,71 4,88 4,56 > > > >
Mean 5,00 4,23 4,35 > > > > >>
However, there was a significant effect on the crypt width with the addition of the enzymatic complex to the diet (p<0.05), even without there being any modification to the dimensions of the villus. Through the supply of the enzymatic complex, there was an observed decrease to the width in the ileus, when compared to the diets without enzymatic complex, which indicates that the exogenous enzymes were active in this region, reducing the adverse effects of the NSPs, as for example on the viscosity and proliferation of opportunist microorganisms.
The exogenous enzymes act in a way that benefits the mucosa by means of reducing the viscosity of diets rich in soluble non>starch polysaccharides, and the breakdown of substrates that would be used for the proliferation of opportunist bacteria in this segment of the intestine (OLIVEIRA et al., 2009). The collaborators Harvatovic et al. (2015) after assessing the inclusion of exogenous enzymes to diets with sunflower meal, which possesses large quantities of soluble SNP, observed that the viscosity of the digesta increased from the proximal to the distal of the intestine, and that the activity of the enzymatic complex was more effective in the reduction of viscosity in the ileus. According to Padihari et al. (2014) a smooth crypt is an indication of the capacity of the small intestine to require less nutrients and energy for mucosa regeneration, while allowing the intestinal cells to produce digestive enzymes and improve the absorption of nutrients. In this way, the conservation of the size of the villi and the smaller width of the crypt refers to the maintenance of digestive and absorption capacities of the intestine.
The supply of yeast did not affect the intestinal mucosa structures of the ileus at the period of 21 days.
The conclusion was reached that the use of 6 and 12% of yeast in diets
deteriorates the performance of broilers from 1 to 21 days. The addition of the enzymatic complex in diets reduced in 70 Kcal of the requirement and the adding of 6% yeast, maintained the performance of the broilers similar to those that receive diets based on nutritional requirement. The inclusion of yeast and enzymatic complex does not inhibit carcass yield or the intestinal morphometry of broilers. The addition of enzymatic complex is beneficial to mucosa of the ileus.
+;+ +#8+
BARBOSA, N.A.; BONATO, M.A.; SAKOMURA, N.K.; DOURADO, L.R.B.; FERNANDES, J.B.K.;
KAWAUCHI, I.M. Digestibilidade ileal de frangos de corte alimentados com dietas suplementadas com enzimas exógenas.8 . ' . ' , v.5, n.4, p.361, 2014.
BAUER, A.J. Mentation on the immunological modulation of gastrintestinal motility.
# * ' ' 1 ' '-, v.20,
p.81>90, 2008.
BEHMER, O.A.; TOLOSA, E.M.C.; NETO, A.G.F.; RODRIGUES, C.J.
1 '<. . & ' *
' =* . . 2.ed. Barueri, SP: Manole, 2003. 331p.
BONAPAZ, R.S.; HERMES>ULIANA C.; SANTOS, F.N.; SILVA A.V.; ARAÚJO E.J.A.; SANT’ANA, D.M.G. Effects of infection withToxoplasma gondiioocysts on the intestinal wall and the myenteric plexus of chicken (Gallus gallus). > ? ' @
! " # $ %
&'' ( ) * $ $ % ! $
BRENES, A.; MARQUARDT, R.R.; GUENTER, W. Effect of enzyme addition on the performance and gastrointestinal tract size of chicks fed lupin seed and their fractions. ' - . . , v.81, n.5, p.670>678, 2002.
ESMAEILIPOUR, O.; SHIVAZAD, M.; MORAVEJ, H.; AMINZADEH, S.; REZAIAN, M.; KRIMPEN, M.M. Effects of xylanase and citric acid on the
performance, nutrient retention, and characteristics of gastrointestinal tract of broilers fed low>phosphorus wheat>based diets. ' - . . , v.90, n. 9, p.1975> 1982, 2011.
FLEURI, L.F.; SATO, H.H.. β>1,3 glucanase. ' . * ( 8 A . 7 ' , v.37, p.40>43, 2007.
FLEURI, L.F.; SATO, H.H. Produção de protoplastos e lise da parede celular de leveduras utilizando β>1,3 glucanase.
8 A . 6 . * ' , v.30,
n.2, p.471>476, 2010.
FREITAS, E.R.; LIMA, R.C.; SILVA, R.B.; SUCUPIRA, F.S.; BEZERRA, R.M. Substituição do farelo de soja por levedura de cana>de>açúcar em rações para frangos de corte. ' 8 A . * B . , v. 44, n. 1, 2013.
GONAL, M.; YASAR, S.; FORBES, J.M. Performance and some digesta parameters of broiler chickens given low or high viscosity wheat>based diets with or without enzyme supplementation.6 C D
? ' - . . , v.28, n.2,
p.323>327, 2004.
GRANGEIRO, M.G.A.; FUENTES, M.F.F.; FREITAS, E.R.; ESPÍNDOLA, G.B.; SOUZA, F.M. Inclusão da levedura de cana>de>açúcar (Saccharomyces cerevisiae) em dietas para frango de corte.
' E ' . , v.30,
n.3, p.766>773, 2001.
HORVATOVIC, M.P.; GLAMOCIC, D.; ZIKIC, D.; HADNADJEV, T.D.
Performance and some intestinal functions of broilers fed diets with different inclusion levels of sunflower meal and supplemented or not with enzymes. , D / ' - . . , v.17, n.1, p.25>30, 2015.
HU, C.H.; GU, L.Y.; LUAN, Z.S.; SONG, J.; ZHU, K. Effects of montmorillonite– zinc oxide hybrid on performance, diarrhea, intestinal permeability and morphology of weanling pigs.
; . . 6 .& *-, v.177, n.1> 2, p.108>115, 2012.
LIMA, M.R.; SILVA, J.H.V.; ARAUJO, J.A.; LIMA, C.B.; OLIVEIRA, E.R.A. Enzimas exógenas na alimentação de aves.
.' ? ' @ F . , v.1, n.4, p.99> 110, 2007.
LONGO, F.L.; MENTEN, J.F.M.; PEDROSO, A.A.; FIGUEIREDO, A.N.; RACANIPCI, A.M.C.; GAIOTTO, J.B.; SORBARA, J.O.B. Diferenças fontes de proteína na dieta pré>inicial de frangos de
corte. ' E ' . ,
v.34, n.1, p.112>122, 2005.
LOPES C.C.; RABELLO C.B.V.; SILVA JÚNIOR V.A.; HOLANDA M.C.R.; ARRUDA E.M.F.; SILVA J.C.R.
Desempenho, digestibilidade, composição corporal e morfologia intestinal de pintos de corte recebendo dietas contendo levedura de cana>de>açúcar. .'
. ' . . , v.33, n.1,
p.33>40, 2011.
MOURÃO, J.L.T.A.M.; PINHEIRO, V.M.C. Efeitos do centeio, do trigo e da suplementação com xilanases sobre o valor nutricional de dietas e o desempenho de frangos corte. '
E ' . , v.38, n.12, p.2417>2424, 2009.
NOY Y.; SKLAN D. Nutrient use in chicks during the first week posthatch. '
OLIVEIRA, M.C.; CANCHERINI, L.C.; MARQUES, R.H.; GRAVENA, R.A.; MORAES, V.M.B. Mananoligossacarídeos e complexo enzimático em dietas para frangos de corte. '
E ' . , v.38, p.879>886, 2009.
PADIHARI, V.P.; TIWARI, S.P.; SAHU, T.; GENDLEY, M.K.; SURENDRA, K.N. Effects of Mannan Oligosaccharide andSaccharomyces cerevisiaeon Gut Morphology of Broiler Chickens.
D / G H ' - .&,
v.4, n.3, p.56>59, 2014.
PAIVA, J.G.A.; CARVALHO, S.M.F.; MAGALHÃES, M.P.; RIBEIRO, D.G.Verniz vitral incolor 500: uma alternativa de meio de montagem economicamente viável. .' 'I .
, v.20, n.2, p.257>264, 2006.
PERDOMO, M.C.; VARGAS, R.E.; CAMPOS, J.G.Valor nutritivo de la levadura de cerveceria (Saccharomyces cerevisiae) y de sus derivados, extracto y pared celular, en la alimentacion aviar.
.& 9 ' . .'
, v.12, p.85>89, 2004.
RODRÍGUEZ>PEÑA, J.M.; DÍEZ> MUÑIZ,S.; BERMEJO,C.; NOMBELA, C.; ARROYO, J. 2013. Activation of the yeast cell wall integrity MAPK pathway by zymolyase depends on protease and glucanase activities and requires the mucin>like protein Hkr1 but not Msb2.
; 9 '' , v.587, n.22, p.3675>3680, 2013.
ROSTAGNO, H.S.; ALBINO, L.F.T.; DONZELE, J.L.; GOMES, P.C.; OLIVEIRA, R. F.; LOPES, D. C.; FERREIRA, A.S.; BARRETO, S.L.T.; EUCLIDES, R.F.6
F : composição de alimentos e exigências nutricionais. Viçosa, MG: UFV, 2011. 252p.
SILVA, J.D.B.; GUIM, A.; SILVA, L.P.G. Utilização de diferentes níveis de levedura (Saccharomyces cerevisiae)em dietas e seus efeitos no desempenho, rendimento da carcaça e gordura abdominal em frangos de cortes. .'
. ' . . , v.25, n.2,
p.285>291, 2003.
SOUSA, D.C.; OLIVEIRA, N.L.A.; SANTOS, E.T.; GUZZI, A.;
DOURADO, L.R.B.; FERREIRA, G.J. Caracterização morfológica do trato gastrointestinal de frangos de corte da li> nhagem Cobb 500®. >
? ' @ , v.35, n.1, p.61> 68, 2017.
TACHIBANA, L.; PINTO, L.G.Q.; GONÇALVES, G.S.; PEZZATO, L.E. Xilanase e β>glucanase na digestibilidade aparente de nutrientes do triticale pela Tilápia>do>nilo. >
1 . ? ' @ E ' . ,
v.62, p.445>452, 2010.
WANG, Z.R.; QIAO, S.Y.; LU, W.Q.; LI, D.F. Effects of enzyme
supplementation on performance, nutrient digestibility, gastrointestinal morphology, and volatile fatty acid profiles in the hindgut of broilers fed wheat>based diets.
' - . . , v.84, n.6, p.875>881, 2005.
ZANELLA, I.; SAKOMURA, N.K.; SILVERSIDES, F.G. Effect of
supplementation of broiler diets based on corn and soybeans. ' - . . , v.78, n.4, p.561>568, 1999.