ISSN 0101-2061 Food Science and Technology
DI:
D http://dx.doi.org/10.1590/1678-457X.01416
1 Introduction
Melon is a tropical fruit of high commercial value, however, has a relatively short shelf-life at room temperature, which has considerably jeopardized its selling potential depending on the distance from production centers, thus contributing to a high waste rate (Lima et al., 2004). Furthermore, melon is not very handy for individual consumption, since fruits are big, requiring preparation, such as peeling, cutting and removal of the seeds, before consumption. Dsmotic dehydration (DD) may represent a viable technological alternative to offer a ready-to-eat product and reduce post-harvest losses, ensuring a better fruit availability in the country.
DD involves partial dehydration of water-rich food using hypertonic aqueous solutions of various edible solutes (sucrose, fructose, invert sugar, lactose, maltodextrin, ethanol, calcium chloride and others) (Yadav & Singh, 2014) that can be used either alone or in mixture. This process reduces the water activity of food increasing microbial stability and slows down deteriorating reactions. The energy and time needed for dehydration, also reduced, and the equipment and operation costs are low, besides being simple. In DD process, three types of counter-current flows occur: (1) an important water outflow, from the product to the solution; (2) a solute transfer, from the solution to the product, which allows the introduction of any solute of nutritional, sensory and microbiological interest into the product; and (3) a leaching out of the product’s own solutes
to the solution, which is quantitatively negligible compared with the first two types of transfer (Raoult-Wack, 1994).
Since grape juice concentrate has a high content of glucose and fructose (Gurak et al., 2010) it can be used as osmotic solution with advantage over sucrose solution in relation to the mass transfer phenomena. In addition, it presents high acidity due to the presence of tartaric, malic and citric acids. These acids influence the organoleptic properties (flavor, color, and aroma), the stability and microbiologic control of juice (Mato et al., 2005). Among the bioactive compounds present in grape juice, phenolic constituents are of great importance because their characteristics are directly or indirectly related to the quality of the juice and affect its color and astringency (Gurak et al., 2010). Mineral elements, such as potassium, and proteins including chitinases and traumatin-like proteins are also found in the grape juice (Gurak et al., 2010; Le Bourse et al., 2010). Due to its rich constitution, grape juice is considered a beverage with positive energetic, nutritional and bioactive effects; although the proteins are involved in some rare cases of grape and wine allergy (Le Bourse et al., 2010). Fruit juices concentrates (grape must and mandarin juice) have already been used as osmotic solutions in vacuum pulse osmotic dehydration of kiwi and apple slices. The processing time was reduced in kiwi osmotic dehydration and the kiwi sensory quality was better than those obtained using sucrose solution (Escriche et al., 2002). Bioactive compounds of mandarin juice have successfully been incorporated into the
Osmotic dehydration of yellow melon using red grape juice concentrate
Hulda Noemi Mamani CHAMBI1, Wiliene Camila Valadares LIMA1, Flávio Luís SCHMIDT1*Received 20 Jan., 2016 Accepted 03 June, 2016
1 Department of Food Technology, Faculty of Food Engineering, Universidade Estadual de Campinas – UNICAMP, Campinas, SP, Brazil
*Corresponding author: [email protected] Abstract
The main objectives of this work were to study the effect of fruit ripening on the melon osmotic dehydration at reduced pressure and to model the mass transfer of moisture during melon dehydration with grape juice concentrate and sucrose solution. The ripening level had no relevant effect over the physical characteristics of the final product, with soluble solids, moisture and water activity without significant differences. Besides, the mass loss and solute gain parameters did not show significant differences, and only the solute gain had few variations. The process of the osmotic dehydration with grape juice concentrate was the most effective one, with higher dehydration and lowest solutes gain compared to the process carried out with sucrose solution. The water effective diffusivity calculated by the Fick’s equation for the process conduced with grape juice was lower than the one obtained for the sucrose solution, according to different equilibrium moisture content calculated by Peleg’s equation. The dehydrated melon with grape juice concentrate showed reduced water activity (~ 0.92) and low moisture content (~ 58%).
Keywords: vacuum osmotic dehydration; effective diffusivity; fruit juice concentrate.
structural matrix of fresh apple slices with no negative effects on their antiradical capacities following impregnation and air drying (Betoret et al., 2012).
The efficiency of the DD process can be affected by: nature, size and shape of the biological material; nature, type and concentration of the osmotic agent; and process parameter (temperature, time, work pressure, agitation); osmotic solution to sample ratio; and fruit pre-treatment (Amami et al., 2007; Chavan & Amarowicz, 2012; Nowacka et al., 2014; Yadav & Singh, 2014). The reduction of pressure during osmotic dehydration increases the rate of the process and facilitates the penetration of the osmotic solution solutes into the fruit matrix. Dsmotic dehydration under reduced pressure can be performed in two ways: reduced pressure is kept continuously or reduction of pressure is done in pulses (Lewicki & Lenart, 2006).
The main objectives of this work were to study the effect of fruit ripening on the melon osmotic dehydration at reduced pressure and to model the mass transfer of moisture during melon dehydration with grape juice concentrate and sucrose solution.
2 Material and methods 2.1 Material
Melons (Cucumis melo L. var. inodorus) grown in Mossoro region (RN, Brazil) were obtained from a local Market (CEASA, Campinas, Brazil). Melons were selected based on the following criteria: skin color (yellow) and pulp (from greenish white to cream), appearance (similar size and shape). Melon was manually washed, peeled and cut into cubes of 10 mm side using knives and a fruit cube cutting machine.
Grape juice concentrate (68 °Brix) was purchased from the company Golden Sucos (RS, Brazil) and diluted with filtered water to 60 °Brix. For comparison purpose, sucrose solution (60 °Brix) was prepared from commercial sugar purchased from the local market. The characteristics of both osmotic solutions are shown in Table 1. The osmotic pressure (Π) of both solutions were calculated through Equation 1 (Lewicki & Lenart, 2006), where aw is the water activity and T is the absolute temperature (K).
( )
5
Ð 4.6063 10= − × Tln aw (1)
2.2 Osmotic dehydration equipment
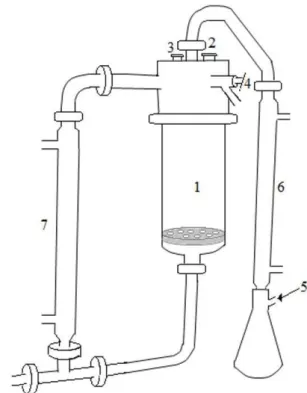
In DD process, the water removed from the material dilutes the hypertonic solution. Hence, it is important to keep a constant concentration, either through a continuous evaporation of excess water or through a dissolution of the osmoactive substance. In this study, both methods were employed and it was possible to use the same solution six times. The equipment design (Figure 1) made possible the evaporation of water while the dehydration occurred. The amount of evaporated water depended on the dehydration time. The longer the time was, greater the volume of water collected would be. The concentration of soluble solids after the DD process was 58.8 ± 0.5 °Brix for tests with sucrose solution, and 57.7 ± 0.5 °Brix for tests with grape juice. Afterwards, the solute concentration of the solution was adjusted after every process to 60 °Brix using grape juice concentrate of 68 °Brix or sugar.
The equipment temperature was maintained by natural recirculation (3 L/min) enabled by the density difference of the osmotic solution in the vessel (T = 40 °C) and in the tubular heat exchanger (T = 55-60 °C). The pressure was kept constant through the continuous removal of vapors produced during the process through the condenser (0 °C).
The melon was placed in the vessel on the perforated nylon disc, the equipment was closed and kept for 5 minutes at working pressure. Then, the osmotic solution was introduced into the vessel by the vacuum break valve. When the time of the
Table 1. Physicochemical characteristics of osmotic solutions.
Characteristics Sucrose solution Grape juice concentrate
Brix (°) 60 60
Titratable acidity (g*/100 g) 0.0041 ± 0.0005 2.084 ± 0.011
pH (25 °C) 7.31 ± 0.17 3.03 ± 0.02
Reducing sugar (g glucose/100 g)
0.163 ± 0.042 50.06 ± 1.06
aw (25 °C) 0.8769 ± 0.0005 0.8382 ± 0.0028
Density (g/mL) 1.26 1.27
Dsmotic Pressure (Pa, 25 °C) 1.8 x 10⁷ 2.4 x 10⁷
* Expressed in g citric acid for sucrose solution and g tartaric acid for grape juice concentrate.
osmotic dehydration was completed, the atmospheric pressure was restored, the slurry was drained, and the samples were removed from vessel, rinsed with distilled water and placed on absorbent paper to remove the excess of solution.
2.3 Effect of ripening on the OD of melon
Due to the wide variability in the melons ripening during the trials, we evaluated the effect of ripening on melon mass loss, solute gain and water loss during DD. Soluble solid and moisture content, and water activity of the dehydrated melon were also determined. The fresh melon was characterized as soluble solids content, acidity, pH, reducing sugars, moisture content and water activity. An absolute pressure of 200 mbar min was applied for 60 to the system containing the melon samples immersed in sucrose solution (60 °Brix) at 40 °C using a proportion fruit: osmotic solution of 1:7. Each process was repeated 3 times.
2.4 Effect of osmotic dehydration time
An absolute pressure of 200 mbar was applied for 10, 20, 40, 60, 80, 100 and 120 min to the system containing the melon samples immersed in osmotic solution (60 °Brix) at 40 °C using a proportion fruit: osmotic solution of 1:10, always in triplicate. Antifoam (0.03 g/100 g) Xiameter AFE-0010 (D’Altomare Química Ltda, São Paulo, Brazil) was added to the grape juice, due to the high amount of foam formed during the process. We evaluated the effect of DD time on melon weight loss, solute gain and water loss. Soluble solid and moisture content, and water activity of the dehydrated melon were also determined. The process was repeated three times in each osmotic dehydration time.
2.5 Modeling of mass transfer kinetic
The modeling of water loss during melon dehydration with grape juice concentrate and sucrose solution was made using Fick’s and Page’s equations. Experimental data were employed in order to calculate effective diffusivity (Deff) of the water transferred
during the osmotic treatments by Fick’s equation. Considering a cubic geometry with initially uniform water and solid contents, the solution for Fick’s equation for constant process conditions is given by Equation 2 (Khoyi & Hesari, 2007).
( ) ( )
3 2 2
2 2 2
0 8 1 2 1 4 2 1 t e ef
o e i
X X t
exp i D
X X i L
π π ∞ = − = − + − +
∑
(2)where Xt is the average moisture content at instant t (g/g on dry basis), Xe is the equilibrium moisture content (g/g on dry basis),
Xo is the initial moisture content (g/g on dry basis), i is the number of series terms, Def is the water effective diffusivity (m2/s), t is
the drying time (s) and L is the characteristic length, sample half-thickness (m). The effective diffusivity was determined by non-linear estimation (quasi-Newton) from software Statistica 12.0 (Statsoft, Tulsa, USA) using 10 first series terms of equation.
Peleg’s equation (Equation 3) was used in order to determine the equilibrium moisture content (Equation 4) (Corrêa et al., 2010; Corzo & Bracho, 2006). The major advantage of the Peleg’s
model is to save time by predicting water sorption kinetics of food including equilibrium moisture content using short-time experimental data (Corzo & Bracho, 2006).
t o
1 2
t
X X
K K t
= ±
+ (3)
o o
1 2 2
t 1
lim X X
K K t K
e t X →∞ = ± + = ± (4)
where K1 is the Peleg’s rate constant and K2 is the Peleg’s capacity constant. The “±” turn into “+” if the process is absorption or adsorption and “−” if the process is drying or desorption (as osmotic dehydration). These parameters (K1 and K2) were obtained by linear regression.
The experimental data were also adjusted according to Page’s model (Equation 5), which is a simplification of the Fick’s equation (Equation 1), where is considered only the first term of the serie. 8/π2 is considered close to 1, and the term π2D
ef/4L
2 is
equal to constant K, called drying rate constant (Silva et al., 2003). The constant n (potential order) is added as a correction coefficient of time t. Constant K and n were determined by non-linear estimation (quasi-Newton) from software Statistica 12.0 (Statsoft, Tulsa, USA).
(
n)
t e o e X X exp Kt X X − = −
− (5)
2.6 Calculations
The mass loss (ML), water loss (WL) and sugar gain (SG) were determined by Equations 6, 7 and 8 and expressed in g/100 g of initial fresh melon weight.
100 t o o M M ML x M −
= (6)
. .
100
t t o t o
M X M X
WL x
M
−
= (7)
. .
100
t t o o o
M S M S
SG x
M
−
= (8)
where Mt and Mo are the final (time t) and initial samples weights (g), respectively; So and St are the final (time t) and initial soluble solid content (g/g of melon), respectively; and Xo and Xt are the final (time t) and initial moisture content (g/g of melon), respectively.
2.7 Analysis
2.8 Statistical analysis
The experimental results were analyzed by ANDVA and Tukey’s multiple test at 95% confidence level using the statistical program “Statistical Analysis Systems” (SAS).
3 Results and discussion 3.1 Effect of the ripening
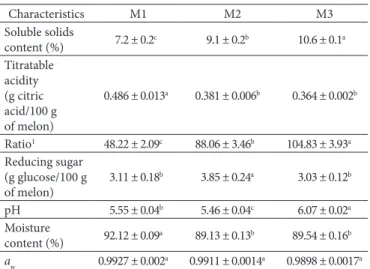
The fruits selected (M1, M2, M3 groups) for the study showed significant differences in the levels of soluble solids, acidity and reducing sugars (Table 2). Although with differences in the level of ripening, all melons presented firmness in naked eye. The variation in the level of ripening did not significantly affect the soluble solids values, water activity and moisture content of the melons subjected to the process of vacuum DD under the conditions studied, neither in the weight loss and water loss parameters (Table 3). The solute gain was the only parameter that showed significant differences, in which there was a lower gain of solute of the most mature melons (Table 3). With the
ripening, the melon gets softer, the cell wall gradually collapses, the adhesion wall-wall is decreased and the average blade begins to dissolve (Nishiyama et al., 2007). All these changes alter the permeability of the cell membrane and hence its osmotic dehydration rate (Amami et al., 2007; Panarese et al., 2012; Rastogi et al., 2002). This variation in the permeability of the cell membrane of the melon should has been low since no relevant changes were observed in the rate of the DD. The variation of the solutes gain may be due to the higher content of soluble solids in the fruit M3 (Table 2), which negatively affected the difference between the osmotic potential of the solution and the melon, which is the driving force of the osmotic transport phenomenon. These results can also be extended for osmotic dehydration under vacuum with grape juice concentrate using the same process parameters and melons with ratios ranging from 48 to 105.
3.2 Effect of osmotic dehydration time
In this section are presented, the results of effect of the osmotic dehydration time over mass loss, water loss, solute gain, aw, moisture and soluble solids contents of melon dehydrated
with grape juice concentrate and sucrose solution at 60 °Brix. Also, the modeling of the mass transfer of moisture during melon, using both osmotic agents, is presented.
Water loss and solute gain
The melon dehydrated with grape juice concentrate showed greater weight and water loss and lower solute gain compared to the melon dehydrated with sucrose solution (Figure 2).
The efficiency of the process was evaluated by the ratio WL/SG (water loss/solute gain) in which higher values indicate that the DD process was more effective, with higher dehydration and lower solute gain. The DD process with grape juice concentrate was more effective as it presented an average ratio WL/SG of 11.2 ± 3.0 which was two times higher than the ratio obtained for the process performed with sucrose solution (ratio WL/SG = 5.2 ± 0.4).
In the grape juice, the soluble solids are mainly glucose (98 g/L) and fructose (106 g/L) (Göğüş et al., 1998) whose proportion may vary depending on the grape variety and the stage of maturity in which the fruit has been harvested. After the sugars, the organic acids are the most common soluble solids in the juice. The tartaric and malic acids are the predominant organic acids and the succinic and citric acids are present in minor proportion (Mato et al., 2005). There are also small amounts of other acids such like galaturonic, glucuronic, citramalic, dimethylglyceric, pyruvic, among others. The differences observed in the process efficiency are related with the complex composition of the grape juice, mostly formed by low molecular weight solutes (150 to 190 g/mol), resulting in better dehydration. In general, high molecular weight solutes favor a high water loss (Rastogi et al., 2002), however, it has been reported that the glucose (with lower molecular weight) improved water loss compared with the use of sucrose solution (Sritongtae et al., 2011). Although the osmotic agents have the same content of soluble solids, they have different water activity Table 2. Physicochemical characteristics of melon.
Characteristics M1 M2 M3
Soluble solids
content (%) 7.2 ± 0.2
c 9.1 ± 0.2b 10.6 ± 0.1a
Titratable acidity (g citric acid/100 g of melon)
0.486 ± 0.013a 0.381 ± 0.006b 0.364 ± 0.002b
Ratio1 48.22 ± 2.09c 88.06 ± 3.46b 104.83 ± 3.93a
Reducing sugar (g glucose/100 g of melon)
3.11 ± 0.18b 3.85 ± 0.24a 3.03 ± 0.12b
pH 5.55 ± 0.04b 5.46 ± 0.04c 6.07 ± 0.02a
Moisture
content (%) 92.12 ± 0.09
a 89.13 ± 0.13b 89.54 ± 0.16b
aw 0.9927 ± 0.002a 0.9911 ± 0.0014a 0.9898 ± 0.0017a
Different superscript letters in the same line indicate significant difference (p<0.05).
1 Ratio=soluble solids content/titratable acidity.
Table 3. Characteristics of dehydrated melon with sucrose solution (60 °Brix).
M1 M2 M3
Soluble solids
content (%) 23.5 ± 1.2
a 23.9 ± 1.2a 25.5 ± 1.3a
Moisture
content (%) 76.0 ± 1.15
a 75.0 ± 1.31a 75.05 ± 0.48a
aw 0.9798 ± 0.0008a 0.9739 ± 0.0016a 0.9730 ± 0.0028a
Mass loss (g/100 g melon1)
39.5 ± 3.3a 34.2 ± 2.2a 36.3 ± 4.6a
Solute gain
(g/100 g melon1) 7 ± 1a 6.7 ± 0.3a.b 5.7 ± 0.4b
Water loss
(g/100 g melon1) 46.2 ± 3.2a 39.7 ± 2.5a 41.5 ± 3.5a
Different superscript letters in the same line indicate significant difference (p<0.05).
values and therefore different values of osmolality (Table 1). Therefore, the chemical potential gradient between the water in the liquid phase of the melon cell and the water in the grape juice will be higher than the gradient created with the sucrose solution, resulting in greater loss of water for the first osmotic agent. This difference regarding the chemical potential between the sucrose solution and the grape juice is due to the complex composition of the grape juice. Thus, it would be necessary to
use a sucrose solution with total solids content of approximately 72 °Brix for an equal chemical potential gradient of water caused by the grape juice. The application of this concentration is not feasible since the high viscosity makes the handling during the process very hard.
to the different levels of melon ripening. As mentioned earlier, this was the parameter that presented significant differences regarding the ripening level.
Modeling of mass transfer kinetic
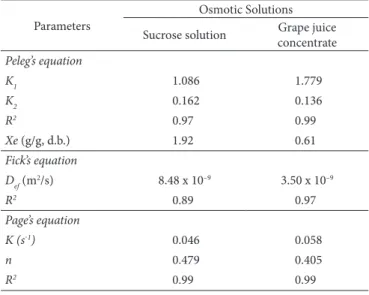
The equilibrium moisture values obtained through the Peleg’s model allowed the calculation of the water effective diffusivity (Def) in the DD process and the Page’s parameters (Table 4). With these parameters, it was possible to model the kinetics of the DD process, in regarding the dimensionless moisture content and the process time (Figure 3). From the two models, the Page’s equation fit better the experimental data (Table 4), which it was also observed in other researches about DD and fruits (Park et al, 2002; Silva et al., 2003).
The water loss Def in the DD process with grape juice was lower than the one obtained for the sucrose solution due to the different equilibrium moisture values obtained by the Peleg’s model. For the sucrose solution, the equilibrium moisture (Xe = 1.92 g/ g, d.b. or 65.8 g/100 g. w.b.) was already reached
at 120 minutes of the process (Figure 2) and at a high-speed of water loss (Def = 8.48 x 10⁻⁹ m2/s). For the grape juice, we can
still expect to obtain a water loss greater than 58 g/100 g melon (w.b.) (Figure 2) at a slower speed of 3.50 x 10⁻⁹ m2/s, since the
equilibrium moisture (Xe = 0.61 g/, d.b. or 37.9 g/100 g, w.b.) was not reached at 120 minutes of the process.
The experimental values of the water effective diffusivity found in the literature have shown orders of magnitude between 10–9 and 10–10 m2/s. The D
ef values of some fruits are as following: Guava subjected to different concentrations of sucrose and different vacuum conditions (0.3 x 10⁻¹⁰ to 4.6 x 10⁻¹⁰ m2/s); apricot
and pear submitted to DD at different temperatures, different sucrose concentrations and without the application of vacuum (apricot = 4.4 x 10⁻⁹ to 8.6 x 10⁻⁹ m2/s; pear = 3.5 x 10⁻¹⁰ to 1.9 x 10⁻⁹ m2/s)
(Corrêa et al., 2010; Khoyi & Hesari, 2007; Park et al., 2002). For the melon osmotically dehydrated with solution of sucrose and maltose of different Brix and at different temperatures, the Def values varied between 3.9 x 10⁻⁹ to 6.5 x 10⁻⁹ m2/s, and
for the melon dehydrated under conditions similar to our experimental ones (sucrose solution of 60 °Brix, 40 °C, ratio fruit:solution of 1:10) but without the application of vacuum it was obtained a Def value of 4.4 x 10
–9 m2/s (Ferrari & Hubinger,
2008). The comparison of the effective diffusivity values found in the literature with those obtained in this work is not feasible due to the variability in the composition of the raw material, in its chemical structure, in its processing conditions, in the types of osmotic agents, and in the different methods and models used in determining the effective diffusivity.
Table 4. Peleg’s, Fick’s and Page’s equations parameters of osmotic dehydration process.
Parameters
Dsmotic Solutions Sucrose solution Grape juice
concentrate Peleg’s equation
K1 1.086 1.779
K2 0.162 0.136
R2 0.97 0.99
Xe (g/g, d.b.) 1.92 0.61
Fick’s equation
Def (m2/s) 8.48 x 10⁻⁹ 3.50 x 10⁻⁹
R2 0.89 0.97
Page’s equation
K (s-1) 0.046 0.058
n 0.479 0.405
R2 0.99 0.99
References
Amami, E., Fersi, A., Vorobiev, E., & Kechaou, N. (2007). Dsmotic dehydration of carrot tissue enhanced by pulsed electric field, salt and centrifugal force. Journal of Food Engineering, 83(4), 605-613. http://dx.doi.org/10.1016/j.jfoodeng.2007.04.021.
Association of Dfficial Analytical Chemists – ADAC. (2000). Official methods of analysis. Washington: ADAC.
Betoret, E., Sentandreu, E., Betoret, N., Codoñer-Franch, P., Valls-Bellés, V., & Fito, P. (2012). Technological development and functional properties of an apple snack rich in flavonoid from mandarin juice.
Innovative Food Science & Emerging Technologies, 16, 298-304. http:// dx.doi.org/10.1016/j.ifset.2012.07.003.
Chavan, U. D., & Amarowicz, R. (2012). Dsmotic dehydration process for preservation of fruits and vegetables. Journal of Food Research, 1(2), 202-209. http://dx.doi.org/10.5539/jfr.v1n2p202.
Corrêa, J. L. G., Pereira, L. M., Vieira, G. S., & Hubinger, M. D. (2010). Mass transfer kinetics of pulsed vacuum osmotic dehydration of guavas. Journal of Food Engineering, 96(4), 498-504. http://dx.doi. org/10.1016/j.jfoodeng.2009.08.032.
Corzo, D., & Bracho, N. (2006). Application of Peleg model to study mass transfer during osmotic dehydration of sardine sheets. Journal of Food Engineering, 75(4), 535-541. http://dx.doi.org/10.1016/j. jfoodeng.2005.05.001.
Escriche, I., Garcia-Pinchi, R., Carot, J. M., & Serra, J. A. (2002). Comparison of must and sucrose as osmotic solutions to obtain high quality minimally processed kiwi fruit (Actinidiachinensis P.) slices.
International Journal of Food Science & Technology, 37(1), 87-95. http://dx.doi.org/10.1046/j.1365-2621.2002.00527.x.
Ferrari, C. C., & Hubinger, M. D. (2008). Evaluation of the mechanical properties and diffusion coefficients of osmodehydrated melon cubes. International Journal of Food Science & Technology, 43(11), 2065-2074. http://dx.doi.org/10.1111/j.1365-2621.2008.01824.x. Göğüş, F., Bozkurt, H., & Eren, S. (1998). Kinetics of maillard reactions
between the major sugars and amino acids of boiled grape juice.
LWT - Food Science and Technology, 31(2), 196-200. http://dx.doi. org/10.1006/fstl.1997.0315.
Guedes, A. M. M., & Faria, L. J. G. (2000). Determinação da constante de secagem de urucum (Bixaorellana L.) em secador convectivo de leito fixo. Revista Brasileira de Produtos Agroindustriais, 2(1), 73-86. http://dx.doi.org/10.15871/1517-8595/rbpa.v2n1p73-86.
Gurak, P. D., Cabral, L. M. C., Rocha-Leão, M. H. M., Matta, V. M., & Freitas, S. P. (2010). Quality evaluation of grape juice concentrated by reverse osmosis. Journal of Food Engineering, 96(3), 421-426. http://dx.doi.org/10.1016/j.jfoodeng.2009.08.024.
Khoyi, M. R., & Hesari, J. (2007). Dsmotic dehydration kinetics of apricot using sucrose solution. Journal of Food Engineering, 78(4), 1355-1360. http://dx.doi.org/10.1016/j.jfoodeng.2006.01.007. Le Bourse, D., Jégou, S., Conreux, A., Villaume, S., & Jeandet, P. (2010).
Review of preparative and analytical procedures for the study of proteins in grape juice and wine. Analytica Chimica Acta, 667(1-2), 33-42. http://dx.doi.org/10.1016/j.aca.2010.03.062. PMid:20441863. Lewicki, P. P., & Lenart, A. (2006). Dsmotic dehydration of fruits and
vegetables. In A. S. Mujumdar (Ed.), Handbook of industrial drying
(3rd ed., pp. 665-687). Boca Raton: CRC Press.
Lima, A. S., Figueiredo, R. W., Maia, G. A., Lima, J. R., Souza, M. A., No., & Souza, A. C. R. (2004). Estudo das variáveis de processo sobre a cinética de desidratação osmótica de melão. Ciência e Tecnologia de Alimentos, 24(2), 282-286. http://dx.doi.org/10.1590/S0101-20612004000200021.
The values of the Page’s equation parameters present great variability in the literature because they were calculated from the time values expressed in hours, minutes or seconds. In pear osmotic dehydration at different temperatures, different concentrations of sucrose and without the application of vacuum, it were observed K values between 0.36 x 10⁻³ to 10.66 x 10⁻³ s–1
and n from 0.11 to 0.89 (Park et al., 2002). The drying rate constant K was higher for the process performed with grape juice (Table 4), indicating a higher moisture transfer rate from the material. The parameter “n” has a time moderating effect and corrects the possible errors resulting from the neglection of the internal resistance for moisture transfer (Guedes & Faria, 2000) and it was similar for both DD process (Table 4).
Water activity, moisture and soluble solids content
A higher reduction in the water activity of the melon was observed with the use of grape juice concentrate as a result of the high water loss of the melon (Figure 2). For this process, the value of the water activity of the melon decreased from 0.9911 to 0.9244 after 120 minutes of the process, a significantly higher variation than the one observed with sucrose solution (0.9911 to 0.9620). The moisture content decreased from 90 to 57.5% (Figure 2) and the soluble solids content increased from 9 to 40.2 ± 2 g/100 g of fresh melon (Figure 2) after 120 minutes process with grape juice concentrate.
Minimum values of aw for growth of several common
microorganisms of significance to health and for toxin production are listed by Taoukis & Richardson (2008). The value of aw achieved in melon dehydrated with grape juice concentrate (aw = 0.92) is below the growth threshold of Bacillus cereus, Clostridium botulinum, Clostridium perfringens and Escherichia coli. The ability of a microorganism to grow in a given environment is not determined exclusively by the aw but also depends on the complex interactions of several other factors, including temperature, pH, oxidation-reduction potential, preservatives, and competitive micro flora (Taoukis & Richardson, 2008). According to the hurdle concept, all of these factors concern the barriers for cell growth. Thus, the melon dehydrated with grape juice concentrate would have two barriers for the growth of microorganisms: low water activity and low pH, taking into account that the acids present in grape juice were impregnated in the melon matrix. The acids besides decreasing the rate of biochemical reactions also contribute to final product taste. A subsequent drying of the material, its cooling or chemical agent addition may be used in order to extend its shelf life.
4 Conclusion
Raoult-Wack, A. L. (1994). Recent advances in the osmotic dehydration of foods. Trends in Food Science & Technology, 5, 255-260. http:// dx.doi.org/10.1016/0924-2244(94)90018-3.
Rastogi, N., Raghavarao, K., Niranjan, K., & Knorr, D. (2002). Recent developments in osmotic dehydration: methods to enhance mass transfer. Trends in Food Science & Technology, 13(2), 48-59. http:// dx.doi.org/10.1016/S0924-2244(02)00032-8.
Silva, F. D., Mata, M. E. E. M. C., Duarte, M. E. M., Souza, J. A., & Silva, Y. C. e. (2003). Desidratação osmótica de banana da terra (musa sapientum) aplicação de modelos matemáticos. Revista Brasileira de Produtos Agroindustriais, 1, 69-76. http://dx.doi.org/10.15871/1517-8595/rbpa.v5nEspecialp69-76.
Sritongtae, B., Mahawanich, T., & Duangmal, K. (2011). Drying of osmosed cantaloupe: effect of polyols on drying and water mobility.
Drying Technology, 29(5), 527-535. http://dx.doi.org/10.1080/073 73937.2010.513615.
Taoukis, P. S., & Richardson, M. (2008). Principles of intermediate-moisture foods and related technology. In G. V. Barbosa-Cánovas, A. J. Fontana & S. J. Schmidt (Eds.), Water activity in foods: fundamentals and applications (pp. 273-312). Hoboken: John Wiley & Sons. Yadav, A. K., & Singh, S. V. (2014). Dsmotic dehydration of fruits
and vegetables: a review. Journal of Food Science and Technology, 51(9), 1654-1673. http://dx.doi.org/10.1007/s13197-012-0659-2. PMid:25190823.
Mato, I., Suárez-Luque, S., & Huidobro, J. F. (2005). A review of the analytical methods to determine organic acids in grape juices and wines. Food Research International, 38(10), 1175-1188. http://dx.doi. org/10.1016/j.foodres.2005.04.007.
Nishiyama, K., Guis, M., Rose, J. K. C., Kubo, Y., Bennett, K. A., Wangjin, L., Kato, K., Ushijima, K., Nakano, R., Inaba, A., Bouzayen, M., Latche, A., Pech, J.-C., & Bennett, A. B. (2007). Ethylene regulation of fruit softening and cell wall disassembly in Charentais melon. Journal of Experimental Botany, 58(6), 1281-1290. http://dx.doi.org/10.1093/ jxb/erl283. PMid:17308329.
Nowacka, M., Tylewicz, U., Laghi, L., Dalla Rosa, M., & Witrowa-Rajchert, D. (2014). Effect of ultrasound treatment on the water state in kiwifruit during osmotic dehydration. Food Chemistry, 144, 18-25. http://dx.doi.org/10.1016/j.foodchem.2013.05.129. PMid:24099537. Panarese, V., Tylewicz, U., Santagapita, P., Rocculi, P., & Dalla Rosa,
M. (2012). Isothermal and differential scanning calorimetries to evaluate structural and metabolic alterations of osmo-dehydrated kiwifruit as a function of ripening stage. Innovative Food Science & Emerging Technologies, 15, 66-71. http://dx.doi.org/10.1016/j. ifset.2012.04.001.
Park, K. J., Bin, A., Pedro, F., Brod, R., Hae, T., & Brandini, K. (2002). Dsmotic dehydration kinetics of pear D’ anjou (Pyrus communis