(Annals of the Brazilian Academy of Sciences)
Printed version ISSN 0001-3765 / Online version ISSN 1678-2690 www.scielo.br/aabc
Rheological and some physicochemical characteristics
of selected floral honeys from plants of caatinga
FRANCISCO K.G. SANTOS, ANTONIO N. DANTAS FILHO, RICARDO H.L. LEITE, EDNA M.M. AROUCHA, ANDARAIR G. SANTOS and THIAGO A. OLIVEIRA
Departamento de Agrotecnologia e Ciências Sociais, Universidade Federal Rural do Semi-Árido/ UFERSA, Avenida Francisco Mota, 572, Bairro Costa e Silva, 59625-900 Mossoró, RN, Brasil
Manuscript received on March 18, 2013; accepted for publication on December 10, 2013
ABSTRACT
The aim of this paper was to investigate the physicochemical characteristics and rheological behavior of some floral honeys from species of wild plants found in the Caatinga biome, as well as, correlate honey viscosities with its chemical composition. Thus, five honeys with floral predominance of typical plants foraged by honeybees in Caatinga were analyzed. Results showed that moisture content of honeys ranged from 17.45 to 21.50 g/100g. The samples exhibited higher fructose content (37.58 - 43.95 g/100g) and lower glucose content (27.41- 33.80 g/100g). The glucose-water ratio ranged from 1.55 to 1.80. Sucrose contents, excluding Croton campestris honey sample, exhibited values above the highest sucrose content (6.0 g/100g) allowed by Brazilian norm. The ash content ranged from 0.02 to 0.19 %. The insoluble solids content were above 0.1 g/100 g. The electrical conductivity ranged between 144.90 and 412.55 μS.cm-1. All the honey samples behaved as Newtonian fluids. The viscosity values, measured at 293 K, varied from 1.90 to 8.55 Pa.s. An empirical mathematical model adapted from the Arrhenius model provides a good description of honey viscosity as a function of combined effects of temperature and moisture content.
Key words: Arrhenius model, glucose, moisture, rheology, viscosity.
Correspondence to: Francisco Klebson Gomes dos Santos
E-mail: [email protected]
INTRODUCTION
Honey is the natural sweet substance produced by honey bees from the nectar of plants or from secretions of living parts of plants or excretions of plant sucking insects on the living parts of plants, which the bees collect, transform by combining with
specific substances of their own, deposit, dehydrate,
store and leave in the honey comb to ripen and mature (Codex Alimentarium Comission - CAC 2001).
The composition of honey is responsible for many of its physicochemical properties, such as
viscosity, hygroscopicity, and granulation. We could say that honey is essentially a concentrated solution of various sugars, mainly glucose and fructose. In fact, most honeys are supersaturated solutions of glucose, which have a tendency to crystallize spontaneously at room temperature in the form of glucose monohydrate. The composition
and properties of honey vary with the floral and
honeydew sources utilized by honeybees, as well as by regional and climatic conditions (Lazaridou et al. 2004).
The Caatinga is a biome, which occurs exclusively in the Northeastern Region of Brazil
and covers approximately 10% of the Brazilian territory. Thus, the Caatinga scrub is the largest dry forest region in South America, characterized by a semi-arid climate, low and irregular rainfall, fertile soils and mostly dry vegetation. The climate of the Caatinga is extremely seasonal and severe droughts are relatively frequent. Rainfall is more intensive in February, March and April. Occasional rain occurs in June and July, whereas the dry season extends from August to January (Machado and Lopes 2004, Roque et al. 2009). In spite of
the hard climatic conditions, Caatinga flora is a
rich and very important source of food to bees that occur in the region. Santos et al. (2005) prepared a list of thirteen species vital for apiculture in the Northeastern Region of Brazil. These authors reported the importance of the genus Croton,
Hytpis and Richardia for honey production in the Brazilian Northeastern region. Recently, Maia-Silva et al. (2012) presented a list of various native plants of the Caatinga visited by honeybees.
Brazil occupies the 12th place in the world´s ranking of honey production, with a production of 41.6 thousand tons of honey/year in 2011 (FAO 2011); while beekeeping in the Northeastern Region of Brazil is responsible for 34.4% of all honey
produced in the country (IBGE 2011). So far, there
are relatively few researches about quality of honeys produced in the Northeast of Brazil, especially
concerning honeys from specific floral species found
in the Caatinga biome. Nevertheless, some authors have reported physicochemical characteristics of
honeys from floral species of the Caatinga (Sodré
et al. 2007, 2011, Moreti et al. 2009, Liberato et al. 2013, Costa et al. 2013).
Studies on rheological behaviors of honeys,
like other fluid foods, are important for applications
related to handling, storage, processing, quality control, and sensory analysis (Yoo 2004). Moreover, honey rheology has been correlated with
its chemical composition (Gómez-Díaz et al. 2009,
Bakier 2007). Several researchers have studied
the rheological behavior of honey from different countries (Bhandari et al. 1999, Abu-Jdayil et al. 2002, Sopade et al. 2002, Pereira et al. 2003, Yoo 2004, Lazaridou et al. 2004, Juszczak and Fortuna
2006, Kayacier and Karaman 2008, Cohen and Weihs 2010, Schellart 2011, Kabbani et al. 2011).
Juszczak and Fortuna (2006) studied the rheological properties of seven varieties of Polish
honeys, over a temperature range of 283-313 K.
The honeys had a moisture content of 14.7–18.0 g/100 g. The viscosity curves of the samples were obtained using a rotational rheometer. All the honeys exhibited Newtonian behavior. Their viscosity varied between 1.76 and 252.6 Pa.s according to the kind of honey and the temperature of measurement. The temperature dependence of viscosity was described using the Arrhenius equation and the Williams– Landel–Ferry (WLF) equation.
Cohen and Weihs (2010) studied the tempe-rature and composition dependence of honey viscosity in selected Israeli varieties. Honey
behaved as a Newtonian fluid, even in
reduced-calorie varieties, and adhered to the Arrhenius equation. The Arrhenius activation energy and viscosity were moisture-dependent. They indicate that rheology agrees with microrheology, as expected for a Newtonian liquid and the high viscosity samples can be accurately characterized using particle-tracking microrheology, providing additional information to rheology.
Newtonian behavior. The viscosity of glucose syrup decreases exponentially with the increase in moisture content. The density investigations show that the density of glucose syrup and honey decreases linearly with temperature increasing in
the range of 283 to 343 K.
Kabbani et al. (2011) studied samples of crystallized honey that were liquefied by an
ultrasonic bath of 40 kHz at temperatures between
313 and 333 K for 20, 40 and 60 min. Then, the
rheological properties and crystal content were analyzed and compared to only heat-treated samples. Results showed that an ultrasound treatment speeds up the liquefaction of honey
especially at temperatures below 323 K. Lower
temperatures preserve the honey’s quality and save the energy consumption. In addition, ultrasound treated samples are clearer and more transparent than only heat-treated honey samples. The amount and size of the crystals were also smaller in the ultrasound treated samples.
Research describing the rheological behavior
of honey samples from floral species of the
Caatinga are not frequent. Queiroz et al. (2007) studied honeys from Serjania glabrata, produced
in the state of Piauí in Brazil and observed an
unusual pseudoplastic behavior for these honeys. Furthermore, Pereira et al. (2003) reported pseudoplastic and dilatant behavior for honeys of Melipona scutellaris produced in the state of
Paraíba, in Brazil. Recently, Costa et al. (2013)
published results showing a Newtonian behavior for honeys from the Central Region of the state of
Rio Grande do Norte State, in Brazil.
Therefore, the aim of this paper was to investigate the physicochemical characteristics and rheological behavior of some honeys from species of wild plants found in the Caatinga biome, as well as, correlate honey viscosities with
its chemical composition. Thus, five honeys with floral predominance of typical plants foraged by
honeybees in the Caatinga biome were analyzed.
MATERIALS AND METHODS
SAMPLE COLLECTION
Five varieties of wild honeys from Apis melifera, harvested from the west Region of the state of Rio
Grande do Norte in Brazil were studied, with the following floral predominance: “Velame” (Croton campestris St. Kil.), “Mufumbo” (Combretum leprosum Mart.), “Bamburral” (Hyptis suaveolens
(L) Poit), “Marmeleiro” (Croton sonderianus Mull.
Arg) and “Jurema” (Mimosa tenuiflora (wild) Poiret). The honey samples were provided by the Regional Apicultural Cooperative from the city
of Mossoró, Brazil. Table I presents the floral and
geographical information about honey samples used in this work while honey harvesting sites are shown in Figure 1. All honeys were harvested in July/2010.
DYNAMIC RHEOLOGICAL MEASUREMENT
The rheological properties were measured using
a rotational rheometer (model RVTI, Brookfield, Germany). The measurements were performed
at a temperature range varying between 283 and
343 K. The spindle type was RV-2 and the spindle
speeds (shear rate in rpm) ranged from 20 to 80 rpm. Samples were stored in 11 mL glass jars and all viscosity measurements were undertaken in the sample container to avoid air bubble incorporation during sample transfer and handling. The viscosity curves of the honeys were drawn in the shear rate range 20 - 80 s-1 at temperatures from 283 to 343 K.
In addition, the viscosities versus shear time curves
were plotted at 293 K and a constant shear rate of
75 s-1. Rheological measurements were performed
in five replicates. The temperature dependence of
viscosity was described using the Arrhenius model:
η = η0 . e Ea
RT (1)
where η - viscosity (Pa.s), η0 - material constant
(Pa.s), Ea - flow activation energy (J/mol), R - gases
A model for the combined effects of the moisture content and the temperature on honey
viscosity was fitted to experimental data by
multivariate regression using a data analysis software system (StatSoft Inc 2004).
PHYSICOCHEMICAL PROPERTY MEASUREMENTS
The honey moisture was determined by measuring
refractive index at 293 K with an ATAGO
refrac-tometer (RT-90ATC, SAMMAR, Chine). The determination of glucose and fructose in honey samples was carried out by HPLC (Accela
600, Thermo Scientific, USA) using a REZEX Monosaccharide pre-column and column at 363 K,
with milli-Q water as eluent (1.0 mL min-1 flow rate)
and using refractive index for detection. The ash content, insoluble solids and electrical conductivity were determined according to the IHC methods described by Bogdanov et al. (1997). Ash content
was found by incinerating samples at 873 K in a muffle oven (3PS 3000, EDG, Germany). The
insoluble solids were measured solving the honeys in
water at 353 K. The solution was filtered on a porous funnel and dried at 408 K for one hour. The electrical Floral
predominance
1
Geographical origin
2
Mean annual precipitation (mm)
2
Average annual temperature (°C)
3
Soil characteristics
Croton sonderianus
(“Marmeleiro”) (06°02'02" S and 37°01'12" O)Jucurutu 560.6 28.1
High fertility, sandy/clayey texture with a rocky phase
Mimosa tenuiflora
(“Jurema”) (06°06'39" S and 38°18'21" O)Encanto 398.3 28.1
High fertility, medium texture and highly dried
Combretum leprosum
(“Mufumbo”) (05°57'21" S and 37°42'21" O)Olho D’água dos Borges 535.0 27.7
Medium to high fertility, sandy texture with rocky
phase, slightly dried
Croton campestris
(“Velame”) (05°52'01" S and 37°11'20" O)Triunfo Potiguar 516.6 28.1
High fertility, sandy/clayey texture with a rocky phase
Hyptis suaveolens
(“Bamburral”) (05°59’27” S and 37°48’50” O)Umarizal 376.4 27.7 texture and highly driedHigh fertility, medium
TABLE I
Floral and geographical information for honey samples.
1sites of Rio Grande do Norte State of Brazil where honey samples were harvested (coordinates). 2Sources: EMPARN (2013), 3IDEMA (2006).
conductivity was measured with a condutivimeter (MCA 150, Tecnopon, Brazil) in a solution of 20%
(w/v) of honey at 293 K. The physicochemical
analyses were performed in triplicates.
RESULTS AND DISCUSSION
PHYSICOCHEMICAL CHARACTERISTICS
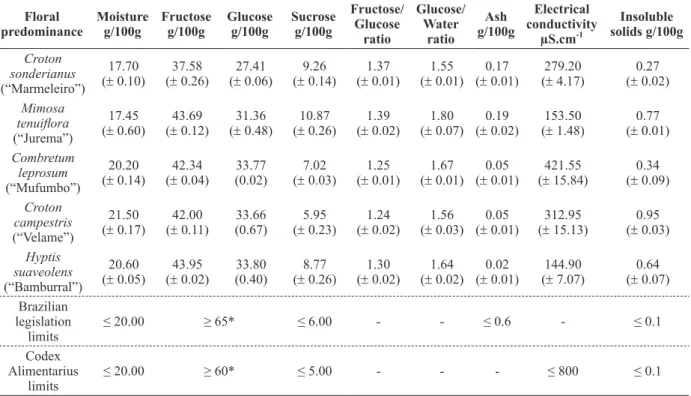
Table II shows the results of moisture content, fructose, glucose, sucrose, fructose-glucose ratio, glucose-water ratio, ash content, electrical conduc-tivity and insoluble solids of the honey samples.
The water content is a quality parameter
important specifically for honey shelf life. It has a
minor importance for the characterization of honeys. However, depending on the production season and the climate, honeys show some typical differences in water content, which affect the physical properties of
honey (viscosity, crystallisation) and also influence
the value of the glucose-water ratio (Bogdanov et al. 2004). Moreover, moisture content below 18.0 g/100g guarantees a successful storage of honey samples (Bogdanov et al. 2005). In this work, the moisture content of honey samples ranged from 17.45 to 21.50 g/100g, while the maximum allowed by Brazilian norm (Brasil 2000) and International Codex (CAC 2001) standards for honey from
Apis mellifera is 20 g/100g. The honey samples from Combretum leprosum, Croton campestris and
Hyptis suaveolens presented higher moisture content than the maximum limit established by legislation. Lazaridou et al. (2004) found that moisture content
in Greek honey varied greatly from 13 to 29 g/100g.
In addition, Chinese honey has exhibited higher moisture content – in the range of 19.8 to 29.0 g/100g (Junzheng and Changying 1998). In Brazil, Marchini et al. (2007) found that various honey samples from the state of São Paulo do not comply with the quality regulations for Brazilian honey. Costa et al. (2013) measuring moisture content of honeys harvested in the central region of the state
of the Rio Grande do Norte observed a variation
from 17.2 to 21.6 g/100g. There are several possible explanations for the high moisture content found in the honey samples in our work. It could be that the honeys samples were harvested prior to complete maturation from uncapped frames or that honeys absorbed moisture from environment during storage period; furthermore, moisture
content of honey can vary according to the floral
and geographical origin, climate conditions and honeybee type (Nanda et al. 2003).
Sugars are the main constituents of honey, comprising about 95% of honey dry weight. The relative amount of the two monosaccharides, fructose and glucose, is useful for honeys
classi-fication, as well as the fructose-glucose and
glucose-water ratios (Bogdanov et al. 2004). All honey samples analyzed in this work showed a higher sum of fructose and glucose contents than the lowest limit established by Brazilian and international norms, respectively 60 and 65 g/100g of fructose plus glucose contents. It was possible to detect higher fructose content (37.58 - 43.95 g/100g) and lower glucose content (27.41- 33.80 g/100g) in honey samples. Moreira (2001) studying a lot of honey samples from the USA reported similar results on glucose and fructose mean contents of 31.28 and 38.19 g/100g, respectively. Australian honeys presented fructose content varying from 31.0 to 44.9 g/100g and glucose content varying from 23.9 to 33.0 g/100g (Sopade et al. 2004). Furthermore, a study on various European honeys was published by Persano-Oddo and Piro (2004), where glucose content ranged from 23.9 to 40.5 g/100g and fructose content varied from 31.6 to 42.7 g/100g. The high glucose content becomes honey more conducive to crystallize due to the lower water
solubility of glucose (Gleiter et al. 2006).
In this work, the fructose-glucose ratio varied from 1.24 to 1.39 for the studied honey samples. Moreover, honeys from Croton sonderianus and
tendency of honey. Honey samples, which do not crystallize for a long time, have a fructose-glucose ratio higher than 1.33 (White 1978). If the fructose-glucose ratio is less than 1.11, honey crystallizes quickly. Commonly, honey presents a fructose-glucose ratio above 1.0, but some honeys may present lower values. For example, fructose-glucose ratios varying between 0.95 and 1.61 were reported in European honeys (Persano-Oddo and Piro 2004); while it was reported ranging between 1.0 and 1.2 in Nepalese honeys (Joshi et al. 2000).
A glucose-water ratio ranging from 1.55 to 1.80 was observed in honey samples analyzed in this work. Persano-Oddo and Piro (2004) described a glucose-water ratio spreading between 1.51 and 2.37 in European honeys. Similarly, glucose-water ratio may also be used to evaluate the honey propensity to crystallize. So, a glucose-water ratio above 1.7 means a high probability of the honey to crystallize (Bogdanov et al. 2005).
Concerning sucrose contents, excluding
Croton campestris honey sample (5.95 g/100g), samples exhibit values above the upper limit (6.0 g/100g) allowed by Brazilian norm (Brasil 2000) as shown in Table II. The high sucrose content can indicate that the honey was harvested before its
“ripening”, causing an incomplete transformation
of sucrose into fructose and glucose by action of the invertase enzyme secreted by bees (Azeredo et al. 1999).
The ash content of the samples ranged from 0.02 to 0.19 % (Table II). These values are within the range of values permitted by Brazilian norm, which allows maximum values of 0.6% (Brasil 2000). The average content of ashes were found to be similar to the study of Terrab et al. (2003), 0.19%, and lower than the values found in the honeys in
Turkey, 0.27% (Kayacier and Karaman 2008).
The ashes express the mineral content present in honey (Marchini et al. 2005), and is associated with
TABLE II
Physicochemical characteristics of honeys.
Floral predominance Moisture g/100g Fructose g/100g Glucose g/100g Sucrose g/100g Fructose/ Glucose ratio Glucose/ Water ratio Ash g/100g Electrical conductivity µS.cm-1 Insoluble solids g/100g Croton sonderianus (“Marmeleiro”) 17.70 (± 0.10)
37.58 (± 0.26)
27.41 (± 0.06)
9.26 (± 0.14)
1.37 (± 0.01)
1.55 (± 0.01)
0.17 (± 0.01)
279.20 (± 4.17)
0.27 (± 0.02)
Mimosa
tenuiflora
(“Jurema”)
17.45 (± 0.60)
43.69 (± 0.12)
31.36 (± 0.48)
10.87 (± 0.26)
1.39 (± 0.02)
1.80 (± 0.07)
0.19 (± 0.02)
153.50 (± 1.48)
0.77 (± 0.01)
Combretum leprosum (“Mufumbo”)
20.20 (± 0.14)
42.34 (± 0.04)
33.77 (0.02)
7.02 (± 0.03)
1.25 (± 0.01)
1.67 (± 0.01)
0.05 (± 0.01)
421.55 (± 15.84)
0.34 (± 0.09)
Croton campestris (“Velame”)
21.50 (± 0.17)
42.00 (± 0.11)
33.66 (0.67)
5.95 (± 0.23)
1.24 (± 0.02)
1.56 (± 0.03)
0.05 (± 0.01)
312.95 (± 15.13)
0.95 (± 0.03)
Hyptis suaveolens (“Bamburral”)
20.60 (± 0.05)
43.95 (± 0.02)
33.80 (0.40)
8.77 (± 0.26)
1.30 (± 0.02)
1.64 (± 0.02)
0.02 (± 0.01)
144.90 (± 7.07)
0.64 (± 0.07) Brazilian
legislation limits
≤ 20.00 ≥ 65* ≤ 6.00 - - ≤ 0.6 - ≤ 0.1
Codex Alimentarius
limits
≤ 20.00 ≥ 60* ≤ 5.00 - - - ≤ 800 ≤ 0.1
fertility of the soil in which the plant is located,
with the flora and with the bee species (Lachman
et al. 2007).
The results of insoluble solids content (Table III) were higher than 0.1 g/100 g (w/w), which is the maximum value permitted by Brazilian norm (Brasil 2000). According to Marchini et al. (2005) the analysis of insoluble solids is based on insolubility of wax, pollen and other insoluble components of the honey.
The electrical conductivity can be used as an additional method for determining the botanical source of the honey (Serrano et al. 2004) and depends on the content of minerals, organic acids, proteins and some sugars (Crane 1990). In accordance with Bognadov et al. (2004) electrical conductivity is the
most useful quality parameter for the classification
of honeys, which can be determined by relatively
inexpensive instrumentation. Our honey samples showed electrical conductivity ranging between 144.90 and 412.55 µS.cm-1. These results are below
the maximum limits (800 µS.cm-1) established by
the International Codex for honey (CAC 2001). However, Marchini et al. (2007), analyzing electrical conductivity of honey samples from the state of São Paulo, in Brazil, published ranges from 331.00 to 2865.00 µS.cm-1 for Eucalyptus honey,
from 160.71 to 2200.00 µS.cm-1 for wild honey, as
well as a range from 212.00 to 1089.70 µS.cm-1 for
Orange honey.
RHEOLOGICAL BEHAVIOR
Figure 2a shows the shear stress (τ) versus shear rate (γ), at 293 K , for honeys from Croton sonderianus,
Mimosa tenuiflora, Combretum leprosum, Croton campestris and Hyptis suaveolens.
Figure 2 -(a) Shear stress versus shear rate, at 293 K, of honey samples; (b) Viscosity variation as function of shear
rate of honey samples.
Upon analyzing Figure 2, it was observed that all honey samples behaved as Newtonian
fluids. These results are in agreement with most
literature data, where honey from different origins have been reported as following Newtonian
behavior (Kabbani et al. 2011, Bakier 2007,
Yanniotis et al. 2006, Lazaridou et al. 2004, Abu-Jdayil et al. 2002). However, results indication of non-Newtonian behavior for some honeys, have also been published. For example, some
Lithuanian honeys (Stelmakiené et al. 2012) and
2011) were found to exhibit thixotropic behavior; dilatancy was reported in Nigerian honeys (Opuntia engelmanni) and in Eucalyptus honeys (White
1978); while Galician honeys (Gómez-Díaz et al. 2009) and German honeys (Smanalieva and
Senge 2008) were characterized as pseudoplastic
fluids. Furthermore, Brazilian honeys harvested
from different states of the northeastern region of the country, have been described as presenting Newtonian (Costa et al. 2013) or pseudoplastic behavior (Queiroz et al. 2007).
Rheology of honeys may inform something about its composition. So, thixotropy is thought to be associated to proteins in the honey; whereas the presence of high-molecular weight dextran
in honey can cause dilatancy (White 1978); and Newtonian behavior usually is expected for a concentrated solution of low molecular weight compounds, indicating absence of macromolecules and/or particles in suspension. Moreover, according to El-Bialee and Sorour (2011), unusual non-Newtonian pseudoplastic behavior in honeys can signify the addition of foreign substances to honey such as molasses or starch.
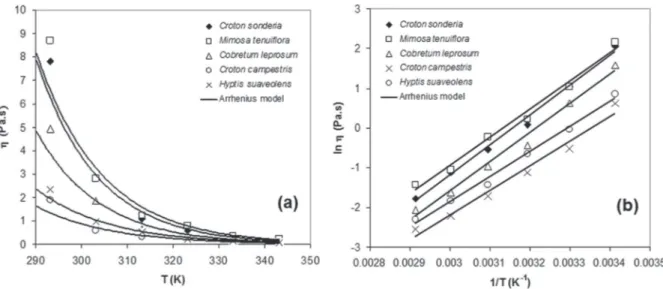
Figure 3 shows the honey viscosities
depen-dence of the temperature and the fitting of the
Arrhenius model to experimental data (Equation 1). Regarding the temperature (T) dependence of
viscosity (η), as expected, the viscosity decreases with
temperature rise (Figure 3a). In order to assess the
Figure 3 - Honey viscosities dependence of temperature and fitting of model to experimental data by non-linear Arrhenius equation (a) and linearized Arrhenius equation (b).
temperature sensitivity of honeys viscosity, data were
fitted using Arrhenius model. This model adequately
described the relationship between honeys viscosity and temperature for all studied honeys. The fact that temperature dependence of honey viscosity agrees with Arrhenius model has been observed by several
researchers (Zaitoun et al. 2001, Lazaridou et al. 2004,
Queiroz et al. 2007, James et al. 2009, Oroian 2012). Figure 2b shows the linear relationship of ln(η) vs. (1/T) obtained from the linearization of
Arrhenius equation and fitted to experimental
data. The pre-exponential factor (η0) of Arrhenius
model (ie., value of viscosity as temperature
approaches infinity) and activation energies (Ea)
were estimated, respectively, from the intercept and slope of straight lines obtained by the least square regression.
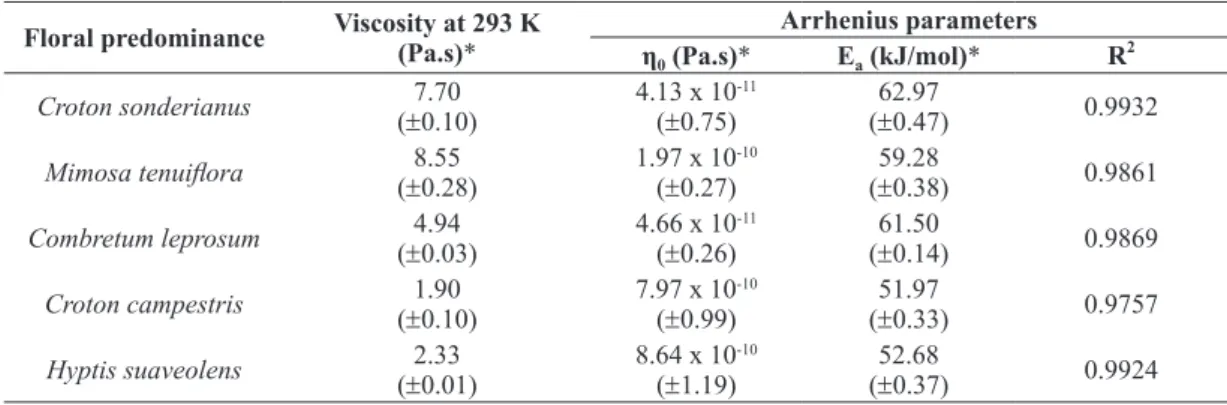
Table III resumes the results of Arrhenius parameters (η0 and Ea), correlation coefficient (R2)
The viscosity values, measured at 293 K, of
the honeys studied in this work varied from 1.90 to 8.55 Pa.s. This viscosity range presents no greater difference to the Costa et al. (2013) results that show a viscosity varying from 0.49 to 6.65 Pa.s in honeys harvested in the central region of the
state of Rio Grande do Norte, in Brazil. Moreti
et al. (2009) found that viscosities vary from 0.36
to 6.77 Pa.s while Sodré et al. (2007) obtained a
more limited viscosity range (0.54 to 2.08 Pa.s), to honeys produced in the state of Ceará, in Brazil.
Sodré et al. (2011) reported a range of viscosities
from 0.96 to 2.97 Pa.s in honey samples from the
Picos region, state of Piauí, Brazil.
In order to better compare our results with literature data, Figure 4 shows viscosity ranges of honeys from Brazil and others countries reported by several authors.
It can be noted in Figure 4 that viscosity range of honeys from the west region of the state of Rio
Grande do Norte (Brazil) is in accordance with
viscosity ranges reported for Brazilian honeys by several researchers. Some exceptions were observed in viscosity ranges related to honeys studied by L.L. Pereira (unpublished data), which attain higher values than others Brazilian honeys. Honeys from Spain (Orian et al. 2013), Australia (Sopade et al.
2003), India (Kumar and Mandal 2009) and Turkey (Kayacier and Karaman 2008) have presented
higher viscosities than most Brazilian honeys, except for those related by L.L. Pereira (unpublished
data). However, in Jordanian honeys (Zaitoun et
al. 2001) viscosity ranged from 28.3 to 78.5 Pa.s,
while in Greek honeys (Lazaridou et al. 2004)
there was considerable variation in the observed values for viscosity (9.9 to 200 Pa.s). This great variation observed in honey viscosities around the world can be explained because viscosity is greatly affected by composition parameters, such as water,
Floral predominance Viscosity at 293 K (Pa.s)* Arrhenius parameters
η0 (Pa.s)* Ea (kJ/mol)* R 2
Croton sonderianus 7.70
(±0.10)
4.13 x 10⁻¹¹ (±0.75)
62.97
(±0.47) 0.9932
Mimosa tenuiflora (±8.550.28) 1.97 x 10(±0.27)-10 (±59.280.38) 0.9861
Combretum leprosum 4.94
(±0.03)
4.66 x 10⁻¹¹ (±0.26)
61.50
(±0.14) 0.9869
Croton campestris 1.90
(±0.10)
7.97 x 10⁻¹⁰ (±0.99)
51.97
(±0.33) 0.9757
Hyptis suaveolens 2.33
(±0.01)
8.64 x 10⁻¹⁰ (±1.19)
52.68
(±0.37) 0.9924
TABLE III
Arrhenius model parameters and viscosities at 293 K for honey samples.
*average (standard deviation), n = 5.
sugars and protein contents, which change with the
geographical and floral origins of each honey.
The activation energy, Ea, as described
by Arrhenius Model, has proven to be a most valuable parameter in investigating the temperature sensitivity of the samples for comparison purposes (Sopade et al. 2003). However, if a lot of papers
report data on honeys viscosities at a specified temperature (i.e. 293 K), there are less literature
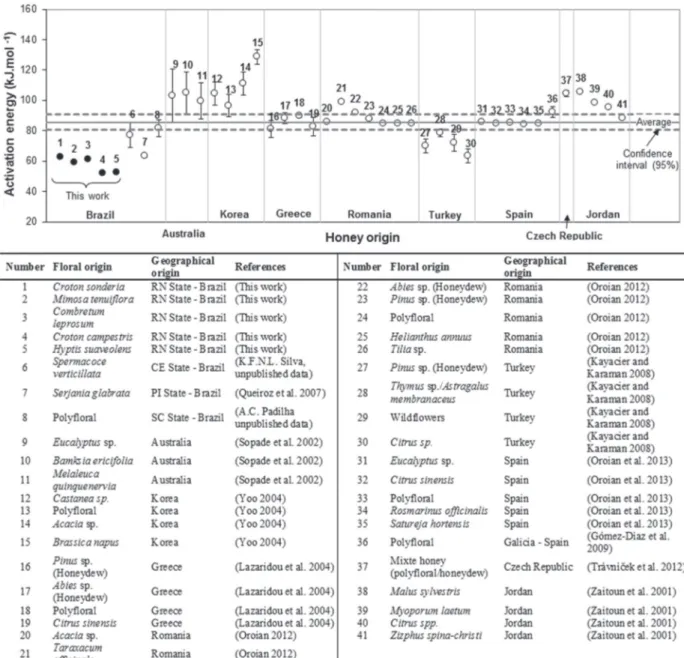
data about activation energy of honeys particularly for Brazilian honeys. Figure 5 shows activation energy values for forty-one honeys from different
floral and geographical origins as reported by
several authors around the world.
Figure 5 - Activation energies of honeys from different geographical and floral origins as reported by some authors (The dots mean
The average and standard deviation of the activation energy for the forty-one honeys, presented in Figure 5, were 85.6 and 16.4 kJ.mol-1,
respectively. The activation energies for honeys samples analyzed in this work are below the average for the forty-one honeys reported in literature (see Figure 5). Despite that, the activation energies observed in this work were similar in
values to others Brazilian honeys (K.F.N.L. Silva
unpublished data, Queiroz et al. 2007, A.C. Padilha unpublished data) as well as some Turkish honeys
(Kayacier and Karaman 2008).
COMBINED EFFECTS OF MOISTURE CONTENT AND
TEMPERATURE ON HONEY VISCOSITY
The viscosity of honey samples can be described as an exponential function of moisture content of the samples. So, it is possible to describe the empirical dependence of honey viscosities with moisture content in the form of the Equation 2:
η = a1 . e‒b1.W (2)
Where, η is the honey viscosity (Pa.s), W is the moisture content of honey (g/100g), a1 and b1 are the constants of the equation 2; then the equation can be written in a linear form as shown in Equation 3:
1n η = 1n a1 ‒ b1. W (3)
Figure 6 shows Equation 3 fits to experimental
data at studied temperatures.
The correlation coefficient, R2, for fittings
shown in Figure 6 varied from 0.853 to 0.958, showing the good agreement of the model described by Equation 2 with the experimental data.
The Arrhenius model can be combined with Equation 2 to obtain a way of describing honey viscosity including either temperature as well as moisture content dependences, Equation 4:
η = f (T,W) = a2 .e Ea
‒b2.W
RT (4)
Where, T is absolute temperature (K), Ea is
activation energy (J.mol-1), R is gases constant (8.314 J.mol-1.K-1), W is the moisture content
(g/100g), a2 and b2 are empirical constants from
Equation (4).
Experimental data were fitted to Equation (4) by
multivariate regression using Statistica 7.0 (StatSoft Inc 2004). However, due to program requirements, Equation 4 was used in its linearized form:
In η = In a2 + Ea
R.T
‒1‒b
2.W (5)
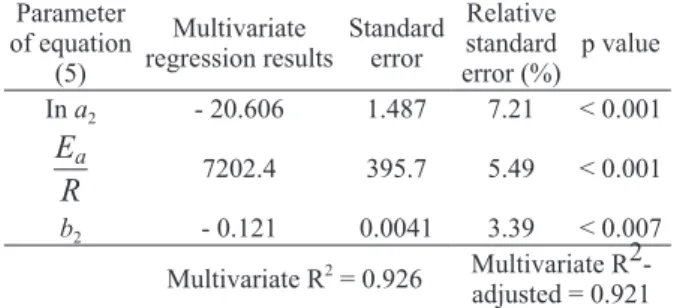
The multivariate regression enables us to
obtain values of coefficients from Equation 5. Table IV shows the models parameters calculated and
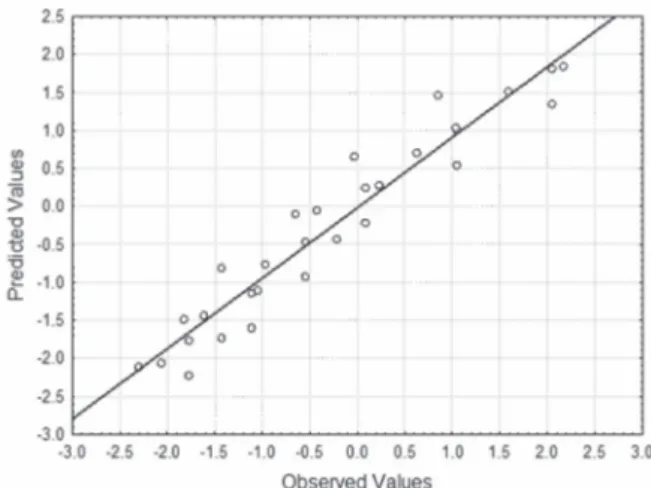
Figure 7 shows observed values versus predicted
values for ln η using Equation 5.
Figure 6 - Effect of moisture content on honey viscosity at various temperatures.
Parameter of equation
(5)
Multivariate regression results
Standard error
Relative standard error (%)
p value In a2 - 20.606 1.487 7.21 < 0.001
Ea
R 7202.4 395.7 5.49 < 0.001
b2 - 0.121 0.0041 3.39 < 0.007 Multivariate R2 = 0.926 Multivariate
R2-adjusted = 0.921
TABLE IV
Multivariate regression results of dependent variable
ln η with independent variables W (moisture content)
and T (absolute temperature) as described by equation (5).
As presented in table IV, the value of 0.926
to correlation coefficient R2 indicates that the
while Figure 7 shows a good agreement between predicted and observed values. In according with these results, we can conclude that the mathematical model adopted provides a good description of honey viscosity as a function of combined effects of temperature and moisture content.
CONCLUSION
Among the honey samples analyzed in this work, the highest moisture contents were observed in honeys from Combretum leprosum, Croton campestris and
Hyptis suaveolens while the lowest values were observed in honeys from Croton sonderianus and
Mimosa tenuiflora. Fructose was the main sugar found in all honey samples. Furthermore, high fructose-glucose ratios, ranging between 1.24 and 1.39, indicate a low tendency to crystallize in all analyzed honeys. However, honey samples from
Mimosa tenuiflora exhibited a high glucose-water ratio, 1.8 in mean, indicating that this honey has higher propensity to crystallize than others honeys studied in this work. Moreover, all honey samples
behaved as Newtonian fluids. The viscosities for analyzed honeys, at 293 K, were lower than
the values of viscosities reported for honeys from various countries around the world, but in accordance to values observed for several honeys
from Brazil. Honeys from Mimosa tenuiflora and
Croton sonderianus were the most viscous among analyzed honeys. Arrhenius model was suitable to describe temperature dependence of the viscosity for all investigated honeys. Higher activation energies were observed for honeys from Croton sonderianus
(62.97 kJ/mol) and Combretum leprosum (61.50 kJ/mol), but still lower than mean values reported by researchers on honeys from another countries. Honey viscosity rise exponentially with the decrease in moisture content and was adequately described as function of temperature and moisture content by a model combining the effect of these factors.
RESUMO
O objetivo deste trabalho foi investigar as características físico-químicas e o comportamento reológico de alguns méis florais de espécies de plantas silvestres encontradas no bioma caatinga, assim como, correlacionar as viscosidades dos méis com sua composição química. Neste sentido, cinco méis com predominância floral de plantas típicas da caatinga visitadas por abelhas melíferas foram analisadas. Os resultados mostraram que o teor de umidade dos méis variou entre 17,45 e 21,50 g/100g. As amostras exibiram maiores teores de frutose (37,58 - 43.95 g/100g) e menores teores de glicose (27.41- 33.80 g/100g). A razão glicose/água variou entre 1,55 e 1,80. Os teores de sacarose, com exeção das amostras de mel de Croton campestris, exibiram valores acima do mais alto teor permitido pela legislação brasileira (6,0 g/100g). Os teores de cinza variaram entre 0,02 e 0,19%. Os teores de sólidos insolúveis ficaram acima de 0,1 g/ 100g. A condutividade elétrica variou entre 144,90 e 412,55 µS.cm-1. Todas as amostras de mel comportaram-se como fluidos Newtonianos. Os valores das viscosi-dades, medidos a 293 K, ficaram entre 1,90 e 8,55 Pa.s. Um modelo matemático empírico, adaptado do modelo de Arrhenius, fornece uma boa descrição da viscosidade dos méis como função dos efeitos combinados da temperatura e do teor de umidade.
Palavras-chave: modelo de Arrhenius, glicose, umidade, reologia, viscosidade.
Figure 7 - Observed values versus predicted values of ln η as
REFERENCES
ABU-JDAYIL B, GHZAWI A, AL-MALAH KIM AND ZAITOUN SJ.
2002. Heat effect on rheology of light and dark colored honey. J Food Eng 51: 33-38.
ALVES EM, SEREIA MJ, TOLEDO VAA, MARCHINI LC, NEVES CA, TOLEDO TCSOA AND ALMEIDA-ANACLETO D. 2011.
Physicochemical characteristics of organic honey samples of africanized honeybees from Parana River islands. Ciênc Tecnol Aliment 31: 635-639.
AZEREDO MAA, AZEREDO LC AND DAMASCENO JG.1999. Características físico-químicas dos méis do município de São Fidélis-RJ. Cienc Tecnol Aliment 19: 3-7.
BAKIER S. 2007. Influence of temperature and water content
on the rheological properties of Polish honeys. Pol J Food Nutr Sci 57: 17-23.
BHANDARI B, DARCY B AND CHOW S. 1999. Rheology of selected Australian honeys. J Food Eng 41: 65-68. BOGDANOV S, BIERI K, KILCHENMANN V AND GALLMAND P.
2005. Miels monofloraux suisses. APL forum, 1st edition, Schwarzenburgstrasse, Switzeland: APL editor, 55 p. BOGDANOV S, MARTIN P AND LULLMANN C. 1997. Harmonised
methods of the European honey commission. Apidologie (extra issue): 1-59.
BOGDANOV S, RUOFF R AND PERSANO-ODDO L. 2004.
Physic-chemical methods for the characterization of unifloral
honeys: a review. Apidologie 35: 4-17.
BRASIL. 2000. Ministério da Agricultura Pecuária e Abastecimento. Instrução Normativa 11, de 20 de outubro de 2000, Regulamento técnico de identidade e qualidade do mel. Diário Oficial, Brasília, 20 de outubro de 2000, Seção 001: 16-17.
CAC - CODEX ALIMENTARIUS COMMISSION. 2001. Revised Codex Standard for Honey. Codex Stan 12 1981, 2, 7 p. COHEN I AND WEIHS D. 2010. Rheology and microrheology
of natural and reduced-calorie Israeli honeys as a model for high-viscosity Newtonian liquids. J Food Eng 100: 366-371. COSTA PA, MORAES ICF, BITTANTE AMQB, SOBRAL JA,
GOMIDE CA AND CARRER CC. 2013. Physical properties of honeys produced in the Northeast of Brazil. Int J Food Stud 2: 118-125.
CRANE E. 1990. Bees and beekeeping-science, practice and world resources, London: Neinemann, Newnes, 614 p. EL-BIALEE NM AND SOROUR MA. 2011. Effect of adulteration
on honey properties. Int J Appl Sci Tech 1: 122-133. EMPARN. 2013. Monitoramento pluviometrico, 2013.
Avalaible at: <http://189.124.135.176/monitoramento/ monitoramento.php> (Accessed: July 2013).
FAO. 2011. Faostat, Retrieved from <faostat.fao.org/site/339/ defaultaspx> (Accessed: August 2013).
GLEITER RA, HORN H AND ISENGARD HD. 2006. Influence of
type and state of crystallization on the water activity of honey. Food Chem 96: 441-445.
GÓMEZ-DÍAZ D, NAVAZA JM AND QUINTÁNS-RIVEIRO LC.
2009. Effect of temperature on the viscosity of honey. Int J Food Prop 12: 396-404.
IBGE. 2011. Produção Pecuária Municipal: 2010. Rio de Janeiro: IBGE, 65 p.
IDEMA. 2006. Caracterização Territorio – Mapa Solos. Avalaible
at: <http://www.idema.rn.gov.br/governo/secretarias/idema/ anuario2006/caracterizacao_territorio>. (Accessed: July 2013).
JAMES OO, MESUBI MA, USMAN LA, YEYE SO, AJANAKU KO,
OGUNNIRAN KO, AJANI OO AND SIYANBOLA TO. 2009.
Physical characterisation of some honey samples from North-Central Nigeria. Int J Phys Sci 4: 464-470.
JOSHI SR, PECHHACKER H, WILLAM A AND OHE W. 2000.
Physic-chemical characteristics of Apis dorsata, A. cerana
and A. mellifera honey from Chitwan district, central Nepal. Apidologie 31: 367-375.
JUNZHENG P AND CHANGYING J. 1998. General rheological
model for natural honeys in China. J Food Eng 36: 165-168. JUSZCZAK L AND FORTUNA T. 2006. Rheology of selected
Polish honeys. J Food Eng 75: 43-49.
KABBANI D, SEPULCRE F AND WEDEKIND J. 2011.
Ultrasound-assisted liquefaction of rosemary honey: Influence on
rheology and crystal content. J Food Eng 107: 173-178.
KAYACIER A AND KARAMAN S. 2008. Rheological and some physicochemical characteristics of selected turkish honeys. J Food Sci 39: 17-27.
KUMAR JS AND MANDAL M. 2009. Rheology and thermal properties of marketed Indian honey. Nutr Food Sci 39: 111-117.
LACHMAN J, KOLIHOVÁ D, MIHOLOVÁ D, KOSATA J, TITERA
D AND KULT K. 2007. Analysis of minority honey components: Possible use for the evaluation of honey quality. Food Chem 101: 973-979.
LAZARIDOU A, BILIADERIS CG, BACANDRITSOS N AND
SABATINI AG. 2004. Composition, thermal and rheological
behavior of selected Greek honeys. J Food Eng 64: 9-21.
LIBERATO MCTC, MORAIS SM, MAGALHÃES CEC,
MAGALHÃES IL, CAVALCANTI DB AND SILVA MMO. 2013.
Physicochemical properties and mineral and protein content of honey samples from Ceará State, Northeastern Brazil. Food Sci Technol 33: 38-46.
MACHADO IC AND LOPES AV. 2004. Floral Traits and Pollination Systems in the Caatinga, a Brazilian Tropical Dry Forest. Ann Bot 94: 365-376.
MAIA-SILVA C, SILVA CI, HRNCIR M, QUEIROZ RT AND
IMPERATRIZ-FONSECA VL. 2012. Guia de plantas visitadas
por abelhas na caatinga, 1a ed., Fortaleza, CE: Editora
Fundação Brasil Cidadão, 191 p.
MARCHINI LC, MORETI ACCC AND OTSUK IP. 2007.
Physicochemical composition of Apis Mellifera L. honey samples from São Paulo state, Brazil. Quim Nova 30: 1653-1657.
MARCHINI LC, SODRÉ GS AND MORETI ACCC. 2005. Mel
brasileiro: composição e normas. Ribeirão Preto: ASP, 131 p.
MENDONÇA K, MARCHINI LC, SOUZA BA, A
LMEIDA-ANACLETO D AND MORETI ACCC. 2008.Caracterização físico-química de amostras de méis produzidas por Apis mellifera L. em fragmento de cerrado no município de
MOREIRA RFA. 2001. Glicídios no mel. Quim Nova 24: 516-525.
MORETI CCC, SODRÉ GS, MARCHINI LC AND OTSUK IP. 2009. Características físico-químicas de amostras de méis
de Apis mellifera L. do estado do Ceará, Brasil. Ciênc Agrotec 33: 191-199.
NANDA V, SARKAR B, SHARMA H AND BAWA A. 2003. Physic-chemical properties and estimation of mineral content in honey produced from different plants in Northern India. J Food Compos Anal 16: 613-619.
OROIAN M. 2012. Physicochemical and Rheological Properties of Romanian Honeys. Food Biophysics 7: 296-307. OROIAN M, AMARIEI S, ESCRICHE I AND GUTT G. 2013.
Rheological Aspects of Spanish Honeys. Food Bioprocess Technol 6: 228-241.
PEREIRA EA, QUEIROZ AJM AND FIGUEIREDO RMF. 2003. Comportamento reológico de mel da abelha uruçu
(Melipona scutellaris, L.). Rev Ciênc Ex Nat 5: 179-186. PERSANO-ODDO L AND PIRO R. 2004. Main European unifloral
honeys: descriptive sheets. Apidologie 35: 38-81. QUEIROZ AJM, FIGUEIREDO RMF, SILVA CL AND MATA
MERMC. 2007. Comportamento reológico de méis de florada silvestre. Rev Bras Eng Agric Amb 11: 190-194.
ROQUE AA, QUEIROZ RT AND LOIOLA MIB. 2009. Diversidade
Florística do Seridó Potiguar. In: FREIRE EMX. (Org.),
Recursos naturais das caatingas: uma visão multidisciplinar, Natal: EDUFRN, Natal-RN, Brasil, p. 11-49.
SANTOS FAR, OLIVEIRA AV, LIMA LCL, BARROS RFM,
SCHLINDWEIN C, MARTINS CF, CAMARGO RCR, FREITAS
BM AND KIILL LH. 2005. Apícolas. In: SAMPAIO EVSB, PAREYN FGC, FIGUEROA JM and SANTOS Jr AG (Eds), Espécies da flora nordestina com importância
econômica potencial. Recife: APNE, p. 15-26.
SCHELLART WP. 2011. Rheology and density of glucose syrup and honey: Determining their suitability for usage
in analogue and fluid dynamic models of geological processes. J Struct Geol 33: 1079-1088.
SERRANO S, VILLAREJO M, ESPEJO R AND JODRA M. 2004.
Chemical and physical parameters of Andalusian honey:
classification of Citrus and Eucalyptus honeys by
discriminant analysis. Food Chem 87: 619-625.
SMANALIEVA J AND SENGE B. 2009. Analytical and rheological
investigations into selected unifloral German honey. Eur
Food Res Technol 229: 107-113.
SODRÉ GS, MARCHINI LC, MORETI ACCC, OTSUK IP AND
CARVALHO CAL. 2011. Physico-chemical characteristics of honey produced by Apis Mellifera L in the Picos region,
state of Piauí, Brazil. R Bra Zootec 40: 1837-1843.
SODRÉ GS, MARCHINI LC, MORETI ACCC, OTSUK IP AND
LOPES CAL. 2007. Caracterização físico-química de amostras de méis de Apis Mellifera L (Hymenoptera: Apidae) do Estado do Ceará. Ciênc Rur 37: 1139-1144. SOPADE PA, HALLEY P, BHANDARI B, D’ARCY B, DOEBLER C
AND CAFFIN N. 2003. Application of the Williams–Landel– Ferry model to the viscosity–temperature relationship of Australian honeys. J Food Eng 56: 67-75.
SOPADE PA, HALLEY PJ, D´ARCY BR, BHANDARI B AND
CAFFIN N. 2004. Dynamic and steady-state rheology of Australian honeys at subzero temperatures. J Food Process Eng 27: 284-309.
STATSOFT INC. 2004. Statistica (data analysis software system), version 7.
STELMAKIENĖ A, RAMANAUSKIENĖ K, BRIEDIS V AND
LESKAUSKAITĖ D. 2012. Examination of rheological and physicochemical characteristics in Lithuanian honey. Afric J Biotech 11: 12406-12414.
TERRAB A, DIEZ MJ AND HEREDIA FJ. 2003. Palynological physicochemical and colour characterization of Moroccan honeys. II. Orange (Citrus sp.) honey. Int J Food Sci Technol 38: 387-394.
TRÁVNÍČEK P, VÍTĚZ T AND PŘIDAL A. 2012. Rheological properties of honey. Sci Agric Bohem 43: 160-165. WHITE JR JW. 1978. Honey. Adv Food Res 24: 288-354. WITCZAK M, JUSZCZAK L AND GAŁKOWSKA D. 2011.
Non-Newtonian behaviour of heather honey. J Food Eng 104: 532-537.
YANNIOTS S, SKALTSI S AND KARABURNIOTI S. 2006. Effect of moisture content on the viscosity of honey at different temperatures. J Food Eng 72: 372-377.
YOO B. 2004. Effect of temperature on dynamic rheology of
Korean honeys. J Food Eng 65: 459-463.
ZAITOUN S, GHZAWI AA, AL-MALAH KIM AND ABU-JDAYIL