Artigo
*e-mail: [email protected]
DETERMINATION OF POLYPHENOL CONTENTS AND ANTIOXIDANT CAPACITY OF NO-ALCOHOLIC RED GRAPE PRODUCTS (Vitis labrusca) FROM CONVENTIONAL AND ORGANIC CROPS
Michel Mansur Machado, Greice Franciele Feyh dos Santos Montagner, Aline Boligon, Margareth Linde Athayde, Maria Izabel Ugalde Marques da Rocha, Juan Pablo Barrio Lera, Caroline Belló e Ivana Beatrice Mânica da Cruz*
Universidade Federal de Santa Maria, Av. Roraima 1000, 97105-900 Santa Maria - RS, Brasil
Recebido em 29/6/10; aceito em 28/11/10; publicado na web em 25/2/11
The polyphenol contents and antioxidant capacity of Brazilian red grape juices and wine vinegars were analyzed. Additionally, it was analyzed the human polyphenol absorption and acute effect in plasmatic oxidative metabolism biomarkers after juice ingestion. The organic Bordo grape juice (GBO) presented a higher level of trans-resveratrol, quercitin, rutin, gallic acid, caffeic acid and total lavonoids then other juices and vinegars as well as antioxidant capacity. The plasmatic polyphenol increased 27.2% after GBO juice ingestion. The results showed that juices and vinegars from Brazilian crops present similar chemical and functional properties described in studies performed in other countries.
Keywords: Vitis labrusca; phenolic compounds; antioxidant effect.
INTRODUCTION
Grapes are probably the most important source of resveratrol for humans, since the compound is also found in one of the end products of grapes, i.e., wine. Many studies have suggested cardiovascular beneits, and some works have indicated cancer chemopreventive activity.1 Grape products (wine, juice, vinegar) are a rich source
of lavonoids which have signiicant biological activities including antioxidant effects.2
In addition, studies of the antioxidant potential of grapes and its products described in vitro and experimental models and human trials have largely yielded positive results, and the modulation of the biomarkers investigated in these works is known to correlate with disease prevention.3
However, because resveratrol is produced in response to ex-ogenous stress factors, the levels in grapes and its products are expected to vary between regions and vintages.4 Among the possible
environmental factors that affect the polyphenol content of grapes is the process of grape production. Despite the heterogeneity of the sample material, some differences in health-promoting compound levels between foods from conventional and organic agricultural practice have been identiied. Dani et al.5 described that in eight
Vitis labrusca juices, white and purple, from organically or conven-tionally grown grapes, organic juices showed higher levels of total polyphenols and resveratrol as compared with conventional grape fruits. Wine vinegar is largely produced in Mediterranean countries and in the southern region of Brazil, which was largely colonized by Italians. Previous studies have reported on the antioxidant proper-ties of wine vinegars.6
However, comparative studies of polyphenol concentration and biological activities, such as antioxidant effects, in non-alcoholic grape products such as juices and vinegars organically and conven-tionally produced need to be better explored as well as the possible association to its biological antioxidant effects.
The aim of this study was to determine the polyphenol content
and antioxidant capacity in red grape juices and wine vinegars from organically and conventionally grown grapes. Additionally, we tested the polyphenol absorption after red grape juice one serving drink using the juice that presented higher polyphenol and antioxidant levels and this effect on healthy human plasmatic oxidative biomarkers. EXPERIMENTAL
Samples and chemicals
The study was conducted to compare polyphenol content and antioxidant proprieties of four commercial organic grape products (red grape juice and vinegar) with that of three commercial red grape juices and three vinegars produced conventionally. These products were from Vitis labrusca. Organic red grape juices of the Bordo, Izabel and Concord varieties and conventional red grapes of the Bordo variety were investigated. All vinegars tested, from organic and conventional grape production, were of the Bordo variety.
The juices were obtained from commercial establishments and from Garibaldi, Caxias do Sul and Antonio Prado, which are cities in Rio Grande do Sul, Brazil, located in the grape growing region. Grapes were cultivated and the samples obtained and analyzed in 2007 and 2008 periods and the values described here its represent means± standard deviation (SD). The grape products were kindly donated by these wineries.
Polyphenols analysis
Juice samples were analyzed spectrophotometrically for the con-tent of total phenolics, using a modiied Folin-Ciocalteu colorimetric method.7 The estimation of phenolic compounds in the crude extract
and fractions was carried out in triplicate. The standard curve of gallic acid was prepared in the same manner and total polyphenol concen-tration was expressed as mean±SD mg of gallic acid equivalents per milliliter of grape juice or vinegar extract. The equation obtained for the standard curve of gallic acid in the range of 0.005-0.030 mg/mL was y = 34.357x – 0.0491 (R² = 0.9781).
High-performance liquid chromatography (HPLC) analysis was used to quantify the presence of individual phenolic compounds using an HPLC system consisting of a Shimadzu Prominence LC – 20A, with an LC-20AT quaternary pump, a SIL 20 auto sampler– A, a DGU-20A5 on-line degasser, a CBM-20A integrator and a SPD-20AV DAD detector.
Trans-resveratrol quantiication was performed according to Souto et al.8 using an octadecyl column, 250 mm long and 4.6 mm
i.d., with 5-µm particle diameter. Each sample was injected three times in the chromatographic system. For quantiication, a standard calibration curve was made, ranging from 0.10 to 10.0 mg/L of trans-resveratrol. The square regression coeficient of the analytical curve was near unity (R²=0.9879).
Simultaneous determination of quercitin and rutin was performed according to Zu et al.9 using standard solutions of these lavonoids
prepared in ethanol, in a concentration range of 18 to 280 µg/mL for quercetin and from 12.5 to 200 µg/mL for rutin. Quantiication was carried out by the integration of the peak using an external standard method. The linear regression coeficient for the rutin calibration curve was equal to one and for the quercetin calibration curve was also near unity (R²= 0.9968).
The simultaneous determination of gallic acid and caffeic acid was performed as described by Singh and Rajini.10 The linear
regres-sion coeficient for the gallic acid calibration curve was R²= 0.9703, and for the caffeic acid it was R²= 0.9890.
Determination of condensed tannins
To determine the content of tannins in the red grape juice and wine vinegar analyzed here, all samples were diluted with distilled water for the analyses. The concentration of total condensed tannins was measured spectrophotometrically by the modiied vanillin method, described by Ferreira and Nogueira.11 The estimation of condensed
tannins in the samples was carried out in triplicate. The contents were expressed as milligram equivalents of gallic acid/ mL of grape juice. The equation obtained for the standard curve of gallic acid in the range of 2.5-20 mg/mL was y = 0.0423x + 0.1362 (R² = 0.9849) Determination of total lavonoid content
The total lavonoid content of organic and conventional red grape juices and wine vinegars was determined by the reaction with aluminum chloride using the methods described by Zhishen et al..12
The total lavonoid content was calculated on the basis of the standard curve for quercetin solutions and expressed as quercetin equivalents in mg/100 g of sample.
Antioxidant capacity: radical-scavenging activity - DPPH assay
The antioxidant capacity of the grape juices crude extracts was evaluated by monitoring its ability to scaveng the stable free radical DPPH, according to a slightly modiied method previously described
by Choi et al..13 Spectrophotometric analysis (Shimadzu-UV-1201)
was used in order to determine the inhibition concentration (IC50) and the inhibition percentage (IP%) of the crude extract. The DPPH scavenging ability was expressed as IC50 (concentration which gives 50% inhibition). Six different ethanol dilutions of the crude extract (2.5 mL), at 250; 125; 62.5; 31.25; 15.62 and 7.81 µg/mL were mixed with 1.0 mL of a 0.3 mM DPPH ethanol solution. The absorbance was measured at 518 nm by spectrophotometer against a blank after 30 min of reaction at room temperature. DPPH solution (1.0 mL, 0.3 mM) plus ethanol (2.5 mL) was used as a control. Relative activi-ties were calculated from the calibration curve of L-Ascorbic acid standard solutions working in the same experimental conditions. Inhibition of free radical by DPPH in percent (IP%) was calculated in following way, according to the Equation 1:
IP% = 100 − [(ABSSAMPLE – ABSBLANK) / ABSCONTROL) X 100] (1) where ABSs ample is the absorbance of the test compound, ABS-BLANK is the absorbance of the blank (containing 1.0 mL of ethanol plus 2.5 mL of the plant extract solution) and ABScontrol is the absorbance of the control reaction (containing all reagents except the test compound). IP% was plotted against sample concentration, and a linear regression curve was established in order to calculate the IC50. Tests were carried out in triplicate.
Human study: one serving drink ingestion protocol
The Research Ethics Committee approved the study protocol (No.23081), and informed consent was obtained from all individu-als whose information was collected prospectively. To perform this protocol we realized the general chemical and nutritional analyses including alcoholic grade, pH, calorie values (kg/cal) carbohydrates, food iber, saturated fats, proteins and moisture levels for the red grape juice used determined according to the AOAC International oficial methods previously provided by juice producer. We selected subjects from Southern Brazil Genesis-Project which investigates gene-environmental interactions and age-related diseases in healthy aging and elderly free living community (n=2059)14,15 in this analysis
from the project databank we included just subjects aged <40 years old to avoid the possible inluence of age in the polyphenols absorp-tion and also excluded pregnant women.16
We selected 10 subjects to participate of the intervention proto-col to evaluate: (1) total polyphenol absorption curve investigating the blood polyphenol levels before red grape juice intake (300 mL) and each hour until six hours after juice ingestion. The curve was used to evaluate the highest peak after red grape juice intake in total polyphenol absorption. (2) From these results we performed a sec-ond analysis after two weeks of the irst protocol (wash-out period) analyzing before (12 h fasting) and in the period that we found the highest polyphenol peak in blood after red grape juice intake (300 mL). We re-analyzed the blood polyphenol content and additionally some oxidative biomarkers before and after red grape juice ingestion. Minimizing the confounding effects of dietary lavonoids the subjects were instructed to exclude all fruit, vegetables, wine, tea, chocolate and alcoholic beverages from their diets for 24 h before the ingestion of the experimental beverages.17
Samples of blood were collected with citrate. The plasma and eryth-rocytes were separated by centrifugation at 3000 rpm for 10 min.
Total polyphenols were spectrophotometrically determined in the plasma by reading the absorbance at 750 nm (Folin-Ciocalteau method) and using gallic acid as a standard.18,19 Total phenolic
con-centrations of plasma samples were determined after a procedure of acid extraction/hydrolysis, and protein precipitation with 0.75 mol L-1
metaphosphoric acid (MPA). For hydrolyzing the conjugated forms of polyphenols, hydrochloride acid was added to the sample, followed by sodium hydroxide in methanol. This step breaks the links of poly-phenols with lipids and provides a irst extraction of polypoly-phenols. For removing plasma proteins, MPA was used in this procedure. The inal extraction of polyphenols was performed by adding 1:1 (v/v) solution of acetone:water. The results were expressed as the gallic acid equivalent (GAE) in mg L-1. Total and non-protein thiol groups
were determined as described by Ellman20 in plasma and
erythro-cyte respectively. TSH and NPSH content was expressed as mmol/ mL of plasma and mmol/mL of erythrocytes. Lipid peroxidation in human erythrocytes was quantiied by measuring the formation of thiobarbituric acid reactive substances (TBARS).21 Lipid
peroxida-tion was expressed in nmol of TBARS/mL of erythrocytes. SOD (E.C.1.15.1.1) activity was measured spectrophotometrically ac-cording to the method developed by Boveris et al.22 This method is
based on the capacity of SOD to inhibit autoxidation of adrenaline to adrenochrome. The unit of activity is deined as the amount of enzyme required to inhibit the rate of epinephrine autoxidation by 50%. Catalase activity (EC 1.11.1.6.) was determined by the method of Aebi.23 One unit of catalase activity was deined as the activity
required degrading 1 µmol of hydrogen peroxide in 60 s. The total acid ascorbic concentration in plasma was measured according to the method adapted described by Jacques-Silva et al..24 The concentration
of acid ascorbic was expressed in nmol ascorbic acid/mL of plasma Statistical analysis
Statistical analysis was performed using version 16.0 of the SPSS software. In the irst phase of the study when we compared the chemical contents among different juices and red vinegar the values represent the means of values observed in 2007 and 2008 (±SD). Differences among experimental data were analyzed by one-way ANOVA followed by Tukey’ studentized range test, and those at p< 0.05 were considered signiicant.
Polyphenol curve absorption comparison was made using me-asure repeated variance Anova-Oneway. In the second analysis the polyphenol and oxidative biomarkers analyzed in two periods (fasting and in the highest polyphenol peak period after red grape juice intake) were compared by paired Student t test. All the analyses were two tailed and the null hypothesis was rejected where p>0.05
RESULTS
We compared the total polyphenol content in red grape juices and vinegars. In general, all samples showed high total polyphenol content, as can be seen in Figure 1. However, the juiced organically produced with Izabel variety (GIO) and the organic wine vinegar 10% enriched with grape seeds (WVO10) showed higher polyphenol content than other juices and vinegars.
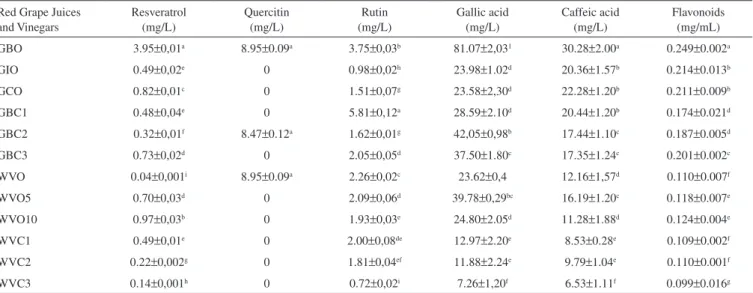
We determined the levels of resveratrol, quercitin, rutin, gallic acid and caffeic acid, as well as lavonoids and tannins present in the sample tested and compared here and the results are described in Table 1.
Table 1. Means and standard deviations of the concentration (mg/L) of phenolic compounds in red grape juices and wine vinegars organically and conventio-nally produced
Red Grape Juices and Vinegars
Resveratrol (mg/L)
Quercitin (mg/L)
Rutin (mg/L)
Gallic acid (mg/L)
Caffeic acid (mg/L)
Flavonoids (mg/mL) GBO 3.95±0,01a 8.95±0.09a 3.75±0,03b 81.07±2,031 30.28±2.00a 0.249±0.002a
GIO 0.49±0,02e 0 0.98±0,02h 23.98±1.02d 20.36±1.57b 0.214±0.013b
GCO 0.82±0,01c 0 1.51±0,07g 23.58±2,30d 22.28±1.20b 0.211±0.009b
GBC1 0.48±0,04e 0 5.81±0,12a 28.59±2.10d 20.44±1.20b 0.174±0.021d GBC2 0.32±0,01f 8.47±0.12a 1.62±0,01g 42,05±0,98b 17.44±1.10c 0.187±0.005d GBC3 0.73±0,02d 0 2.05±0,05d 37.50±1.80c 17.35±1.24c 0.201±0.002c WVO 0.04±0,001i 8.95±0.09a 2.26±0,02c 23.62±0,4 12.16±1,57d 0.110±0.007f WVO5 0.70±0,03d 0 2.09±0,06d 39.78±0,29bc 16.19±1.20c 0.118±0.007e WVO10 0.97±0,03b 0 1.93±0,03e 24.80±2.05d 11.28±1.88d 0.124±0.004e WVC1 0.49±0,01e 0 2.00±0,08de 12.97±2.20e 8.53±0.28e 0.109±0.002f WVC2 0.22±0,002g 0 1.81±0,04ef 11.88±2.24e 9.79±1.04e 0.110±0.001f
WVC3 0.14±0,001h 0 0.72±0,02i 7.26±1,20f 6.53±1.11f 0.099±0.016g
Figure 1. Data represents the means ±SD of samples collected in two years
The organic Bordo grape juice (GBO) presented a higher level of these compounds (trans-resveratrol, quercitin, rutin, gallic acid, ca-ffeic acid and total lavonoids) followed by organic wine vinegar 10% seed enriched when compared to other juices and vinegars products tested here. To examine the possible variation in trans-resveratrol levels, we performed a complementary test in different lots of Bordo red grape juices (GBO) produced in 2006 and 2007. Trans-resveratrol values were: 2.43 ± 2.00, 2.65 ± 2.10 in 2006, and 3.92 ± 3.20 and 3.92 ± 1.87 mg/L in 2007. These results showed some variation in the resveratrol content among crops.
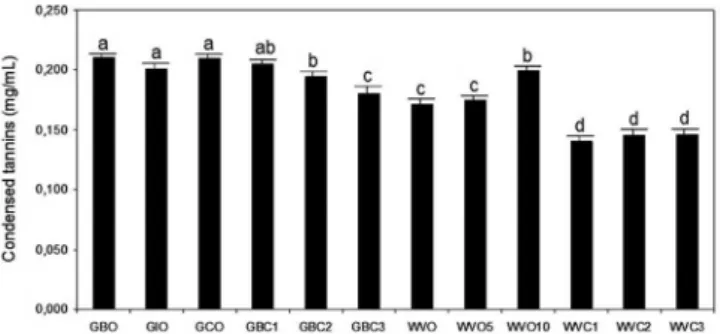
Condensed tannins were also evaluated and generally showed higher levels in organic red grape juices than conventional red grape juices (Figure 2). The organic wine vinegar 10% enriched with grape seeds (WVO10) showed condensed tannins levels similar to organic red juices.
In vitro antioxidant capacity evaluated by DPPH method we observed that the Bordo and Izabel varieties of organic red juices
exhibited higher antioxidant capacity than other juices as seen in Figure 3 when we compared the IC50 concentration. As can be seen in Figure 3, the puriied standards have an IC50 very low, as expec-ted, since all possess high antioxidant capacity due to its ability to stabilize the electric charge due to the presence of phenolic rings. Overall, the juices had antioxidant capacities approximated, but higher than vinegar. Analyzing these results, there is no doubt that tannins and lavonoids play important roles in the scavenging activities and medical uses of the grapes studied here.
As the GBO juice presented higher trans-resveratrol, quercitin, rutin, gallic acid, caffeic acid and total lavonoids levels and higher in vitro antioxidant capacity than other juices we tested the total polyphe-nol absorption for healthy human subjects using only GBO juice ingestion. Nine subjects completed the protocol study. We observed a highest peak one hour after juice ingestion. The total polyphenol levels decreased to similar fasting levels 4 h after juice ingestion.
The protocol was repeated to analyze the possible acute effect of polyphenol content absorbed from ingestion (one hour after red grape juice intake). The mean polyphenol absorption was 28.5 ±
18.3 mg/mL (8.3-60.0 mg/dL) in the sample investigated here. In general, the polyphenol content increased 27.2% and acute effects in oxidative metabolism were observed after GBO juice ingestion. The NPSH level that is the indirect glutathione measure increased 19.4% when compared to fasting NSPH level. Additionally, the lipid peroxidation evaluated by TBARS levels decreased in 28.1% when compared to basal blood values (12 h fasting) (Table 2). Antioxidant enzymes levels, catalase and superoxide dismutase, did not change as well as SHT levels.
DISCUSSION
We described here the presence of high polyphenol content and antioxidant capacity in non-alcoholic grape products conventional and organically produced as well as the immediate antioxidant effect of one single serving ingestion of organic Bordo red grape juice (GBO). Despite the existence of similar studies, this investigation could be one of the irst study involving Brazilian juice and vinegars that evaluated chemically a consistent number of bioactive compounds and its acute metabolic effects in humans.
The results described here corroborate several previous data that
Figure 2. Data represents the means ±SD of three determinations. Bars with
different letters represent means signiicantly different (p<0.05) using analysis of variance (ANOVA) followed by post hoc Tukey test. Grape Juice Bordo Organic (GBO), Grape Juice Izabel Organic (GIO), Grape Juice Concord Organic (GCO), Grape Juice Bordo Conventional 1 (GBC1), Grape Juice Bordo Conventional 2 (GBC2), Grape Juice Bordo Conventional 3 (GBC3), Wine Vinegar Organic (WVO), Wine Vinegar Organic 5% enriched with grape seeds; (WVO5) Wine Winegar Organic 10% enriched with grape seeds (WVO10); Wine Vinegar Conventional 1 (WVC1), Wine Vinegar Conventional 2 (WVC2) and Wine Vinegar Conventional 3 (WVC3)
Figure 3. Data represents the means ±SD of three determinations. Bars with different letters represent means signiicantly different (p<0.05) using analysis
Table 2. Total polyphenol content and oxidative metabolism biomarkers before and after 1 h of red grape juice ingestion (300 mL)
Variables Before
Mean±SD
After Mean±SD
p
Basal polyphenol content (mg/dL) 3.955±0.688 5.0969±0.934 0.0001
Ascorbic acid (nmol/mL plasma) 11.406±2.489 12.723±2.776 0.327
TBARS (nmol/mL erit) 2.299±0.501 1.766±0.385 0.003
Catalase (µmol de H2O2/ mLeritr/min) 3.653±0.797 3.789±0.826 0.371
Superoxide dismutase (uSOD) 20.739±4.637 17.946±4.012 0.409
SHT 97.583±21.2944 123.513±26.952 0.121
NPSH1 423.922±92.507 625.400±136.473 0.010
showed bioactivity of grape chemicals for human physiology and health.25 Polyphenols are found in foods such as grapes and their
products at different concentrations. The importance of these studies stems from epidemiological studies that have suggested an inverse relationship between the intake of foods rich in phenolic compounds (i.e., lavonoids) and the occurrence of certain chronic diseases such as cancer and coronary heart disease.1
Although we observe signiicant polyphenol contents differences among red grape juices and vinegars conventionally and organically produced these differences could be associated with several environ-mental and grape variety variables. Several studies have demonstrated that the level of phenolic compounds in fruits is highly dependent on many external and internal factors, such as variety, stage of maturity, storage and environmental or genetic factors. Among these, light, tem-perature, oxygen, ethylene, growth regulators, nutrients and pesticides have been demonstrated to affect phenolic metabolism. The level of phenolic compounds in a plant has also been found to increase as a response to infection by phytopathogens in agreement with the proposed role of these compounds in the plant defense mechanism.26
It is likely that the total polyphenol content differences described here in both red grape juices and wine vinegars are inluenced by several factors including genetic contribution and grape production.27
However, we don’t believe that the polyphenol content variation among the products tested here have effective difference in biological antioxidant response. These afirmation based in our the results that showed high in vitro antioxidant capacity in red grape fruit and red vinegars tested although we had observed higher levels in organic red grape juices (Bordo and Izabel) than others. From the data obtained we tested the effect of one serving grape fruit ingestion using the product that, in general, presented higher polyphenol content and antioxidant capacity (Bordo red grape juice organically produced). We observed a similar total polyphenol curve absorption in the subjects investigated here with higher peak after 1 h from juice ingestion.
Acute antioxidant effect after one hour of juice ingestion was also observed in this study. It is important to mention that, although we have irst quantiied the main bioactive compounds in three varieties of grape juice as can see in Table 1, Figures 1 and 2. How do we ind, in general, a greater amount of polyphenols in the GBO conventionally produced much higher antioxidant activity in DPPH test of the other studies were performed only with this variety. We believed that the results obtained in the GBO ingestion is representative of other juices.
We observed higher blood total polyphenol level one hour after ingestion. We found two important results: increase in NSPH levels and decrease in lipid peroxidation that indicate acute grape fruit juice ingestion inluences in oxidative metabolism. These results corroborate previous investigations, as performed by Maxwell et al.28 that described a short-term increase in blood antioxidant activity
after red wine consumption in human volunteers showing at 60 min post-ingestion an increase in serum antioxidant activity compared to
baseline. Recently, Fernández-Pachón et al.29 investigated the changes
in antioxidant endogenous enzymes (activity and gene expression levels) in 10 subjects that after repeated red wine intake (300 mL/day) every day for a week. After wine consumption, antioxidant enzymes activities signiicantly increased.
Additionally, our data corroborate previous studies using similar red grape fruit juice (Bordo) were performed to evaluate the antioxi-dant effect in substantia nigra and striatum of brain rats chronically treated with organic or conventional purple grape juice and to correlate the results obtained with the polyphenol content (total polyphenolic content, resveratrol, and anthocyanins). In the grape juice-treated groups the authors observed a decrease of lipid peroxidation (TBARS levels) and protein (carbonyl) peroxidation, as well as a signiicant antioxidant protection through the increase of enzyme activity.30
Additional investigated performed by the same research team sug-gested that purple grape juice is a hepatoprotective agent in Wistar rats.31 The antioxidant potential of grapes and grape juice has been
studied in human trials32 and has largely yielded positive results and
modulation of the antioxidant and physiological biomarkers related to disease prevention.
Perhaps, the biological effects of the polyphenol ingestion from grape products present, irstly an acute response in biochemical and physiological markers as observed in the results described here. As we observed a decrease in total polyphenol levels after 4 h of GBO juice ingestion, this results suggests the need for periodic ingestion of antioxidant foods throughout the day. However, this suggestion needs to be studied in complementary investigations. Anyway, the effect of acute ingestion of wine was also described to other biological parameters. Karatzi et al.33 showed that acute consumption of both red
wine and green olive oil, rich in antioxidants, led to an improvement in the postprandial endothelial function in healthy subjects. These indings provide additional favorable effect antioxidant substances on endothelial function, at the postprandial state.
The results on the whole described here support the hypothesis that grape fruit non-alcoholic products such as grape juice and vi-negars have higher functional and nutritional quality mainly from organic crop-production and that increase a plasmatic total polyphenol content one hour after ingestion present an immediate antioxidant effect. Additional investigation to understand the possible intervenient variables in polyphenol absorption and antioxidant effects could to be important to understand the biological mechanisms affected by non-alcoholic grape fruit products.
ACKNOWLEDGMENTS
The author thanks to the wineries that donated the juices and wine vinegars. Dr. A. Leyva provided English editing of the manuscript. Research supported by CNPq (No 471233/2007-2 and
REFERENCES
1. Yadav, M.; Jain, S.; Bhardwaj, A.; Nagpal, R.; Puniya, M.; Tomar, R.; Singh, V.; Parkash, O.; Prasad, G. B. K. S.; Marotta, F.; Yadav, H.; J. Med. Food2009, 12, 473.
2. Pezzuto, J. M.; J. Agric. Food Chem.2008, 56, 6777.
3. Castilla, P.; Echarri, R.; Davalos, A.; Cerrato, F.; Ortega, H.; Teruel, J. L.; Lucas, M. F.; Gómez-Coronado, D.; Ortuño, J.; Lasunción, M.A.; Am. J. Clinical Nut.2006, 84, 252.
4. Martínez-Ortega, M. W.; Carcía-Parrilla, M. C.; Troncoso, A. M.; Nahrung2000, 44, 253.
5. Dani, C.; Oliboni, L. S.; Vanderlinde, R.; Bonatto, D.; Salvador, M.; Henriques, J. A.; Food Chem. Toxicol.2007, 45, 2574.
6. Verzelloni, E.; Tagliazucchi, D.; Conte, A.; Food Chem.2007, 105, 564. 7. Chandra, S.; Mejia, E. G.; J. Agric. Food Chem.2004, 52, 3583. 8. Souto, A.; Carneiro, M. C.; Seferin, M.; Senna, M. J. H.; Conz, A. G.;
J. Food Compd. Anal. 2001, 14, 441.
9. Zu, Y.; Li, C.; Fu, Y.; Zhao, C.; J. Pharm. Biomed. Anal. 2004, 41, 714. 10. Sharma, M.; Singh, U. P.; Singh, A.; Sing, J. N.; Maurya, S.; Siman, A.;
HPLCThe Internet Journal of Alternative Medicine 2008, 5. 11. Ferreira, E. C.; Nogueira, A. R. A.; Talanta 2000, 51, 1.
12. Zhishen, J.; Mengcheng, T.; Jianming, W.; Food Chem. 1999, 64, 555. 13. Choi, C. W.; Kim, S. C.; Hwang, S. S.; Choi, B.K.; Ahn, H. J.; Lee,
M. Y.; Park, S. H.; Kim, S. K.; Plant Sci. 2002, 163, 1161.
14. Prado-Lima, P. A. S.; Cruz, I. B. M.; Schwanke, C. H. A.; Netto, C. A.; Licinio, J.; Mol. Psychiatry 2006, 11, 889.
15. Montano, M. A. E.; Lera, J. P. B.; Gottlieb, M. G. V.; Schwanke, C. H.; da Rocha, M. I.; Manica-Cattani, M. F.; Montagner, G. F. F.; Cruz, I. B. M.; Moll. Cell Biochem.2009, 328, 33.
16. Manach, C.; Williamson, G.; Morand, C.; Scalbert, A.; Rémésy, C.; Am.
J. Clin. Nutr.2005, 81, 230S.
17. Zhishen, J.; Mengcheng, T.; Jianming, W.; Food Chem. 1999, 64, 555. 18. Seraini, M.; Ghiselli, A.; Ferro-Luzzi, A.; Eur. J. Clin. Nutr. 1996, 50,
28.
19. Torabian, S.; Haddad, E.; Rajaram, S.; Banta, J.; Sabaté, J.; J. Human Nutr. Diet. 2009, 22, 64.
20. Ellman, G. L.; Arch. Biochem. Biophys. 1969, 589, 82. 21. Ohkawa, H.; Ohishi, H.; Yagi, K.; Anal. Biochem. 1979, 95, 351. 22. Boveris, A.; Cadenas, E. In Oxygen, Gene Expression, and Cellular
Function; Clerch, L.; Massaro, D., eds.; Marcel Decker: New York, Basel and Hong Kong, 1997, vol. 105, p. 1.
23. Aebi, H.; Methods Enzymol. 1984, 105, 121.
24. Jacques-Silva, M. C.; Nogueira, C. W.; Broch, L.; Flores, E. M.; Rocha, J. B.; Pharmacol. Toxicol. 2001, 88, 119.
25. Iriti, M.; Faoro, F.; Nat. Prod. Commun. 2009, 4, 611.
26. Nicolas, O.; Dunnington, S. W.; Gotow, L. F.; Pirone, T. P.; Hellmann, G. M.; Virology1997, 23, 452.
27. Mark, L.; Nikfardjam, M. S.; Avar, P.; Ohmacht, R. A.; J. Chromatogr. Sci. 2005, 43, 445.
28. Maxwell, S.; Cruickshank, A.; Thorpe, G.; Lancet 1994, 344,193. 29. Fernández-Pachón, M. S.; Berná, G.; Otaolaurruchi, E.; Troncoso, A.
M.; Martín, F.; García-Parrilla, M. C.; J. Agric. Food Chem. 2009, 57, 6578.
30. Dani, C.; Pasquali, M. A.; Oliveira, M. R.; Umezu, F. M.; Salvador, M.; Henriques, J. A.; J. Med. Food 2008, 11, 55.
31. Dani, C.; Oliboni, L. S.; Pasquali, M. A.; Oliveira, M. R.; Umezu, F. M.; Salvador, M.; J. Med. Food 2008, 11, 127.
32. Aggarwal, B. B.; Bhardwaj, A.; Aggarwal, R. S.; Seeram, N. P.; Shisho-. Aggarwal, B. B.; Bhardwaj, A.; Aggarwal, R. S.; Seeram, N. P.; Shisho-dia. S.; Takada, Y.; Anticancer Res. 2004, 24, 2783.