BJRS
RADIATION SCIENCES
07-2A (2019) 01-11ISSN: 2319-0612 Accepted: 2018-10-27
Determination of uranium in tree bark samples by
epithermal neutron activation analysis
N. P. Lima; M. Saiki
Instituto de Pesquisas Energéticas e Nucleares (IPEN - CNEN/SP)
Av. Professor Lineu Prestes, 2242, Cidade Universitária, CEP: 05508-000, São Paulo – SP – Brazil nicolepereira10@gmail.com
ABSTRACT
In this study uranium (U) concentrations were determined in certified reference materials (CRMs) and in tree bark samples collected in “Cidade Universitária Armando de Salles Oliveira” (CUASO) USP, São Paulo. CRMs were analyzed using the experimental conditions used for barks for analytical quality control of U determina-tion. The barks were collected from different species namely Poincianella pluviosa and Tipuana tipu. These bark samples were cleaned, dried, grated and milled for the analyses by epithermal neutron activation analysis meth-od (ENAA). This methmeth-od consists on irradiating CRMs, samples and U standard in IEA-R1 nuclear reactor with thermal neutron flux of 1.9 x 10¹² n cm-2 s-1 during 40 to 60 seconds depending on their matrices. The U was iden-tified, using gamma-ray spectrometry, by the peak of 74.66 keV of 239U with half-life of 23.47 minutes. Concen-tration of U was calculated by comparative method. Results obtained for CRMs presented good precision and accuracy, with |Z score| ≤ 0.39. Uranium concentrations in tree barks varied from 83.1 to 627.6 ng g-1 and the relative standard deviations of these results ranged from 1.8 to 10 %.
1. INTRODUCTION
The U is a metallic and radioactive chemical element that is naturally distributed in the ground with
concentrations between 0.1 and 20 mg kg-1 [1]. This element is found in different concentrations in
water, air and foods. The increasing application of U in nuclear industry, agriculture and in nuclear weapons fabrication indicates that this element has been systematically extracted from nature and then deposited in the environment, which makes transference to water, plants and food possible. It is well known that U is a toxic element for human beings and consequently it represents a signifi-cant hazard to human health [2]. The damages caused by U on humans make essential its study and determination of concentration on environment. Usually U is present on biological and environmen-tal samples at very low concentrations. Therefore, it is necessary to evaluate the quality of U results in order to get reliable data.
There are several analytical methodologies used for U determination. The most used ones are induc-tively coupled plasma mass spectrometry (ICP-MS) [3-5], X-ray fluorescence spectrometry (XRFS) [6], flame atomic absorption spectrometry (FAAS), electrothermal atomic absorption spectrometry (ET AAS), optical emission spectrometry with an inductively coupled plasma source (ICP OES), neutron activation analysis (NAA) [7,8], delayed neutron activation analysis (DNAA) [9], liquid scintillation counting (LSC) [10,11], gamma spectroscopy [12] and alpha spectroscopy [13] for in-stance. Among these analytical methods for U quantification, the epithermal neutron activation analysis (ENAA) was chosen. Besides, this method presents simplicity, precision, quickness, effec-tiveness and easy application, which turns it into an available method to use.
Therefore, this research consisted on U determination in tree barks, which are used as environmen-tal pollution biomonitor and certified reference materials by using short irradiation of ENAA meth-od.
2. EXPERIMENTAL
Tree bark samples of two different arboreal species, namely Tipuana tipu (Tipuana) and
Poincianella pluviosa (Sibipiruna), were collected at the “Cidade Universitária Armando de Salles
Oliveira” (CUASO) of the University of São Paulo, located in São Paulo city at Butantã district. There were eight samples, which were then obtained in different sites of CUASO during the period January and February 2017. Such collection spots were chosen randomly only considering existence of mentioned tree species. The process of getting samples is based on removing barks from trees at about 1.5 m from the topsoil by using a stainless steel knife and then placing them in paper bags.
2.1.1. PREPARATION OF TREE BARK SAMPLES FOR THE
ANAL-YSES
Firstly, tree bark samples were dried in an oven (FANEM mod. 320-SE) of forced air circulation at
40 oC for about 48 hours. Then they were cleaned using a nylon bristles toothbrush in order to
re-move dust or any type of extraneous materials. After cleaning them, an external layer of 3 mm of each bark is removed by using a titanium grater. So a Fritsch “Analysette 3 Pulverisette 0” micro mill was used to turn these barks into a powder. After this process, this powder was placed in plastic vials and stored in a desiccator.
2.2. CERTIFIED REFERENCE MATERIALS
Certified reference materials (CRMs) were used for ensuring metrological traceability and for eval-uating accuracy and precision results. The chosen CRMs were the reference materials IAEA – 140/TM Trace elements and methylmercury in seaweed (Fucus sp.), NIST - 1575 Pine needles, NIST - 1632d Trace elements in coal (Bituminous), NIST - 1633b Constituent elements in coal fly ash, INCT - MODAS-3 Herring Tissue, IAEA - Soil-7 Trace elements in soil and IAEA - RLA 2/014 Trace elements in volcanic ashes .
To calculate U concentrations on dry weight basis, the humidity of CRMs were determined. This
determination consisted on drying an aliquot of each material at temperature of 85 oC and 110 oC for
biological and geological materials, respectively for 48 hours or until to obtain constant mass. The percentage of humidity obtained is presented in Table 1.
Table 1: Percentage of humidity determined in the certified reference materials. Certified reference materials Humidity (%)
IAEA-140/TM Seaweed 4.7
NIST-1632d Trace elements in coal 5.6
NIST-1633b Coal fly ash 1.3
IAEA-RLA2/014 Volcanic ashes 0.3
IAEA-SOIL-7 Trace elements in soil 11.2
NIST - 1575 Pine needles 1.1
INCT - M3 Herring tissue 1.4
2.3. PREPARATION OF SYNTHETIC STANDARD OF URANIUM
The diluted U standard solution was prepared by using a certified standard solution from Spex
Certiprep Chemical (USA) with a concentration of 1003 ± 3 mg L-1 and using MILLI-Q water. The
prepared U solution was stored in a refrigerator. A volume of 50 µL of the diluted U standard
solu-tion were pipetted onto sheets of Whatman no 40 filter paper with the dimensions of 1.5 cm x 6 cm.
This synthetic standard was kept in a desiccator in order to dry the pipetted aliquot. After drying, these sheets were folded and placed into polyethylene involucres. The concentration of U diluted
solution was of 200.51 µg mL-1 and U mass irradiated was 10.02 µg.
Aliquots varying from 100 mg to 200 mg of each CRM or bark samples were weighed in polyeth-ylene involucres. For irradiating, a CRM, sample and U synthetic standard were placed in a cadmi-um (Cd) capsule and that was placed inside a polyethylene device (rabbit).
The irradiation time range varied from 15 to 40 seconds depending on the type of matrix. The irra-diation was carried out using a pneumatic station of the IEA-R1 reactor of IPEN - CNEN/SP. The
thermal neutron flux used was of 1.9 x 10¹² n cm-2 s-1. After irradiation, the CRM, bark samples and
the U standard were mounted in a stainless steel base for counting. The induced gamma activities were measured using a high-purity Ge detector (CANBERRA), model GC2018, connected to a DSA 1000 digital spectrum analyzer (CANBERRA). The resolution of the system (FWHM) was
1.05 keV for 121.97 keV peak of the 57Co and of 1.89 keV for 1332.47 keV gamma ray of 60Co. A
chronometer was used to record the decay time. Spectral data acquisition and its processing were carried out by using Genie 2000 software, version 3.1 (CANBERRA). Counting times of 500 seconds were used for the samples and standard. Uranium was identified by gamma rays of
74.66 keV of 239U with a half-life of 23.47 minutes [14]. The U concentration was calculated by
comparative method according to De Soete et al. [15].
2.5. TREATMENT OF DATA
Uranium results obtained in this study were evaluated using basic statistic calculating arithmetic mean (M), standard deviation (SD), relative standard deviation (RSD) and relative errors (RE). Moreover, the standardized difference or Z score value was calculated to evaluate accuracy of the results. According to Konieska and Namièsnik [16] Z score is given by equation 1.
2 2 ref ref lab u DP Z
x
x
, (1)where
x
lab is the obtained valuex
ref is the certified value, uref is the combined uncertainty of thecertified value and DP is the standard deviation of the results obtained. The criteria of Z score
val-ues are [16]:
If |Z| ≤ 2 the result is considered satisfactory;
If 2 < |Z| < 3 the result is considered uncertain;
If |Z| ≥ 3 the result is considered unsatisfactory.
The detection and quantification limits were calculated using equations 2 and 3, respectively, ac-cording to Currie [17]. , 29 . 3 LT BG LDT (2) 10 , LT BG LQT (3)
where LDT and LQT are count rates for the minimum detectable and quantifiable concentrations,
respectively; BG is counting rate of background, which corresponds to area under the peak and
LT is the counting time. Once the values LDT and LQT have been calculated, the limits in
con-centration units were obtained using comparative method.
3. RESULTS AND DISCUSSION
3.1. URANIUM RESULTS IN CERTIFIED REFERENCE MATERIALS
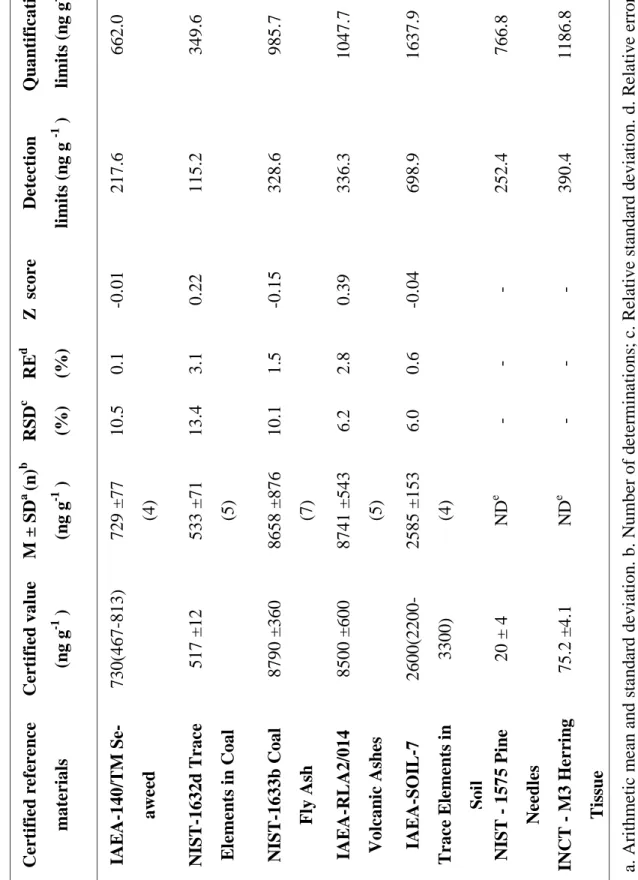
In Table 2, are presented results of U concentrations obtained in CRMs, also limits detection, and certified values. These results of U concentrations in CRMs indicate good agreement with certified values. The relative errors are between 0.1 and 3.1 % and |Z score| values are lower than 0.39. In 1575 Pine Needles and M3 Herring Tissue CRMs, U was not detected using short irradiation of ENAA due to its low concentration in these two materials. In Table 2, it can be seen that U concen-trations for these both materials are lower than their respective detection limits values.
Tab le 2: U ra ni um c on ce nt ra ti ons de te rm ine d in c er ti fi ed re fe re nc e m at eri al s. Q u an ti fi cati on li mi ts (n g g -1 ) 662.0 349.6 985.7 1047.7 1637.9 766.8 1186.8 a. A ri thm et ic m ea n a nd st and ard de v ia ti on . b. N um be r of d et er m in at ions ; c . Re la ti ve s ta nda rd d evi at ion. d. R el at iv e error. e . N ot de te ct ed. D et ec ti on li mi ts (n g g -1 ) 217.6 115.2 328.6 336.3 698.9 252.4 390.4 Z s cor e -0.01 0.22 -0.15 0.39 -0.04 - - RE d (%) 0.1 3.1 1.5 2.8 0.6 - - RSD c (%) 10.5 13.4 10.1 6.2 6.0 - - M ± S D a (n ) b (n g g -1 ) 729 ±77 (4) 533 ±71 (5) 8658 ±876 (7) 8741 ±5 43 (5) 2585 ±153 (4) ND e ND e C er ti fi ed v al u e (n g g -1 ) 730(467 -813) 517 ±12 8790 ±360 8500 ±600 2600(2200 -3300) 20 ± 4 75.2 ±4.1 C er ti fi ed r efe re n ce m ate ri al s IA EA -140/ TM S e-aw ee d NIST -1632d Tr ac e El eme n ts i n C oal NIST -1633b C oal F ly A sh IA EA -R L A 2/ 014 V ol can ic A sh es IA EA -S O IL -7 Tr ac e El eme n ts i n S oi l N IS T - 1575 P in e N ee d le s IN C T - M 3 H er ri n g Ti ss u e
3.2. URANIUM DETERMINATION IN TREE BARK SAMPLES
The U concentrations obtained of tree bark samples are shown in Table 3. In this Table, the mean values of concentrations with standard deviation, relative standard deviation and values of detection limits and quantification limits are presented.
Table 3: Uranium concentrations and values of detection and quantification limits obtained in tree
bark samples analyses.
Sample codesd M ± SD a (n)b (ng g−1 ) RSDc (%) Detection limits (ng g−1 ) Quantification limits (ng g−1 ) T1 103.9 ± 7.9 (3) 7.6 30.8 93.8 S1 83.1 ± 8.3 (4) 10.0 37.2 113.3 T2 132.9 ± 2.4 (3) 1.8 93.0 282.9 S2 97.2 ± 7.0 (3) 7.2 37.1 112.8 T3 213 ± 19 (3) 9.0 44.2 134.7 S3 574 ± 22 (3) 3.8 79.9 243.4 T4 205.9 ± 4.3 (4) 2.1 51.8 157.7 T5 627.6 ± 22.6 (3) 3.6 122.5 371.9
a. Arithmetic mean and standard deviation. b. Number of determinations; c. Relative standard devi-ation. d. Samples are coded with letters T and S for Tipuana and Sibipiruna tree bark samples, re-spectively.
Uranium concentrations obtained in tree bark samples show precise results with relative standard deviations varying from 1.8 to 10 %. The reproducibility of these results also indicates the homoge-neity of prepared bark sample in relation to U concentration. The detection limits presented in Ta-ble 3 indicate a high sensitivity of the ENAA procedure for U determined in tree barks. Samples collected at CUASO of São Paulo University presented U concentrations varying from 83.1 to
628 ng g −1. Their U concentration found in tree barks is probably due to suspension of soil dust, followed by deposition on the bark.
4. CONCLUSION
Results obtained in this study demonstrated that procedure of ENAA using short irradiation could be applied satisfactorily in U determination in environmental samples of tree barks. The results ob-tained in the analyses of certified reference materials presented good precision and accuracy. Unfor-tunately, there are no environmental regulations or norms that present an acceptable limit value for U in tree barks. This fact indicates that the ENAA procedure established in this study may contrib-ute to the establishment on this acceptable limit value. The detection limits depend on the
composi-tion of the samples and in the case of tree barks, these were very low (lower than 122.5 µg g−1).
5. ACKNOWLEDGMENT
The authors would like to thank Fundação de Amparo à Pesquisa do Estado de São Paulo (FA-PESP) and Conselho Nacional de Desenvolvimento Científico e Tecnológico (CNPq) for financial support. The author N. P. de Lima is grateful for a scholarship from the CNPq.
REFERENCES
[1] SAHOO S. K.; ENOMOTO H.; TOKONAMI S.; ISHIKAWA T.; UJIC P.; CELIKOVIC I.; ZUNIC Z. S. Determination of depleted uranium in environmentally biomonitor samples and soil from target sites in Western Balkan Region, In: THE NATURAL RADIATION
ENVIRON-MENT 8TH INTERNATIONAL SYMPOSIUM, p. 287, 2008.
[2] KEITH, L. S.; FAROON, O. M.; FOWLER, B. A. Handbook on the Toxicology of Metals, 3rd
[3] MARTEN, A.; BERGER, D.; KOHLER, M.; MERTEN, D. The dendroanalysis of oak trees as a method of biomonitoring past and recent contamination in an area influenced by uranium mining.
Environmental Science and Pollution Research, v. 24, p. 19417-19425, 2015.
[4] ALSABBAGH, A.; ZAIDAN, L.; HARAHSHEH, I.; SUNBUL, N.; LANDSBERGER, S. In-vestigation of Jordanian uranium resources in carbonate rocks. Journal of Radioanalytical and
Nuclear Chemistry, v. 308, p. 1063-1070, 2016.
[5] EL-TAHER, A.; KHATER, A. E. M. Elemental characterization of Hazm El-Jalamid phosphorite by instrumental neutron activation analysis. Applied Radiation and Isotopes, v. 114, p. 121-127, 2016.
[6] BÁRTOVÁ, H.; KUCERA, J.; MUSÍLEK, L.; TROJEK, T.; GREGOROVÁ, E. Determination of U, Th and K in bricks by gamma-ray spectrometry, X-ray fluorescence analysis and neutron acti-vation analysis. Radiation Physics and Chemistry, v. 130, p. 2-6, 2017.
[7] LANDSBERGER, S.; KAPSIMALIS, R. Comparison of neutron analysis techniques for the determination of uranium concentrations in geological and environmental materials. Journal of
Environmental Radioactivity, v. 23, p. 41-44, 2013.
[8] ZIKOVSKY, L. Determination of uranium in food in Quebec by neutron activation analysis.
Journal of Radioanalytical and Nuclear Chemistry, v. 267, p. 695-607, 2006.
[9] GROGAN, K. P.; DONNA, J. O. Analytical applications of delayed and instrumental neutron activation analysis. Journal of Radioanalytical and Nuclear Chemistry, v. 299, p. 543-549, 2014.
[10] BAIK, M. H.; KANG, M. J.; CHO, S. Y.; JEONG, J. A comparative study for the determina-tion of uranium and uranium isotopes in granitic groundwater. Journal of Radioanalytical and
[11] ZHOU, H.; LIN, H.; LIU, G.; LI, J.; LIANG, Q.; ZHAO, Y. A neutron multiplicity analysis method for uranium samples with liquid scintillators. Nuclear Instruments and Methods in
Phys-ics Research Section A: Accelerators, Spectrometers, Detectors and Associated Equipment, v.
797, p. 70-76, 2015.
[12] KARANGELOS, D. J.; ANAGNOSTAKIS, M. J.; HINIS, E. P.; SIMOPOULOS, S. E.; ZUNIC, Z. S. Determination of depleted uranium in environmental samples by gamma-spectroscopic technique. Journal of Environmental Radioactivity, v. 76, p.295-310, 2004.
[13] JIA, G.; BELLI, M.; SANSONE, U.; ROSAMILIA, S.; OCONE, R.; GAUDINO, S. Determi-nation of uranium isotopes in environmental samples by alpha-spectrometry. Journal of
Radioanalytical and Nuclear Chemistry, v. 253, p. 395-406, 2002.
[14] IUPAC - International Union of Pure and Applied Chemistry. Compilation of K0 and related
data neutron activation analysis (NAA) in the form of an electronic database. Pure and Applied
Chemistry. , v. 76, n. 10, p.1921-1925, 2004.
[15] DE SOETE, D.; GIJELS, R.; HOSTE, J. Neutron Activation Analysis. London: Wiley-Interscience, 1972.
[16] KONIECZKA, P.; NAMIÉSNIK, J. Quality Assurance and Quality Control in the
Analyti-cal ChemiAnalyti-cal Laboratory: A PractiAnalyti-cal Approach. New York: Taylor e Francis Group LLC, 2009.
[17] CURRIE, L. A. Detection and quantification limits: origins and historical overview. Analytica