Article
Printed in Brazil - ©2012 Sociedade Brasileira de Química0103 - 5053 $6.00+0.00
A
*e-mail: [email protected]
Determination of Volatiles in Pharmaceutical Certified Reference Materials
Raquel Nogueira,*,a Suzane M. Queiroz,a Gisele E. B. Silva,a Werickson F. C. Rocha,a
Gabriel F. Sarmanho,a Renato R. R. Almeidaa and Gabriela F. Moreirab
aChemical Metrology Division (Dquim) and bMaterials Metrology Division (Dimat),
National Institute of Metrology, Quality and Technology (INMETRO), 25250-020 Xerém-RJ, Brazil
Este trabalho compara os resultados obtidos na determinação de voláteis (água e solventes residuais) em novos materiais de referência certificados (MRC) ou candidatos a MRC dos ingredientes ativos farmacêuticos (API) captopril, metronidazol, diclofenaco sódico, diclofenaco potássico e furosemida, através do uso de diferentes técnicas: perda por dessecação (LOD), titulação coulométrica tipo Karl Fisher (KF), cromatografia gasosa (injeção por headspace estático) com detector por ionização em chama (sHS-GC-FID) e com espectrômetro de massas (sHS-GC-MS), análise termogravimétrica (TGA) e espectroscopia no infravermelho próximo (NIR) com análise estatística multivariada dos resultados. As três primeiras técnicas levaram a resultados complementares na determinação de voláteis, enquanto as outras duas mostraram pouca sensibilidade para a determinação de voláteis na faixa de concentração avaliada. A perda por dessecação foi considerada a técnica mais apropriada para determinação da fração mássica de voláteis a ser utilizada no cálculo do teor de API por balanço de massa.
This work compares the results obtained for the determination of volatiles (water and residual solvents) in new certified reference materials (CRM) or candidate CRMs of the active pharmaceutical ingredients (API) captopril, metronidazole, sodium diclofenac, potassium diclofenac and furosemide, by means of different techniques: loss on drying (LOD), Karl Fischer (KF) coulometric titration, static headspace gas chromatography with flame ionization detection (sHS-GC-FID) and with mass spectrometry (sHS-GC-MS), thermogravimetric analysis (TGA) and near infrared spectroscopy (NIR) with multivariate chemometric analysis of results. The first three methods led to complementary results. The two other techniques were not sufficiently sensitive to determine volatiles in the concentration range evaluated. The loss on drying method was considered the most appropriate to determine the mass fraction of the volatiles to be used in the mass balance calculation of the API mass fraction in the pharmaceutical CRMs.
Keywords: volatiles, water, residual solvents, active pharmaceutical ingredient (API), certified reference materials (CRM), analytical quality control
Introduction
Several are the reasons for determining the mass fractions of water and residual solvents in pharmaceuticals, including their influence on the physicochemical1-7 and microbiological stability of raw materials and finished products, their potential toxicity1-3,8 and also economic aspects9 since their presence results in analyte mass fractions smaller than 100%. Residual solvents may be introduced in active pharmaceutical ingredients (API) during their synthesis, especially if the final purification step is carried
out by crystallization in different solvents, as well as during drug products formulation and manufacturing.1,7,8
an unbroken chain of calibrations, each contributing to the measurement uncertainty,15,16 and is a requirement for accredited laboratories under ISO/IEC 17025:2005.17 Even if in several fields the use of CRMs is a well-established practice, in the pharmaceutical area only a few are available, including four CRMs from the United States Pharmacopeial Convention (USP),18 17β-estradiol CRM from the National Metrology Institute of Japan (NMIJ),19 paclitaxel CRM from the National Metrology Institute of China (NIM),20 as well as the CRMs of captopril,21,22 metronidazole23 and sodium diclofenac from the National Institute of Metrology, Quality and Technology (INMETRO, Brazil).
Volatiles in pharmaceuticals are mainly represented by water and residual solvents. The free or surface water4,5 is the main responsible for sample degradation,24 while the hydration or crystal water4,24 that is held inside the crystal
lattice is less available to promote hydrolysis or other degradation reactions.4 The adsorption of water from the air can be monitored by moisture sorption isotherms.25 The residual solvent classes and limits according to the ICH Q3C(R5) Guideline26 and to the United States Pharmacopeia 2011 (USP 34)27 are given in Table 1.
In the following paragraphs, different analytical techniques used to determine volatiles in pharmaceuticals are discussed: Karl Fischer, loss on drying, gas chromatography, thermogravimetry, spectroscopy and nuclear magnetic resonance.
The Karl Fischer (KF) reaction is based on the quantitative reaction of water with iodine (I2) in presence of an alcohol, a base, and sulfur dioxide (SO2), with potentiometric determination of the endpoint. The most known mechanism was proposed by Scholz in 1984:28
Table 1. Residual solvent classes and limits in pharmaceuticals26,27
Class Solvent Limit / ppm Class Solvent Limit / ppm Class Solvent Limit / ppm
I benzene 2 II acetonitrile 410 III acetic acid 5000
carbon tetrachloride 4 chlorobenzene 360 acetone
1,2-dichloroethane 5 chloroform 60 anisole
1,1-dichloroethene 8 cumene 70 1-butanol
1,1,1-trichloroethane 1500 cyclohexane 3880 2-butanol
1,2-dichloroethene 1870 butyl acetate
dichloromethane 600 tert-butyl methylether
1,2-dimethoxyethane 100 dimethylsulfoxide
N,N-dimethylacetamide 1090 ethanol
N,N-dimethylformamide 880 ethyl acetate
1,4-dioxane 380 ethyl ether
2-ethoxyethanol 160 ethyl formate
ethyleneglycol 620 formic acid
formamide 220 heptane
hexane 290 isobutyl acetate
methanol 3000 isopropyl acetate
2-methoxyethanol 50 3-methyl-1-butanol
methylbutyl ketone 50 methylethyl ketone
methylcyclohexane 1180 methylisobutyl ketone
N-methylpyrrolidone 530 2-methyl-1-propanol
nitromethane 50 pentane
pyridine 200 1-pentanol
sulfolane 160 1-propanol
tetrahydrofuran 720 2-propanol
tetralin 100 propyl acetate
toluene 890
trichloroethene 80
ROH + SO2 + R’NH → [R’NH]SO3R (1) H2O + I2 + [R’NH]SO3R + 2R’N → [R’NH]SO4R + 2[R’NH]I (2)
where R’N represents a base, e.g., pyridine or the less toxic imidazole,9,29 while ROH represents an alcohol, usually methanol,9,24 but also ethanol, ethylene glycol and 2-methoxyethanol.11
The Karl Fischer method is used to determine the total water content, i.e., surface and crystallization water.7,9,11 For larger water amounts (1-100%),24,30 the volumetric titration (titrant added directly to the titration chamber) is the most indicated, while the coulometric titration (iodine titrant formed in the generator electrode) is appropriate for water amounts in the order of 10-20 µg,11 50-100 ppm,24 or few µg g-1.30 Both methods can be carried out either by direct introduction of samples in the titration chamber or by using an oven that heats the sample to vaporize the water, which is then transferred to the titration cell by a stream of an inert gas.
The KF method is highly selective to water24,30 and very reproducible.6 The oven method can differentiate between bound surface and crystallization water by using a defined temperature gradient,29 but it cannot be applied for thermolabile compounds.24 Another drawback of the technique is the restriction to use the direct addition in case of analytes that are not soluble in or that react with the KF reagent,6,29 for instance thiols,11,31 aldehydes, cetones, amines, cupric salts and ferric salts.11 Furthermore, it does not provide information about residual solvents.
The loss on drying (LOD) technique is largely used in pharmaceutical laboratories to determine the total amount of volatiles, i.e., water and residual solvents9,29,32 vaporized under the experimental conditions. The test is quite simple,3,29 and depends only on a properly calibrated analytical balance and an oven usually programmed at 105 ºC (or a vacuum oven in case of thermolabile APIs). In metrological terms, LOD has the advantage of being a gravimetric technique and consequently a primary method of measurement.15 Balances with infrared drying are also used for the mass loss method,24 but are not sufficiently accurate and are appropriate only for comparative measurements (e.g., drying of granulates prior to tablet compression). LOD is considered a non-specific technique3 and may form interfering volatile components due to sample thermal degradation.11,29 Additionally, the technique may not release all the entrained solvent1 or tightly bound crystallization water.29,32 Other disadvantages are the large amount of sample required1,3,29 and the long analysis time.9,24,29
Gas chromatography (GC) is the most used technique for residual solvent quantification.33 The flame ionization
detector (FID) is the commonly used detector for quantitative purposes due to its almost “universal”8 response (no water response is given by FID),34 the mass spectrometer (MS) detector is usually applied for identification, while the electron capture detector (ECD) is dedicated for halogenated compounds.
The static headspace gas chromatography (sHS-GC) is the Pharmacopeial method to determine residual solvents. The dissolved sample27,35 is heated in a closed vial, an equilibrium is established between upper gas phase and lower liquid phase,2 and then a fixed gas phase volume (i.e., only volatile components) is injected into the GC column.8 In equilibrium, the residual solvent concentration in the gas phase (Cg) is expressed as:
2,34
Cg = C0/(K + β) (3)
where C0 is the original residual solvent concentration in the condensed phase (sample solution or solid sample), K is the partition coefficient between condensed and gas phases, and β is the phase volume ratio (gas phase/ condensed phase).
The following parameters have to be carefully considered in sHS-GC analysis:
(i) diluent type: water is the best polar diluent for sHS-GC-FID since it gives no FID response and most of the residual solvents have low K values in water,8 which is desirable according to equation 1. For less polar or apolar samples, high boiling point solvents such as N,N-dimethylformamide (DMF), dimethylsulfoxide (DMSO)2,34 and N,N-dimethylacetamide (DMA)36 may be used. Since organic diluents seriously reduce the method sensitivity,2 water is usually added to the organic phase to reduce K and increase Cg.
2,37 Another alternative is the
addition of salt solutions, e.g., 1 mol L-1 NaCl, to promote a “salting-out” effect of residual solvents.34,37 Diluents shall be purged with nitrogen prior to use for 3,37 42 or 24 h;34 (ii) volume of diluent in the headspace vial: larger solution volumes inside the vial (smaller β values) can reduce Cg (equation 1),2 which is not desired;
(iii) headspace temperature: an increase in the headspace temperature increases Cg.
34 However, in case of water, the
temperature is usually set to 80 ºC, i.e., 20 ºC below the water boiling point to avoid overpressure in the headspace vial.2,37,38 For diluents like DMF (b.p. 153 ºC),35 DMSO (b.p. 189 ºC)35 and DMA (b.p. 166 ºC),38 the used temperature shall not degrade either the solvent (e.g., DMF starts to degrade at 120 ºC)34 or the analyte;2,34
recommends the use of a 6% cyanopropyl-94% dimethyl polysiloxane capillary GC column.
Usually, the residual solvent mass transferred to the headspace vial is around 2 µg.2 External and internal standard calibrations can be used.1,39
Among the other GC methods, the dynamic headspace gas chromatography (dHS-GC) (purge-and-trap) has to be mentioned. In this technique, a gas flow is swept over the sample, the volatiles are trapped in a column (e.g., TenaxR) and then thermally desorbed for GC analysis.3,33 Although dHS-GC is more sensitive than sHS-GC due to the pre-concentration,1,3,38 it is less precise1 and does not reach 100% recovery.3 Additionally, the solid-phase microextraction gas chromatography (SPME-GC) is less often applied for pharmaceuticalsand uses a silica fiber coated with a sorbent inside the sample vessel to adsorb volatiles (direct immersion or exposal to the headspace), for later desorption and GC analysis,1,33,40 with reported recoveries of at least 70%.40 Finally, the direct GC injection is the least appropriate GC method since several APIs do not volatilize (except after derivatization) or are thermo-instable.
Thermogravimetric analysis (TGA) is another technique that can be applied to determine volatiles and is based on changes in sample weight when it is exposed to a temperature-time-program in a defined gas atmosphere.29 The correct assignment of the type of volatile components, namely water or residual solvent, is easier to carry out when the equipment is connected to a mass spectrometer (TGA-MS). The technique requires only 2-5 mg sample1 and can recognize the types of water binding.29 The long analysis time may be a disadvantage.
The infrared spectroscopy (IR) has a high potential for identification (classification) and quantification, especially when combined to chemometric methods.5,41 It is non-destructive, requires minimum sample preparation,41 and can be used to determine water42 and residual solvents.3 The near infrared spectroscopy (NIR) (800-2500 nm or 12821-4000 cm-1)41 was reported to be the best method to differentiate between different water species.5 Strong absorption bands for water occur in the NIR spectral region,3,43 especially at 1420/1920 nm43 (7040/5209 cm-1) and 1450/1940 nm3,41 (6897/5150 cm-1). According to Cao et al.,5 NIR spectra at 1860-2020 nm (OH stretching and OH bending) could be deconvoluted into individual spectra corresponding to hydrate and surface water of mannitol. The main IR drawback is its low sensitivity, usually above 100 ppm or 1%.3,33 As water and volatiles are usually present in residual amounts in pharmaceuticals, the IR application becomes limited. Raman spectroscopy is not a good technique for water
determination, but it was applied to monitor changes in the crystal lattice of an API, when the moisture content was reduced from 7 to 1%.42
The nuclear magnetic resonance (NMR) can be used for screening and identification of residual solvents.3,11 However, NMR is also reported to have high detection limits,3 and may not be sufficiently sensitive to determined water and residual solvents in pharmaceuticals. Additionally, the water present in deuterated solvents may be taken into account.
Other methods proposed in the literature to determine water or residual solvents are elemental analysis,11 phosphorus-pentoxide method29 and the azeotropic toluene distillation.31
This work details the studies carried out to determine volatiles, i.e., water and residual solvents, in the first batches INMETRO of the new certified reference materials (CRMs) of captopril, metronidazole and sodium diclofenac, and of the candidate CRMs of potassium diclofenac and furosemide, using five different analytical techniques. The objective was to select the most appropriate method to determine volatiles in order to be used in the mass balance calculation of the API mass fraction in the pharmaceutical CRMs.
Experimental
Karl Fischer coulometric titration and loss on drying
The water mass fraction was determined using a Karl Fischer coulometer (831 model, Metrohm AG, Bleiche West, Switzerland) equipped with a generator electrode without a diaphragm, a current generator electrode (400 mA) and a platinum indicator electrode (10 µA), connected to an oven sample processor (774 model, Metrohm), a stirrer (728 model, Metrohm) and a controller (774 SC model, Metrohm). The experimental conditions were: oven temperature of 80 °C (captopril) and 105 °C (other APIs); end point voltage of 80 mV for captopril and 50 mV for the other APIs, extraction time of 300 s; nitrogen-flow of 100 mL min-1. The results were processed with TiamoT.M. 1.2 software (Metrohm, 2006).
The volatiles were determined by loss on drying, performed at 60 °C under vacuum for 3 h in case of captopril, at 105 °C for 2 h in case of metronidazole and at 105 °C for 3 h for the other APIs, according to the Brazilian Pharmacopeia IV.44
sHS-GC-FID and sHS-GC-MS
For the headspace GC-FID analysis, a Focus gas chromatograph equipped with a Triplus headspace injector (Thermo Scientific, Waltham, MA, USA) was used. The results were processed using Chromquest 5.0 software. The experimental conditions, which were based on the USP 3427 were: WCOT fused silica CP-select 624 (Varian, Inc.; Palo Alto, USA), containing 6% cyanopropyl phenyl and 94% dimethylpolysiloxane, 30 m × 0.32 mm i.d., DF 1.8; helium gas-flow of 2.20 mL min-1 (35 cm s-1 at 40 °C); GC oven temperature gradient of 40 °C (holdtime 20 min), 10 °C min-1 until 240 °C (hold time 20 min); injector temperature of 140 °C; FID temperature of 250 °C; headspace thermostatting temperature of 80° C; headspace thermostatting time of 60 min; needle temperature of 85 °C; pressurization time of 30 s; injection volume of 1 mL; spit-ratio of 1:5. The headspace vials contained 0.5 g API and 6 mL of a mixture DMF-water (5:1, v/v). For the construction of the calibration curves and the determination of the limit of quantification, sixteen individual solutions of ethyl acetate, isopropanol and acetone were prepared in the concentration ranges between 12 and 0.003 mg of solvent in 6 mL of the mixture DMF-water (5:1, v/v).
The headspace GC-MS experiments were carried out in a CP3800 gas chromatograph with a 1200 L triple quadrupole, a 800 interface box and an ADC board from Varian, with a Combi PAL autosampler (CTC Analytics). Varian MS Workstation SP1 (System Control version 6.5) was used for system control. The experimental conditions were: WCOT fused silica CP-select 624 (Varian), as described above; helium gas-flow of 1.0 mL min-1; GC oven temperature gradient of 40 °C (holdtime 20 min), 10 °C min-1 until 240 °C (hold time 20 min); injector temperature of 140 °C; transfer line temperature of 250 °C; ion source temperature of 230 °C; ionization by electron impact at 70 eV; detector voltage of 1200 V; headspace thermostatting temperature of 80 °C; headspace thermostatting time of 30 min; needle temperature of 85 °C; injection volume of 1 mL; spit-ratio 1:10. The MS detector was operated in scan mode from 30 to 500 amu and was turned off during the dimethylformamide elution (tR 25.8-26.5 min). The headspace vials contained 0.1 g API and 3 mL of a mixture DMF-water (1:2 , v/v).
All sample solutions were gravimetrically prepared using an analytical balance (Shimadzu, Tokyo, Japan), model AUW 220D, with resolution of 0.01 mg.
TGA
The thermogravimetric analysis was performed using a TGA/DSC 1 Star System thermogravimetric analyzer
(Mettler Toledo). The temperature calibration of the equipment was carried out using In, Zn, Al, Au and Pd reference materials. The analysis consisted of heating 10-20 mg samples, hermetically sealed in an 70 µL aluminum pan, in the temperature range between 30 and 400 °C at a rate of 2.0 ºC min-1, under dynamic nitrogen gas-flow (50 mL min-1).
ATR-FTIR
For ATR-FTIR (attenuated total reflectance infrared spectroscopy) analysis, a GX Spectrum spectrometer (Perkin-Elmer, Waltham, MA, USA) with diffuse reflectance accessory was used. Spectra were recorded by 16 scans in the range between 7800 and 400 cm-1. A 3 g 100 g-1 water stock solution was prepared in solvent (isopropanol for captopril, methanol for both diclofenacs and acetone for furosemide) and further diluted to 0.3 g 100 g-1. For each API, 500 mg samples were added to six tubes, which received different volumes of the 0.3% water solution (0, 0.2, 0.5, 1.2, 2.5 and 5.0 mL), and then the appropriate solvent volume was added to reach 5 mL (standard addition method). The water concentrations in the tubes that came from the water stock solution were 0, 0.012, 0.030, 0.072, 0.150 and 0.300 g 100 g-1. The total water mass fraction in each tube corresponded to the water from API (to be determined), a known water amount from the stock solution, and a known water amount from the solvent, which was determined by Karl Fischer coulometric titration by direct addition in case of isopropanol and methanol. Software Matlab version 6.5 and PLS Toolbox version 4.21, from Eigenvector Technologies, were used to construct multivariate analysis statistical models to determine the water content in the prepared solutions, which were then subtracted by the water content in the solvents to estimate the water amount in APIs.
Samples, reagents and chemicals
The studies were carried out using the INMETRO first batches of the new CRMs of captopril, metronidazole and sodium diclofenac, as well as the candidate CRMs of potassium diclofenac and furosemide. For the Karl Fischer coulometric titration, a Coulomat AG solution (Riedel-de Haen, Seelze, Germany) was used.
Results and Discussion
Karl Fischer (KF) coulometric titration and loss on drying (LOD) test
Considering the small amount of water in the samples, the coulometric KF titration was considered more appropriate than the volumetric titration. Additionally, since captopril could react with the KF reagent due to the presence of thiol groups, the oven method was preferred over the direct addition method. Figure 1 shows a scatter plot of Karl Fischer vs. loss on drying results for the five studied APIs. It can be seen that captopril, potassium diclofenac and metronidazole deviated from the 45-degree dashed line that corresponds to the agreement between both methods, while furosemide and sodium diclofenac were closer to it. However, the t-test of the results shown in Table 2 indicated that the results of both methods could be considered equivalent only for sodium diclofenac. For furosemide, even if the average results of LOD and KF seemed quite similar, the differences in the standard deviations (and variances) led to non-equivalent results in the t-test.
As can be seen in Table 2, the ratios between the LOD and KF results (LOD/KF ratios) were in the range between 0.85 (furosemide) and 12.0 (metronidazole). The
differences between both method results (LOD - KF) are also shown in this table. Dalton and Hancock6 previously reported larger LOD results at 105 ºC compared to KF results for pharmaceutical excipients, especially in case of low water contents, and presented LOD/KF ratios up to 1.5 (e.g., LOD/KF ratio = 2.56/1.69). Hinz29 also observed quite significantly differences in the results obtained using five techniques to determine volatiles in six substances.
The easiest explanation for the observed differences between the loss on drying and Karl Fischer results is that the KF is insensitive to residual solvents.45 Therefore, APIs were further analyzed by gas chromatography, as described below, in order to verify if the differences observed between the LOD and KF results could be explained by the presence of residual solvents.
Static headspace gas-chromatography with flame i o n i z a t i o n a n d m a s s s p e c t r o m e t e r d e t e c t o r s (sHS-GC-FID and sHS-GC-MS)
The sHS-GC-FID method was based on the general method proposed by the United States Pharmacopeia 2011 (USP 34)27 for determination of residual solvents in pharmaceuticals (USP general method 467). Since only captopril could be dissolved in water (max. 400 mg in 6 mL), different proportions of DMF-water were evaluated for API dissolution. The use of at least 2 parts of DMF for each 4 parts of water (DMF-water 2:4, v/v) was the minimum DMF proportion necessary to dissolve 50 mg of all APIs, being furosemide the most problematic. In order to test larger API masses (500 mg API in 6 mL solution in the headspace vial), the use of DMF-water 5:1 (v/v) as diluent was necessary.
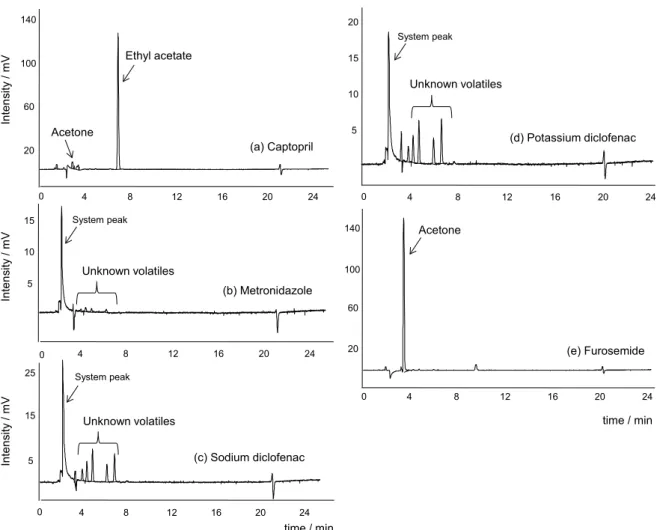
The sHS-GC-FID analysis indicated the presence of a peak with retention times (tR) of 7.1 min for captopril and another peak with tR = 3.4 min for furosemide (Figure 2). For the other APIs, only trace amounts of residual solvents with tR between 3.0 and 10.5 min were observed (notice the different scales of y-axis in Figures 2b, 2c and 2d compared to Figures 2a and 2e). Based on the chromatogram of a
Figure 1. Scatter-plot of Karl Fischer coulometric titration vs. loss on drying results for the five APIs.
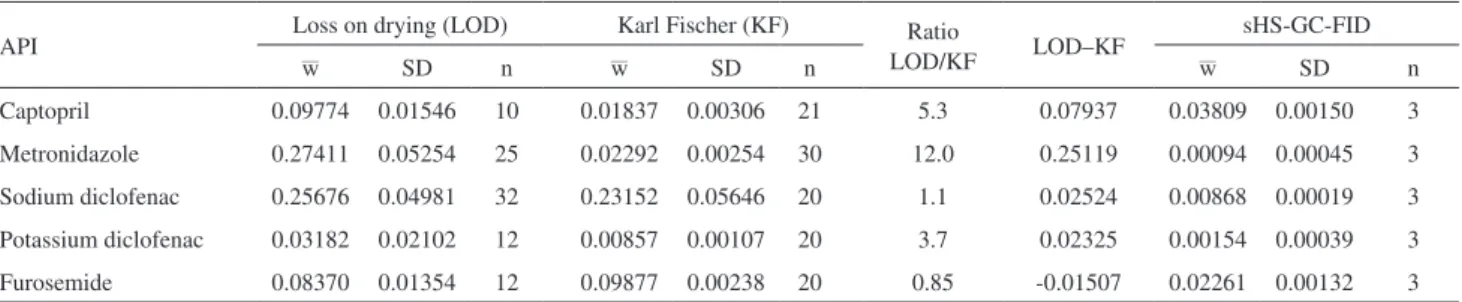
Table 2. Summary of results of loss on drying, Karl Fischer coulometric titration (oven method), and sHS-GC-FID for the five APIs
API Loss on drying (LOD) Karl Fischer (KF) Ratio
LOD/KF LOD–KF
sHS-GC-FID
—
w SD n —w SD n —w SD n
Captopril 0.09774 0.01546 10 0.01837 0.00306 21 5.3 0.07937 0.03809 0.00150 3
Metronidazole 0.27411 0.05254 25 0.02292 0.00254 30 12.0 0.25119 0.00094 0.00045 3
Sodium diclofenac 0.25676 0.04981 32 0.23152 0.05646 20 1.1 0.02524 0.00868 0.00019 3
Potassium diclofenac 0.03182 0.02102 12 0.00857 0.00107 20 3.7 0.02325 0.00154 0.00039 3
Furosemide 0.08370 0.01354 12 0.09877 0.00238 20 0.85 -0.01507 0.02261 0.00132 3
—
standard solvent mixture for sHS-GC-FID (Figure 3), there was an indicative that the captopril and furosemide peaks were ethyl acetate (tR = 7.1 min), acetone (tR = 3.4 min) or isopropanol (tR = 3.7 min).
The sHS-GC-MS analysis confirmed the presence of ethyl acetate (fragment ion: 43.0 amu, tR = 7.0 min) in captopril (and also some traces in sodium diclofenac), as well as the presence of acetone (fragment ions: 58.1 and 43.1 amu, tR = 3.4 min) and isopropanol (fragment ion: 45.1 amu, tR = 3.7 min) in furosemide. Acetone traces were also detected in the other APIs. No other solvent could be identified and the signals eluted after the DMF peak (tR around 26 min) were mainly attributed to column bleeding.
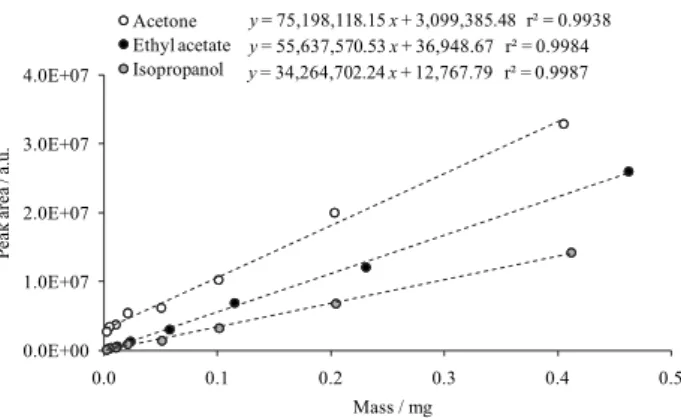
For each of the three solvents (ethyl acetate, isopropanol and acetone), sixteen vials were individually prepared containing increasing solvent masses between 0.003 and 12 mg and 6 mL DMF-water (5:1, v/v), and then analyzed by sHS-GC-FID. The limits of quantitation (S/N = 10, ratio of signal to noise)46 were estimated to be 3.2 µg per vial for ethyl acetate, 4.4 µg per vial for isopropanol and 0.42 µg per vial for acetone,
Figure 2. sHS-GC-FID chromatograms for the five APIs. Experimental conditions: see Experimental section.
Figure 3. sHS-GC-FID chromatograms for a standard misture of solvents: methanol (1) (tR 2.3 min, 1.67 µg g-1), ethanol (2) (tR 3.1 min, 0.56 µg g-1),
diethyl ether (co-eluted with ethanol) (3) (tR 3.2 min, 0.28 µg g-1),
acetone (4) (tR 3.5 min, 0.56 µg g-1), isopropanol (5) (tR 3.8 min,
1.11 µg g-1), acetonitrile (6) (t
R 4.0 min, 1.11 µg g-1), dichloromethane (7)
(tR 4.2 min, 1.67 µg g-1), methyl tert-butyl ether (8) (t
R 4.6 min, 0.56 µg g-1), n-hexane (9) (tR 5.1 min, 1.11 µg g-1), ethyl acetate (10) (tR 7.10 min,
0.56 µg g-1), THF (11) (t
R 7.5 min, 0.28 µg g-1), chloroform (12) (tR 7.7 min,
0.14 µg g-1), n-butyl alcohol (13) (t
R 13.0 min, 1.67 µg g-1), 1,4-dioxane (14)
(tR 14.6 min, 1.67 µg g-1), and toluene (15) (t
R 21.5 min, 0.83 µg g-1).
which were similar to those reported in the literature (0.01-20 µg per vial).37 Considering the API mass of 0.5 g per vial to be later analyzed, the limits of quantification could be expressed as 6.4 ppm for ethyl acetate, 8.8 ppm for isopropanol and 0.83 ppm for acetone.
Calibration curves were then constructed for each of the three solvents, using eight data points in the mass range between the limit of quantitation and 0.5 mg, which was considered the most appropriate working range (Figure 4). After the sHS-GC-FID analysis of the five APIs (0.5 g per vial dissolved in 6 mL DMF-water, 5:1), the curves were used to determine the residual solvents in APIs (external standard calibration). The results can be seen in the last columns of Table 2. For small unknown peaks, the isopropanol calibration curve was considered.
Differences between LOD and KF results
Contrary to the expectations, for captopril, both diclofenacs and metronidazole, the differences between LOD and KF results (LOD - KF) shown in Table 2 could be only partially explained by the presence of residual solvents. One of the reasons for that may be the previously reported difficulty to completely remove polar residual solvents from sample solutions for sHS-GC analysis.33,36 Chen et al.,38 for instance, studied the recoveries of 44 residual solvents in pharmaceuticals and reported values as low as 57% for acetone at 2-90 ppm levels. Another possible reason why the volatile mass fraction did not match the difference LOD - KF may be related to solvent-solute effects,47 which means interactions between APIs and residual solvents in solution.
For furosemide, the LOD/KF ratio of 0.85 may be possibly explained by the presence of acetone as the main residual solvent, as confirmed by sHS-GC-FID and sHS-GC-MS. Acetones (and aldehydes) react with the KF reagent to form acetals and ketals through dehydration,29 which is the probable reason why furosemide showed a
slightly larger amount of water (KF) compared to the total amount of volatiles determined by LOD.
Thermogravimetric analysis
The results for the thermogravimetric analysis (TGA) of the five APIs are shown in Figure 5. For each API, the upper curve corresponds to the API mass vs. the temperature of the experiment (30 to 400 ºC, at 2 ºC min-1 rate), while the lower curve corresponds to its first derivative, which makes easier the identification of the temperatures at which the material degradation occurs. The dark arrows in Figure 5 indicate the decomposition of the analytes. Only for furosemide, a mass loss (around 2.47%) was observed before the main API decomposition signal, at around 210 ºC, in the region indicated by a white arrow in Figure 5e. Previous studies indicated that this mass loss corresponds to one of the three furosemide degradation steps.48 For all APIs, no water loss was observed in the usual range (room temperature to 100 ºC),32 which can be explained by the low TGA sensitivity.
Near infrared spectroscopy
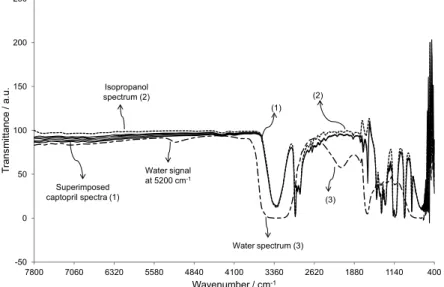
Although it was previously reported in the literature the strong absorption bands for water in the NIR spectral region (7800 to 400 cm-1), for instance at 5209 cm-1,43 the determination of water by ATR-FTIR analysis of solutions containing 0.5 g of API and increasing water amounts (standard addition method) in a specific solvent, combined with multivariate analysis statistical methods for results evaluation, had several drawbacks: (i) due to the low sensitivity of NIR spectroscopy, the water bands for such low water content solutions could not be easily identified in the NIR spectral regions. As an example, the spectra of six captopril solutions added of 0 to 3.75 µg g-1 water were practically superimposed (Figure 6); (ii) metronidazole could not be analyzed since none of the tested solvents was able to dissolve it in the proportion used (0.5 g in 5 mL); (iii) the water mass fractions estimated by chemometric methods corresponded to the sum of the water contents from API and solvent. Therefore, it was necessary to determine the original water content in the solvents by KF coulometric titration, for further subtraction. In the case of furosemide, the only solvent able to dissolve it was acetone, which reacts with the KF reagent and could not be analyzed by this technique.
Even if multivariate analysis statistical models could be constructed from the NIR spectra of captopril (Figure 6) and both diclofenacs, with squared correlation coefficients r2 of at least 0.95, the estimated mass fractions
Figure 5. TGA results for APIs of captopril (a), metronidazole (b), sodium diclofenac (c), potassium diclofenac (d) and furosemide (e). For each API, the curves of mass vs. temperature (upper curve) and the corresponding 1st derivative (lower curve) are shown. The dark arrows show the API decomposition,
while the white arrow indicates a mass loss of 2.47% at 210 ºC for furosemide.
Figure 6. NIR spectra for six captopril solutions in isopropanol containing 0.00, 0.13, 0.36, 0.88 and 3.75 µg g-1 water (superimposed spectra) (1), for
were larger than 1 g 100 g-1, which was clearly a mistaken result. However, the technique may still be considered for APIs with larger water contents.
Conclusions
The determination of volatiles in active pharmaceutical ingredients (API) is essential due to their possible toxicity and influence on the physicochemical and microbiological properties of raw materials and finished pharmaceutical products. Volatiles also have to be quantified in case of determination of API purity by mass balance, as performed in the development of pharmaceutical CRMs.
Five different analytical techniques were applied to three new CRMs of captopril, metronidazole and sodium diclofenac, and to the two candidate CRMs of potassium diclofenac and furosemide. For captopril, both diclofenacs and metronidazole, the differences between the loss on drying (LOD) (quantitation of water and residual solvents) and Karl Fischer (KF) coulometric titration (water quantitation) could be partially explained by the presence of residual solvents determined by sHS-GC-FID, and were mainly attributed to chromatographic recoveries smaller than 100% or possible solvent-solute interactions. For furosemide, the increased KF results (LOD/KF ratio = 0.85) were attributed to the presence of acetone, which reacts with the KF reagent. Therefore, from these three evaluated techniques, the oldest loss on drying technique was considered the most appropriate to determine the mass fraction of the volatiles to be used in the mass balance calculation of API mass fraction in pharmaceutical CRMs.
The two other analytical methods evaluated, TGA and ATR-NIR-chemometrics, were not sufficiently sensitive to determine water or volatiles in the concentration ranges present in APIs. However, they may find application for APIs containing larger volatile mass fractions.
Acknowledgements
The authors thank Nova Analítica Importação e Exportação Ltda for lending the headspace GC-FID system (Thermo Scientific) used in the experiments.
References
1. Caramasu, C.; Madichie, C.; Williams, R.; TrAC, Trends Anal. Chem.2006, 25, 768.
2. D’Autry, W.; Zheng, C.; Wolfs, K.; Yarramraju, S.; J. Sep. Sci. 2011, 34, 1299.
3. Witschi, C.; Doelker, E.; Eur. J. Pharm. Biopharm.1997, 43, 215.
4. Cha, J.; Ranweiler, J. S.; Lane, P. A. In Handbook of Modern Pharmaceutical Analysis; Ahuja, S.; Scypinski, S., eds.; Academic Press: London, 2001.
5. Cao, W.; Mao, C.; Chen, W.; Lin, H.; Krishnan, S.; Cauchon, N.;
J. Pharm. Sci.2006, 95, 2077.
6. Dalton, C. R.; Hancock, B. C.; Int. J. Pharm. 1997, 156, 143. 7. Jain, R.; Railkar, A. S.; Malick, A. W.; Rhodes, C. T.; Shah,
N. H.; Eur. J. Pharm. Biopharm.1998, 46, 177.
8. Fliszar, K.; Wiggins, J. M.; Pignoli, C. M.; Martin, G. P.; Li, Z.;
J. Chromatogr., A2004, 1027, 83. 9. Isengard, H.; Food Chem.2008, 106, 1393.
10. Ishikawa, K.; Hanari, N.; Shimizu, Y.; Ihara, T.; Nomura, A.; Numata, M.; Yarita, T.; Kato, K.; Koichi, C.; Accredit. Qual. Assur.2011, 16, 311.
11. Yip, Y.; Wong, S.; Choi, S.; TrAC, Trends Anal. Chem.2011,
30, 628.
12. Gorog, S.; J. Pharm. Biomed. Anal.2005, 36, 931.
13. ISO Guide 34: General Requirements for the Competence of Reference Material Producers, ISO: Geneva, 2009.
14. ISO Guide 35: Reference Materials: General and Statistical Principles for Certification, ISO: Geneva, 2006.
15. Joint Committee for Guides in Metrology (JCGM); International Vocabulary of Metrology: Basic and General Concepts and
Associated Terms (VIM), 3rd ed.; BIPM: Sèvres, France, 2008.
16. Duewer, D. L.; Parris, R. M.; White, E. V.; May, W. E.; Elbaum, H.;
An Approach to the Metrologically Sound Traceable Assessment
of the Chemical Purity of Organic Reference Materials; National Institute of Standards and Technology (NIST): Gaithersburg, USA, 2004.
17. ABNT NBR ISO/IEC 17025: Requisitos Gerais para Competência de Laboratórios de Ensaio e Calibração, ABNT: Rio de Janeiro, Brasil, 2005.
18. United States Pharmacopeial Convention, http://www.usp.org accessed in March 2012.
19. National Metrology Institute of Japan (NMIJ), List of NMIJ Certified Reference Materials, http://www.nmij.jp/english/ service/C/crm/ accessed in March 2012.
20. Liu, J.; Yang, G.; Acta Metrol. Sin.2010, 31, 135.
21. Nogueira, R.; Rego, E. C. P.; Sousa, M. V. B.; Wollinger, W.; Silva, T. E.; Moreira, G. F.; Barin, J. S.; Laporta, L. V.; Mesko, M. F.; Bittencourt, C. F.; Rodrigues, J. M.; Cunha, V. S.; Braz. J. Pharm. Sci.2011, 47, 339.
22. Nogueira, R.; Wollinger, W.; Silva, T. E.; Oliveira, L. M.; Rego, E. C. P.; Moreira, G. F.; Barin, J. S.; Laporta, L. V.; Mesko, M. F.; Bittencourt, C. F.; Rodrigues, J. M.; Cunha, V. S.; Braz. J. Pharm. Sci.2011, 47, 351.
24. De Caro, C. A.; Aichert, A.; Walter, C. M.; Food Control2001,
12, 431.
25. Emery, E.; Oliver, J.; Pugsley, T.; Sharma, J.; Zhou, J.; Powder Technol.2009, 189, 409.
26. International Conference on Harmonisation of Technical Requirements for Registration of Pharmaceuticals for Human Use (ICH); Guideline for Residual Solvents Q3C(R5); ICH: London, 2011.
27. The United States Pharmacopeia, USP 34-NF 29, The United States Pharmacopeial Convention: Rockville, 2011.
28. Grünke, S.; Food Control2001, 12, 419.
29. Hinz, D. C.; J. Pharm. Biomed. Anal.2007, 43, 779.
30. Felgner, A.; Schlink, R.; Kirschenbühler, P.; Faas, B.; Isengard, H.;
Food Chem.2008, 106, 1379.
31. Sherman, F.; Kuselman, I.; Int. J. Pharm.1999, 190, 193. 32. Towns, J. K.; J. Chromatogr., A1995, 705, 115. 33. B’Hymer, C.; Pharm. Res.2003, 20, 337.
34. Hong, L.; Althofer, H. R.; Pharm. Acta Helv.1997, 72, 95. 35. Mulligan, K. L.; Brueggemeyer, T. W.; Crockett, D. F.;
Schepman, J. B.; J. Chromatogr., B: Anal. Technol. Biomed. Life Sci.1996, 686, 85.
36. Pandey, S.; Pandey, P.; Kumar, R.; Singh, N. P.; Braz. J. Pharm. Sci.2011, 47, 379.
37. Sitaramaraju, Y.; van Hul, A.; Wolfs, K.; van Schepdael, A.; Hoogmartens, J.; Adams, E.; J. Pharm. Biom. Anal.2008, 47, 834.
38. Chen, C.; Liu, S.; Mueller, B.; Yan, Z.; J. Chromatogr., A2010,
1217, 6413.
39. Otero, R.; Carrera, G.; Dulsat, J. F.; Fábregas, J. L.; Claramunt, J.;
J. Chromatogr., A2004, 1057, 193.
40. Cervera, M. I.; Beltran, J.; Lopez, F. J.; Hernandez, F.; Anal. Chim. Acta2011, 704, 87.
41. Roggo, Y.; Chalus, P.; Maurer, L.; Lema-Martinez, C.; Edmond, A.; Jent, N.; J. Pharm. Biomed. Anal.2007, 44, 683.
42. Hausman, D.; Cambron, R. T.; Sakr, A.; Int. J. Pharm.2005,
229, 19.
43. Zhou, X.; Hines, P.; Borer, M. W.; J. Pharm. Biom. Anal.1998,
17, 219.
44. Farmacopeia Brasileira, 4a. ed.; Atheneu: São Paulo, Brasil, 2002.
45. Smith, R. J.; Webb, M. L.; Analysis of Drug Impurities; Blackwell Publishing: Oxford, 2007.
46. International Conference on Harmonisation of Technical Requirements for Registration of Pharmaceuticals for Human Use (ICH); Validation of Analytical Procedures: Text and Methodology Q2(R1); ICH: London, 2005.
47. Kumar, N.; Gow, J. G.; J. Chromatogr., A1994, 667, 235. 48. Valladao, D. M. S.; Oliveira, L. C. S.; Netto, J. Z.; Ionashiro, M.;
J. Therm. Anal.1996, 46, 1291.
Submitted: December 7, 2011