BJRS
RADIATION SCIENCES
07-2A (2019) 01-10ISSN: 2319-0612 Accepted: 2018-11-30
Pile-up correction for coincidence counting
using a CAEN 1724 digitizer
Guilherme S. Zahn, Iberê S. Ribeiro Jr., Frederico A. Genezini
Instituto de Pesquisas Energéticas e Nucleares (IPEN / CNEN – SP, Av. Professor Lineu Prestes 224 05508-000 São Paulo, SP- [email protected]
ABSTRACT
In conventional gamma-ray spectrometry, the probability of pile-up effects is considered to be proportional to the dead-time, and is usually neglected for low dead-times (below 4-5%). In gamma-gamma coincidence spectrometry, though, while the dead time takes into account only events that are actually digitized, the pile-up effects are proportional to the actual gamma-ray detection rate in each detector, not only to the ones that trigger the coincidence gate. Thus, the pile-up corrections may not be so easy to assess as in single spectrometry systems. In this work, a system composed of two HPGe detectors coupled to a CAEN v1724 digitizer is studied. A 3kBq 60Co source was analyzed, both alone and in the presence of other radioactive sources (137Cs, 133Ba and 152Eu), and the resulting coincidence peak areas were compared to assess the effectiveness of two distinct corrections: a simple normalization by the live time of acquisition and the normalization by the count rate obtained using a pulse generator. The results obtained stress the need to use the pulse generator in this specific setup in order to get accurate results.
1. INTRODUCTION
In gamma-ray spectrometry, analog voltage pulses from a detector are digitized and transformed to a discrete scale, usually either from 1 to 4096 (12 bits) or from 1 to 8192 (13 bits), and then histogrammed to build a spectrum. The digitalization process is rather fast, taking at most a few microseconds per pulse [KNOLL, 2011], but still there is the possibility that two (or more) pulses arrive at the analog-to-digital converter (ADC) within this time period, resulting in a mistaken result at the output of the ADC – this effect is usually referred to as “pulse pile-up”.
In conventional gamma-ray spectrometry, where a single HPGe detector is used, the probability of pile-up effects is considered to be proportional to the system’s dead-time (the amount of time where the system is actually frozen, waiting for the ADC to perform the conversion), and the treatment of pile-up is usually neglected for low dead-times (below 4-5%). In fact, a previous work has shown that, both for conventional and Digital Signal Processing – DSP – systems, the pile-up corrections are sufficiently low for dead-times below 10% [MASCARENHAS, 2015].
Gamma-gamma coincidence, however, is a technique where two or more detectors are used, and the system only records events in which two or more detectors have registered the detection of radiation within a given time window. In this case, the detection efficiency is drastically reduced by the coin-cidence requirement, so the rate of registered events – and, consequently, the dead time – is quite low.
Opposite to the dead time, though, the pulse pile-up probability isn’t reduced by the low detection rate, as it only depends on the total gamma-ray emission rate, not on the rate in which events are recorded. For this reason, the pile-up corrections may not be so easy to assess as in single spectrom-etry systems, and it is expected that this correction may be rather large and somewhat independent of the count rate, especially when intense non-coincident gamma-rays are present.
1.1. The Pulser Method
One of the most frequently used methods for the correction of count losses in nuclear spectroscopy is the pulser method [WIERNIK, 1971], which consists in using a pulse generator coupled to the input of the acquisition system. In this case, the pulser will produce a peak in the gamma-ray
spec-trum, and the total area of this peak can be used as a very precise chronometer – ideally, the peak area would be the sum of all pulses emitted by the generator during the experiment but, as these pulses are subjects to the same losses as the detector’s ones, the effective area can be used to pre-cisely estimate the total count losses, either from pile-up, dead time or any other possible sources. In this method, the observed area (or count rate) of each peak in the spectrum is divided by the area (or count rate) of the pulser peak; in absolute measurements, this result is then multiplied by the pulser frequency in order to obtain the true count rate for each peak, but in relative measurements this latter procedure can be safely disregarded, provided that the pulse generator frequency remains constant.
In gamma-gamma coincidence experiments, the pulser must be coupled to the input of all detectors, and the coincidence between generator-originated pulses must be used as the normalization factor [YOHO, 2016].
2. MATERIALS AND METHODS
The detector setup consisted in two coaxial Ortec HPGe detectors (10% and 15% nominal rela-tive efficiency), positioned at 180 degrees from each other, with a face-to-face distance of 3.0 cm, where the radioactive sources are positioned halfway. The detectors were directly coupled to a CAEN v1724PHA Digital Signal Processing (DSP) acquisition system, which was then connected to a PC and controlled by CAEN’s MC2 Analyzer software [CAEN, 2017]. A Ortec 419 pulser was coupled to the “test” input of both detectors, and the pulse height was selected so that in one of the detectors it appeared in the region above 2000 keV, which is clean of spectral interferences – as the detectors have different characteristics, in the other detector the pulser peak appeared at 770 keV. As the region around 770 keV is very interference-prone, a choice was made to perform the gates in the 2100 keV peak on the other detector, and then, as the resulting “coincidence-gated” spectra are very clean of interferences (as only events coincident with the 2100 keV peak are recorded, Comp-ton, bremsstrahlung and spectral interferences are removed), the 770 keV peak area on those spectra can be precisely analyzed. As the observed time resolution of the system was of approximately
200ns, the coincidence resolution time was set to 800ns, in order to allow for precise subtraction of accidental events.
2.1. Data Acquisition, Reduction and Analysis
The data acquisition was performed in “list mode”, where the acquisition system generates a list of the registered events one by one, and the histogramming is performed off-line. As the CAEN sys-tem generates one output file for each detector with the timestamp of the event (in tens of ns from the start of acquisition) and the channel, the first step was to compare the timestamps and align the coincident events (the CAEN system generates some “ghost”, non coincident events in the final list mode file, so these had to be properly eliminated), generating a single file where coincident events are registered sequentially, with three fields: time difference between detectors, channel in detector 1 and channel in detector 2.
The total events in these list mode files were histogrammed for both detectors and for the time dif-ference, and the time spectrum was used to define the region of interest and the regions where events are considered to be completely accidental (see Fig.1), so that the accidental coincidences can be properly subtracted from the total events (see, for instance, [WAPSTRA, 1965]), generating a gamma-gamma matrix of real coincidence events and one spectrum file with the total real events for each detector.
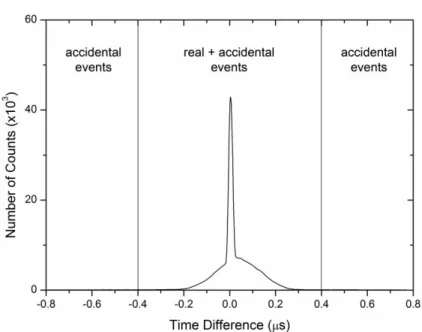
Figure 1: Typical time spectrum showing the regions where events can be considered accidental
and the region where there are both real and accidental events – the narrow peak originates from the pulser, whereas the wider one is from the detector events.
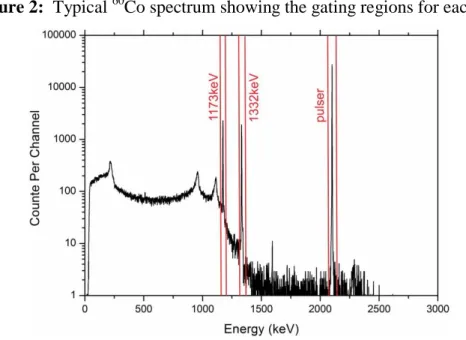
Finally, using the total projection spectrum from detector #1, the regions associated with both 60Co peaks and with the pulse generator were selected (see Fig.2) and the gamma-gamma matrix was “gated” in each of these regions, generating one “gated” spectrum for each of these peaks contain-ing only the gamma-rays that were detected in coincidence with that particular peak. These gated spectra were then analyzed using Canberra’s Genie2000 software, generating a list of the identified peaks, their count rates (counts per second of live time, as reported by the acquisition system) and the uncertainty.
Figure 2: Typical 60Co spectrum showing the gating regions for each peak.
For each measurement, the peak rates obtained for the interest peaks in the gated spectra (1332keV in the 1173keV-gated spectra, 1173keV in the 1332keV-gated spectra) were averaged (weighted averages were adopted) and then the final results were analyzed in two different ways:
• To check if the pulser correction is really required, the count rate averages (which had already been tentatively corrected for the dead time, as the total counts were divided by the live time re-ported by the CAEN system) obtained for 60Co in each measurement were compared to the count rates obtained when only the 60Co source was present – these results were labeled “uncorrected”; • To check if the pulser correction is effective, for each measurement the count rate averages ob-tained above were divided by the pulser count rates (the count rate of the 770keV peak observed in the 2100keV-gated spectra) obtained for the same measurement, and these results were then compared.
2.2. Radioactive Sources and Dead Time Compensation
For the verification of the correct compensation for count losses, first a calibrated 60Co source was counted and the count rates for the coincidence peaks (1173 x 1332 keV and 1332 x 1173 keV) were obtained, together with the pulser coincidence peak. Then, the same 60Co source was counted, in the exact same geometry, together with combinations of 137Cs, 133Ba, and 152Eu sources, in order
to verify if the registered 60Co count rate is constant – as it should if the count losses are well taken care of, as the 60Co source and geometry are the same. The activities of these radioactive sources are shown in Table 1. The additional sources selected all had much larger activities than the 60Co source, in order to thoroughly test the corrections, and it must be noted that, while 133Ba and 152Eu contribute to both dead time and pile-up, the decay of 137Cs doesn’t produce any real coincident gamma rays, so it will contribute only to pile-up, and not to dead time.
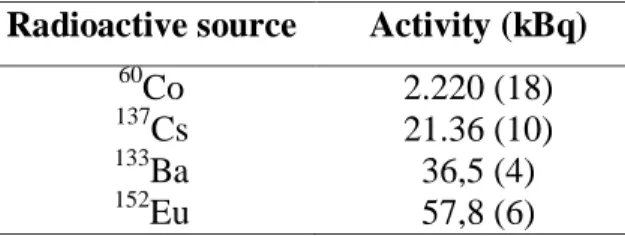
Table 1: Radioactive sources used in the experiment and their present activities. Radioactive source Activity (kBq)
60 Co 2.220 (18) 137 Cs 21.36 (10) 133 Ba 36,5 (4) 152 Eu 57,8 (6)
The source combinations used were: • 60
Co source alone (used as benchmark); • 60
Co + 137Cs (to check for increased pile up without increasing dead time); • 60
Co + 133Ba and 60Co + 152Eu (both to check for general increase in count losses); and • 60
Co + 152Eu + 137Cs (to check corrections under a quite high activity).
3. RESULTS AND DISCUSSION
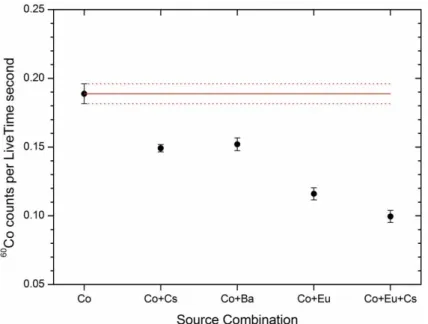
The results obtained for the 60Co count rates without the pulser correction are shown in Fig.3, where it is clear that the simple division by the live time is definitely not sufficient to compensate for the count losses. The comparison of the results obtained with the addition of 137Cs and 133Ba show that the fact that 137Cs doesn’t contribute to the dead time is rather irrelevant, as with both sources the results are quite similar. It can also be noticed that in the worst case the count losses are above 60%.
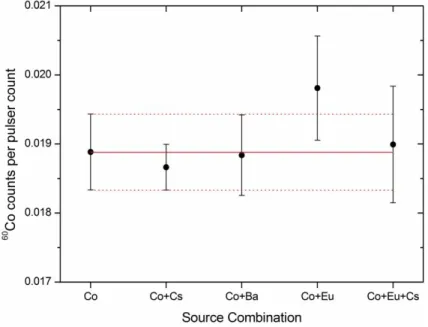
When the pulse generation correction was applied, we obtained the results shown in Fig.4, where it can be noticed that this correction effectively compensated for the count losses, with consistent re-sults for the 60Co count rates, even in the worst case, when the 60Co source was counted together with both the 152Eu and the 137Cs sources, where the total activity of the other radioactive nuclides was more than 35 times larger than the activity of 60Co. This last test, designed to check the effi-ciency of the pulser correction in an extreme scenario, demonstrated that the real 60Co count rate could be well-determined even when under the influence of other, much stronger, radioactive sources.
Figure 3: Count rates observed for the same 60Co source under different source combina-tions – the red lines represent the results obtained without any additional sources (full line)
Figure 4: Figure 4: Pulser-corrected count rates observed for the same 60Co source under different radioactive source combinations – the red lines represent the results obtained
without any additional sources (full line) and its 1- uncertainty (dotted lines).
4. CONCLUSION
The results obtained show that a careful correction for count losses is essential in the analyses of gamma-gamma coincidence measurements performed using the CAEN v1724 system, as the simple dead time correction often used in singles spectroscopy, when the final counts are divided by the live time of acquisition, resulted in losses of up to 60%. On the other hand, the results show that the use of a pulse generator effectively compensated for the count losses, even in the case when the total added activity was 35 times larger than the activity of the original 60Co source.
5. ACKNOWLEDGMENT
The authors would like to thank the staff in the Nuclear Activation Laboratory (LAN) and in the Nuclear Metrology Laboratory (LMN) for lending their radioactive sources, without which this work wouldn’t have been possible.
REFERENCES
CAEN MC2Analyzer User Manual: Software for digital Multi Channel Analyzer. Viareggio, Italy, 2017. Available at: http://www.caen.it/servlet/checkCaenManualFile?Id=12608. Last Ac-cessed: 07 Nov. 2017.
KNOLL, G. F. Radiation Detection and Measurement, Hoboken: John Wiley & Sons, 2011. MASCARENHAS, P. H. A.; GENEZINI, F. A.; ZAHN, G. S., Efficiency stability in HPGe detec-tors, In: XXXVIII REUNIÃO DE TRABALHO SOBRE FÍSICA NUCLEAR NO BRASIL, 2015, Mangaratiba, Proceedings. São Paulo, Sociedade Brasileira de Física, 2015.
WAPSTRA, A. The coincidence method. In: SIEGBAHN, K. Alpha-, Beta- and Gamma-Ray
Spectroscopy, Amsterdam: North-Holland, 1965. p. 539-555.
WIERNIK, M. Comparison of several methods proposed for correction of dead-time losses in the gamma-ray spectrometry of very short-lived nuclides. Nucl. Instrum. Meth. v. 95, p.13-18, 1971. YOHO, M.; LANDSBERGER, S. Determination of Selenium in coal fly ash via – coincidence neutron activation analysis. J. Radioanal. Nucl. Chem. v. 307, p.733-737, 2016