of Chemical
Engineering
www.scielo.br/bjcePrinted in BrazilVol. 35, No. 01, pp. 141 – 146, January – March, 2018
* Corresponding Author: Manuel Andrés Rodrigo. E-mail: [email protected] dx.doi.org/10.1590/0104-6632.20180351s20160411
OPTIMIZATION OF THE PERFORMANCE OF
A MICROBIAL FUEL CELL USING THE RATIO
ELECTRODE-SURFACE AREA /
ANODE-COMPARTMENT VOLUME
Eduardo D. Penteado
1, Carmen Maria Fernandez-Marchante
2, Marcelo Zaiat
1,
Ernesto Rafael Gonzalez
3and Manuel Andrés Rodrigo
2,*1 Laboratório de Processos Biológicos, Centro de Pesquisa, Desenvolvimento e Inovação em Engenharia Ambiental, Escola de Engenharia de São Carlos (EESC), Universidade de São Paulo (USP), Engenharia Ambiental - Bloco 4-F,
Av. João Dagnone, 1100, Santa Angelina, 13.563-120 São Carlos, SP, Brazil
2 Department of Chemical Engineering, University of Castilla-La Mancha, Enrique Costa Building, Campus Universitario s/n, 13071 Ciudad Real, Spain
3 Departamento de Físico Química, Instituto de Química de São Carlos (IQSC), Universidade de São Paulo (USP), Avenida Trabalhador São-carlense, 400 - CEP 13566-590 São Carlos, SP 13560-970, Brazil
(Submitted: July 4, 2016; Revised: September 25, 2016; Accepted: October 5, 2016)
Abstract – This paper focus on the determination of the influence of the electrode-surface area / anode-compartment volume ratio (ESAVR) on the performance of microbial fuel cells (MFC), both in terms of the generation of electricity
and the removal of organic matter from waste. Real wastewater coming from a winery factory was used and five
ESAVRs were tested in separate MFCs, ranging from 0.15 to 0.75cm2cm-3. Results demonstrate that the electricity generation increases by decreasing the anode-compartment volume. Thus, by increasing ESAVR, maximum current density increased from 583 to 2416 mA m-2. However, the COD removal was found to be more efficient upon decreasing the ESAVR (from 590 to 1075 mg COD L-1 d-1). Results are of extreme significance for the mechanical design of MFC in order to optimize their performance during normal operation.
Keywords:Microbial fuel cells; anode-compartment volume; electrode surface; energy recovery; winery wastewater.
INTRODUCTION
Microbial fuel cells (MFC) convert the chemical energy stored in organic and inorganic molecules directly into electricity, using microorganisms as biocatalysts (Rodrigo et al., 2007; Dumas et al., 2008; Logan, 2010; Kim et al., 2015b; Kim et al., 2015c). Microorganisms oxidize organic matter on the anode, producing electrons, which move through an external electrical circuit towards
the cathode, reducing an electron acceptor (Chae et al., 2009). Transport of ions through the bulk liquid or through an ion selective membrane keeps the charge balance in the fuel cell (Rabaey and Verstraete, 2005; Logan et al., 2006). Several parameters, such as operating conditions,
reactor configuration, electrode material, membrane type,
electrode surface area and external resistance are known to
influence MFC performance and they are typically studied in the literature (Lepage et al., 2012). Thus, great efforts
optimizing system configurations and materials (Franks and Nevin, 2010), and significant progress has been
made in the past few years. Nevertheless, the power
output of a MFC achieved presently is still insufficient for
practical application. Because of that, the studies about energy harvesting are still being focused on small-load applications because the output energy is too small to drive electronics with high-power requirement. Electric devices such as DC motors (pumps) with a demand for amp-level current and high voltage input are rarely investigated
in the MFC studies (Winfield et al., 2012; Erbay et al.,
2015; Ge et al., 2015; Sevda et al., 2016). More common is the development of miniature microbial fuel cells (mini-MFCs) (Chen et al., 2011). Due to a miniature volume and a low substrate consumption, the mini-MFC is especially recommended for medical, communication and other areas, and it is also suitable for evaluating the electricity generation characteristics of microorganisms, such as electrochemical activity, maximal potential, and power density (Qian and Morse, 2011; Chae, 2012; Ren et al., 2012; Mink and Hussain, 2013; Mink et al., 2014; Zuo et al., 2015; Yang et al., 2016b). Various mini-MFCs have been proposed in the literature, including a
high-power-density mini-MFC (Ringeisen et al., 2006), biofilm enhanced mini-MFC (Biffinger et al., 2007a), nanoporous filter MFC (Biffinger et al., 2007b, c), on-chip MFC
(Tominaka et al., 2008)), polydimethylsiloxane mini-MFC (Siu and Chiao, 2008), and mini-MFCs arrays (Chen et al., 2011; Hou et al., 2012). MFCs may also be used to measure water quality since the bacterial metabolism and growth will be impacted by the toxic components in water, such as formaldehyde, benzene, hexane, toluene, and heavy metals (Di Lorenzo et al., 2014; Kim et al., 2015b; Yang et al., 2016a).
However, to our best knowledge, there are no studies on
the effects of anode volume and relation of electrode surface
area/anode compartment volume on MFC performance, and it is potentially a very interesting possibility to improve power densities. Therefore, in this work, the objective has
been to determine the influence of the ratio between the
electrode surface and the anode-compartment volume on microbial fuel cell (MFC) performance, characterized both in terms of electricity generation and removal of organic matter. To do this, electrode surface /anodic compartment volume ratios (ESAVR) ranging from 0.15 to 0.75 cm2 cm-3
have been tested with five different MFC operated under
the same operating conditions and fed with real winery wastewater.
MATERIALS AND METHODS
Microbial fuel cell set-up. The MFC used was a dual chamber separated by using a Sterion® membrane as proton exchange membrane. The cathode volume was 4 cm3 and the anode volumes were 4, 8, 12, 16 and 20 cm3,
depending on the experiment. Carbon felts (KFA10, SGL Carbon Group®) were used as electrodes in both chambers (3 cm2 each). The distance between anode and cathode was 1 cm, and it was kept in all experimental conditions. To modify the anode volume, 1, 2, 3 and 4 resin-coated polymer frames were added in the anode of the MFC to attain a total anode volume of 8, 12, 16 and 20 cm3.
An external resistance of 120 Ω was connected to the electrodes. The five MFCs were operated simultaneously
in semi-continuous mode and at room temperature (25 ± 3 °C). The anode chamber was connected to a reservoir of 110 cm3 and a peristaltic pump was used to circulate the
anolyte with a flow of 25 cm3 min-1. Every day 50 cm3 of liquid was removed from the anode chamber and replaced by fresh wastewater. The cathode compartment of the MFC was connected to a water reservoir of 250 cm3 and a peristaltic pump was used to circulate an HCl solution (pH 3.5) from the reservoir through the cathode chamber of the MFC at 25 cm3 min-1. An aquarium aerator and porous
stone diffusers were used for supplying the oxygen to the
cathode reservoir and chamber.
Characterization techniques. A digital multimeter (Keithley 2000 Multimeter) was connected to the system to monitor continuously the value of the cell voltage at the
value of the external load (120Ω). Chemical oxygen demand
(COD) was determined using a Velp ECO-16 digester and a Pharo 100 Merck spectrophotometer analyzer and pH, conductivity and dissolved oxygen were measured with a GLP22 Crison pH meter, a Crison Cm 35 conductivity meter and an Oxi538 WTW oxy meter, respectively. Polarization curves were recorded periodically and
obtained by replacing the external resistance with different
loads. Three important parameters were evaluated: the open circuit voltage (OCV) or the maximum allowable MFC voltage, the maximum intensity and the maximum power density of the MFC. In addition, the shape of curves gives important information about the limiting processes, which control the performance of the cell.
Inoculum and wastewater. The microorganisms used in the anode compartment were obtained from the activated sludge reactor at the municipal Wastewater Treatment Plant of Ciudad Real (Spain) and concentrated by sedimentation. The amounts of the total suspended solids and total volatile solids were 15.8 and 11.1 g dm-3, respectively. The anode compartment was inoculated with 90% of activated sludge and 10% winery wastewater. Winery wastewater samples were collected from the regulating reservoir of the industrial wastewater treatment plant of the winery Bodegas Crisve (Socuéllamos, Spain), and stored at 4°C before being used. The characteristics were COD 6850 mg dm-3, BOD
5 5000 mg dm-3, TOC 1030 mg dm-3, Total Nitrogen 18.3 mg dm-3, Total Phosphorus 0.95 mg dm-3 with resulting pH of 4.11 and conductivity of 2030 mS cm-1. NaHCO
3 (6000 mg
dm-3) was used as buffer to adjust the pH to 6.5. Dibasic
((NH4)2SO4) were added to increase the phosphorous and nitrogen concentrations up to values needed to avoid nutrient
limitation of the efficiency of the process.
RESULTS AND DISCUSSION
Performance of a MFC has to be characterized in terms
of treatment efficiency and electricity production. The
target for MFC operation is always to obtain high values for both parameters. However, this goal is not always easy to
be reached, because while the treatment efficiency depends
on the total population of microorganisms, the electricity production depends only on the percentage of electrogenic microorganisms within this total population. These electrogenic microorganisms are in direct competition with anaerobic microorganisms in MFC and an increase in the volume of the anode-compartment cell could not always
have a positive effect on their predominance. In fact, the formation of biofilms of electrogenic microorganisms on the surface of the anode could be negatively affected by
this competition, especially if microorganisms contained in the suspended culture succeed in the competition for the substrate.
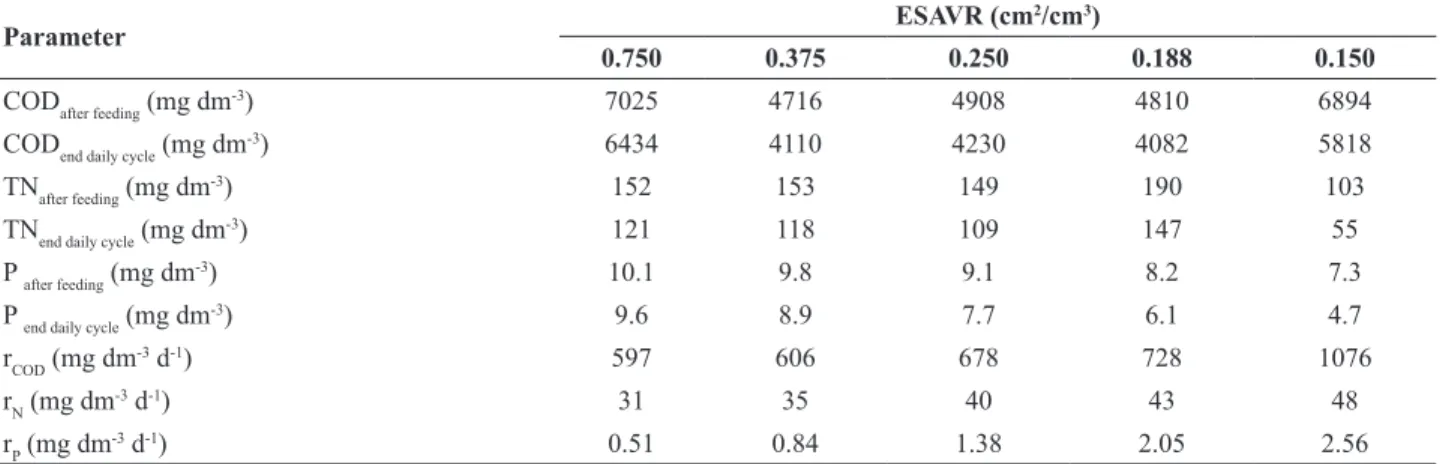
Taking into account this remark, Table 1 shows the average values of the COD, nitrogen and phosphorus measured before and after the daily feeding cycles, for each
ESAVR studied, once the performance of the five MFCs
studied in this work had met the steady state. As it can be seen, just a small part of the organic matter contained in the feeding wastewater was removed during the operation of the MFC. In addition, the COD removal clearly depends on the ESAVR: the higher the anode-compartment volume, the higher is the COD consuming rate (removed organic loading rate). In the MFC operated with 4 cm3 of anode chamber (ESAVR of 0.75 cm2 cm-3), the daily COD consumption rate was 597 mg COD L-1 d-1. When the
volume increased five times up to 20 cm3 (ESAVR of
0.15 cm2 cm-3), the daily COD consumption rate almost
doubled, reaching 1076 mg COD L-1 d-1. As expected, the TN and TP consumption rates show the same behavior as the organic matter removal and higher anode-compartment volumes led to higher consumption of nutrients, indicating
a positive effect on the degradation of the waste and a
promotion of the formation of biomass. Thus, when the MFC was operated with an anodic compartment of 4 cm3, the MFC yields the minimum average consumption rate of TN and TP (31 mg TN L-1 d-1 and 0.5 mg TP L-1 d-1, respectively). Using 5 times more anode-compartment volume, the TN and TP consumption rate increases, reaching the value of 48 mg TN L-1 d-1 and 2.6 mg TP L-1 d-1. The relationship between N/COD consumption was close to 0.05 while the P/COD was only 0.0016, and both values are low in comparison with the values typically reported for biological wastewater treatment processes,
which are 0.12 and 0.02, respectively. This difference
can be explained in terms of the special characteristics of the wastewater used, which comes directly from a winery factory. As it was pointed out in a previous work (Penteado et al., 2016), the unbalanced COD:N:P ratios is one of the biggest problems found in treating this type of wastewater with biological processes.One important observation is that concentrations of COD, TN and TP did not become the liming step in MFC operation because the concentration at the end of each daily feeding cycle is not negligible. Figure 1
depicts the average daily voltage generated by the five
MFCs studied in this work. This cell voltage is produced by connecting the MFC to a 120 ohm resistance (electric load).
The five tests show the same trends with an increase in
the cell voltage from the startup stage up to a steady state
value in which cell voltage fluctuates. This fluctuation is
characteristic of biological processes and can be explained in terms of the multiplicity of processes happening simultaneously in the cell, which are not damped because
of the low solid retention time. In comparing the different tests, there is a clear influence of the anode-compartment
volume on the production of electricity and a huge
Table 1. Average values of COD, total nitrogen and total phosphorus before and after feeding cycle and the consuming rate in the
different ESAVR.
Parameter ESAVR (cm
2/cm3)
0.750 0.375 0.250 0.188 0.150
CODafter feeding (mg dm-3) 7025 4716 4908 4810 6894
CODend daily cycle (mg dm-3) 6434 4110 4230 4082 5818
TNafter feeding (mg dm-3) 152 153 149 190 103
TNend daily cycle (mg dm-3) 121 118 109 147 55
P after feeding (mg dm-3) 10.1 9.8 9.1 8.2 7.3
P end daily cycle (mg dm-3) 9.6 8.9 7.7 6.1 4.7
rCOD (mg dm-3 d-1) 597 606 678 728 1076
rN (mg dm-3 d-1) 31 35 40 43 48
difference is observed between the two extreme values
tested in this work. The highest average cell voltage was observed in MFCs operated with 4 and 8 cm3 (87 mV, with a maximum peak of 117 mV) and the lowest was reached in the fuel cell operated with 20 cm3 of anode compartment (21 mV). It is also important to point out that there are very
small differences between the cell operated with ESAVR
of 0.75 and 0.375 cm2 cm-3 and experimental results almost overlap. In fact, this is the same behavior observed for
the influence of the organic load (with COD consumption
rates of nearly 600 mg COD L-1 d-1 in both cases). On the contrary, from these values the resulting cell voltage
decreases significantly while the COD consumption rate
increases. Hence, the cell current density increased from 583 to 2416 mA m-2 when the ESAVR increased from 0.15 to 0.75 cm2 cm-3 (Figure 2), which indicates that lower anode volume enhanced the MFC power generation, suggesting a
very important role of microorganisms fixed in the anodic biofilm on the performance of the MFC. At this point, it is
important to take into account that the intensity produced by a MFC can be related to the fraction of COD consumed by electrogenic microorganisms through equation 1, where j is the current density, A is the electrode surface area, F is the Faraday constant and rCOD is the total COD consumption rate (Rodrigo et al., 2007).
Figure 1. Daily voltage profile of cell voltage in the five MFCs operated at ESAVR of ● 0.150 cm2 cm-3, * 0.188 cm2 cm-3, ♦ 0.250 cm2 cm-3, ▲ 0.375 cm2 cm-3, ■ 0.750 cm2 cm-3.
(1)
By applying this expression to experimental results it was found that the fraction of COD consumed by electrogenic microorganisms decreases 7.95, 6.83, 3.02, 2.08 and 1.06% respectively in the tests with ESAVR of 0.75, 0.375, 0.25, 0.188 and 0.15 cm2 cm-3. This clearly indicates a higher population associated with the electrode surface, promoted by the lower volume of anode chamber in which other microorganisms can compete for the substrate.
For each test, polarization curves were recorded and they showed a similar behavior to that observed in the resulting cell voltages, as can be seen in Figure 2, with better performance for lower anode volumes of MFC. It is important to point out that the test carried out at 0.375 cm2 cm-3 gives a better performance than the test carried out at 0.75 cm2 cm-3.
Thus, when the cell was operated with the highest anode volume (20 cm3), the MFC showed the minimum power density of 89 mW m-2. Decreasing the anode volume down to 4.0 cm3(and, hence, increasing the ESAVR up to 0.375-0.75 cm2 cm3) leads to a significant increase in the power
densities: the maximum power densities were five times
higher than that reached with 20 cm3 of anode volume (420 mW m-2). However, the maximum power density was 734 mW m-2, observed when 8 cm3 of anode volume was used in the MFC. It is interesting to observe that the slope of the polarization curve (Figure 2) decreased when the anode volume decreased from 20 to 4 cm3, and this observation can be explained in terms of the reduction in the ohmic loses due to the microbial community selection in higher shear force, as a consequence of the reduction of anode volume. The lowest slope corresponds to the experiment carried out in the cell operated at 0.375 cm2 cm-3.
Hence, results shown in this work demonstrate that
there is a clear influence of the ESAVR on the production
of electricity and COD consumption rate. This parameter has not been investigated previously to the knowledge of authors and, in the light of the present literature, it is not easy to compare values obtained in this work with values of the ESVAR used by other authors because there are many other factors that vary and hence no relevant conclusions can be drawn. However, using a ESAVR of 2.80 cm2/cm3 (Fan et al., 2007a, b; Liu et al., 2007) a power density as high as 18000 mW m-2 was obtained using acetate as substrate and a carbon cloth anode. Likewise, with a ESAVR of 1.67 cm2/cm3 (although in this case using ferricyanide as mediator in the catholyte) (Ringeisen et al., 2006) a power density of 4000 mW m-2 was obtained in a MFC fed with lactate. Results obtained by other authors
using ESAVR within the same range used in this work are comparable. Thus, with ESAVR close to 0.50 cm2/cm3, values of 150 mW m-2 and COD consumption of 250 mg COD L-1 d-1 were obtained using graphite fiber brushes as anode and feeding the MFC with synthetic wastewater (Kim et al., 2015a; Kim et al., 2015c)
CONCLUSIONS
From this work, it can be concluded that the ESAVR
exhibits a high influence on the performance of microbial
fuel cells and the choice of a suitable value can help to optimize the production of electricity in this type of energy
production device. This ESAVR parameter also affects the
COD consumption rate, but in an opposite trend. Feeding the MFC with actual winery wastewater, it was found that current intensities increased from 583 to 2416 mA m-2 when the ESAVR increased from 0.15 to 0.75 cm2 cm-3, while the COD consumption rate decreased from 1075 down to 591 mg COD L-1 d-1 within the same range. This means that the COD consumed by electrogenic microorganisms can vary within 1 and 8% of the total COD metabolized only by modifying the ESAVR.
ACKNOWLEDGEMENTS
Financial support from the Spanish Ministry of Economy and Competitiveness (MINECO) through project CTQ2013-49748-EXP (Explora Program) and from FAPESP (Fundação de Amparo à Pesquisa do Estado de São Paulo, Brazil) through the processes 2014/07904-5, 2011/23026-0 and 2009/15984-0 are gratefully acknowledged for supporting this research
REFERENCES
Biffinger, J.C., Pietron, J., Ray, R., Little, B., Ringeisen, B.R., A biofilm enhanced miniature microbial fuel cell using Shewanella
oneidensis DSP10 and oxygen reduction cathodes. Biosensors & Bioelectronics, 22, 1672-1679 (2007a).
Biffinger, J.C., Ray, R., Little, B., Ringeisen, B.R., Diversifying biological fuel cell designs by use of nanoporous filters.
Environmental Science & Technology, 41, 1444-1449 (2007b).
Biffinger, J.C., Ray, R., Little, B., Ringeisen, B.R., Miniature
microbial fuel cells incorporating nanoporous sterilization membranes. Abstracts of Papers of the American Chemical Society, 233, 370-370 (2007c).
Chae, J., Miniaturizing microbial fuel cell for a potential portable power source. Abstracts of Papers of the American Chemical Society, 243 (2012).
Chae, K.-J., Choi, M.-J., Lee, J.-W., Kim, K.-Y., Kim, I.S., Effect of different substrates on the performance, bacterial diversity,
and bacterial viability in microbial fuel cells. Bioresource Technology, 100, 3518-3525 (2009).
·
4.
COD electrogenic
COD COD
j A
r
F
ratio electrogenic
r
r
−
Chen, Y.-P., Zhao, Y., Qiu, K.-Q., Chu, J., Lu, R., Sun, M., Liu, X.-W., Sheng, G.-P., Yu, H.-Q., Chen, J., Li, W.-J., Liu, G., Tian, Y.-C., Xiong, Y., An innovative miniature microbial fuel cell fabricated using photolithography. Biosensors & Bioelectronics 26, 2841-2846 (2011).
Di Lorenzo, M., Thomson, A.R., Schneider, K., Cameron, P.J., Ieropoulos, I., A small-scale air-cathode microbial fuel cell for on-line monitoring of water quality. Biosensors & Bioelectronics, 62, 182-188 (2014).
Dumas, C., Basseguy, R., Bergel, A., Microbial electrocatalysis
with Geobacter sulfurreducens biofilm on stainless steel
cathodes. Electrochimica Acta, 53, 2494-2500 (2008). Erbay, C., Yang, G., de Figueiredo, P., Sadr, R., Yu, C., Han, A.,
Three-dimensional porous carbon nanotube sponges for high-performance anodes of microbial fuel cells. Journal of Power Sources, 298, 177-183 (2015).
Fan, Y., Hu, H., Liu, H., Enhanced Coulombic efficiency and
power density of air-cathode microbial fuel cells with an
improved cell configuration. Journal of Power Sources 171,
348-354 (2007a).
Fan, Y., Hu, H., Liu, H., Sustainable power generation in
microbial fuel cells using bicarbonate buffer and proton
transfer mechanisms. Environmental Science & Technology 41, 8,154-8158 (2007b).
Franks, A.E., Nevin, K.P., Microbial Fuel Cells, A Current Review. Energies, 3, 899-919 (2010).
Ge, B., Li, K., Fu, Z., Pu, L., Zhang, X., The addition of ortho-hexagon nano spinel Co3O4 to improve the performance of activated carbon air cathode microbial fuel cell. Bioresource Technology, 195, 180-187 (2015).
Hou, H., Li, L., Ceylan, C.U., Haynes, A., Cope, J., Wilkinson,
H.H., Erbay, C., de Figueiredo, P., Han, A., A microfluidic
microbial fuel cell array that supports long-term multiplexed analyses of electricigens. Lab on a Chip, 12, 4151-4159 (2012).
Kim, H., Kim, B., Kim, J., Yu, J., Effect of organic loading rates and influent sources on energy production in multi-baffled
single chamber microbial fuel cell. Desalination and Water Treatment, 56, 1217-1222 (2015a).
Kim, H., Kim, B., Yu, J., Power generation response to readily biodegradable COD in single-chamber microbial fuel cells. Bioresource Technology, 186, 136-140 (2015b).
Kim, K.-Y., Yang, W., Logan, B.E., Impact of electrode
configurations on retention time and domestic wastewater treatment efficiency using microbial fuel cells. Water
Research, 80, 41-46 (2015c).
Lepage, G., Albernaz, F.O., Perrier, G., Merlin, G., Characterization of a microbial fuel cell with reticulated carbon foam electrodes. Bioresource Technology, 124, 199-207 (2012).
Liu, H., Fan, Y., Hu, H., FUEL 130-Enhanced power generation of air cathode microbial fuel cells with cloth electrode assembly. Abstracts of Papers of the American Chemical Society, 234 (2007).
Logan, B.E., Scaling up microbial fuel cells and other bioelectrochemical systems. Applied Microbiology and Biotechnology, 85, 1665-1671 (2010).
Logan, B.E., Hamelers, B., Rozendal, R.A., Schrorder, U., Keller, J., Freguia, S., Aelterman, P., Verstraete, W., Rabaey,
K., Microbial fuel cells: Methodology and technology. Environmental Science & Technology, 40, 5181-5192 (2006). Mink, J.E., Hussain, M.M., Sustainable Design of High-Performance Microsized Microbial Fuel Cell with Carbon Nanotube Anode and Air Cathode. Acs Nano 7, 6921-6927 (2013).
Mink, J.E., Qaisi, R.M., Logan, B.E., Hussain, M.M., Energy harvesting from organic liquids in micro-sized microbial fuel cells. Npg Asia Materials, 6(3) e89 (2014).
Penteado, E.D., Fernandez-Marchante, C.M., Zaiat, M.,
Canizares, P., Gonzalez, E.R., Rodrigo, M.A., Influence
of sludge age on the performance of MFC treating winery wastewater. Chemosphere 151, 163-170 (2016).
Qian, F., Morse, D.E., Miniaturizing microbial fuel cells. Trends in Biotechnology 29, 62-69 (2011).
Rabaey, K., Verstraete, W., Microbial fuel cells: novel biotechnology for energy generation. Trends in Biotechnology 23, 291-298 (2005).
Ren, H., Lee, H.-S., Chae, J., Miniaturizing microbial fuel cells for potential portable power sources: promises and challenges.
Microfluidics and Nanofluidics 13, 353-381 (2012).
Ringeisen, B.R., Henderson, E., Wu, P.K., Pietron, J., Ray, R.,
Little, B., Biffinger, J.C., Jones-Meehan, J.M., High power
density from a miniature microbial fuel cell using Shewanella oneidensis DSP10. Environmental Science & Technology 40, 2629-2634 (2006).
Rodrigo, M.A., Canizares, P., Lobato, J., Paz, R., Saez, C., Linares, J.J., Production of electricity from the treatment of urban waste water using a microbial fuel cell. Journal of Power Sources 169, 198-204 (2007).
Sevda, S., Dominguez-Benetton, X., Graichen, F.H.M., Vanbroekhoven, K., De Wever, H., Sreekrishnan, T.R., Pant, D., Shift to continuous operation of an air-cathode microbial fuel cell long-running in fed-batch mode boosts power generation. International Journal of Green Energy 13, 71-79 (2016).
Siu, C.-P.-B., Chiao, M., A Microfabricated PDMS Microbial Fuel Cell. Journal of Microelectromechanical Systems 17, 1329-1341 (2008).
Tominaka, S., Ohta, S., Obata, H., Momma, T., Osaka, T., On-chip fuel cell: Micro direct methanol fuel cell of an air-breathing, membraneless, and monolithic design. Journal of the American Chemical Society 130(32), 10456-10457 (2008).
Winfield, J., Ieropoulos, I., Greenman, J., Investigating a
cascade of seven hydraulically connected microbial fuel cells. Bioresource Technology 110, 245-250 (2012). Yang, W., Wei, X., Fraiwan, A., Coogan, C.G., Lee, H., Choi,
S., Fast and sensitive water quality assessment: A mu L-scale microbial fuel cell-based biosensor integrated with an air-bubble trap and electrochemical sensing functionality. Sensors and Actuators B-Chemical 226, 191-195 (2016a).
Yang, Y., Ye, D., Liao, Q., Zhang, P., Zhu, X., Li, J., Fu, Q.,
Enhanced biofilm distribution and cell performance of microfluidic microbial fuel cells with multiple anolyte inlets.
Biosensors & bioelectronics 79, 406-410 (2016b).