Artigo
*e-mail: [email protected]
MEASURING THE LIGHT CRUDE OIL (LCO) CONTENT IN STANDARD BIODIESEL/LCO BLENDS BY THERMAL ANALYSIS
Luis Díaz-Ballotea,*, Norberto U. García-Cruzb, Emanuel Hernández-Nuñezb, Andrea Castillo-Atochec, Gerardo González-Garcíad and Geonel Rodriguez-Gattornoa
aDepartment of Applied Physics, Center for Research and Advanced Studies of the National Polytechnic Institute, A. P. 73 Cordemex, Mérida, Yucatán, 97310, México
bMarine Resource Department, Center for Research and Advanced Studies of the National Polytechnic Institute, A. P. 73 Cordemex, Mérida, Yucatán, 97310, México
cDepartment of Chemistry and Biochemistry, Technological Institute of Mérida, Mérida, Yucatán, 97118, México dDivision of Natural and Exact Sciences, University of Guanajuato, Noria Alta s/n, Guanajuato, Gto., 36050, México
Recebido em 08/03/2018; aceito em 16/07/2018; publicado na web em 31/07/2018
The goal of the present study was to determine the potential use of thermal analysis for the measurement of the light crude oil (LCO) content of standard biodiesel mixtures. Standard samples of biodiesel/LCO blends were prepared with different ratios of biodiesel; LCO: 1:0 (biodiesel only), 1:3, 1:1, 3:1, 0:1 (LCO only). Thermogravimetry (TG) and differential scanning calorimetry were used to determine the usefulness of thermal analysis for quantification of the LCO in the mixtures. Proton nuclear magnetic resonance (1H NMR) spectroscopy was also used to confirm the composition of the samples. It was found that thermogravimetric curves were
not appropriate for the LCO measurements. However, the DSC signal of wax crystallization exhibited a good linear (R2 = 0.99)
correlation with the LCO content in the blend. Furthermore, it was shown that aliphatic protons (-CH2-)n in biodiesel and light crude
oil can also be used to determine LCO in biodiesel/LCO blends.
Keywords: biodiesel; light crude oil; differential scanning calorimetry; nuclear magnetic resonance; thermal analysis.
INTRODUCTION
Biodiesel/crude oil blends have recently received increased attention for their promising application in environmental remediation. For example, some microorganisms have shown a synergistic effect with biodiesel that speeds up the biodegradation rate.1,2 Knowledge of the quantity of degraded crude oil by a direct or indirect method is necessary to estimate the extent of crude oil degradation and, therefore, is important for the development of effective strategies or methods that lead to a higher degradation rate of crude oil. Measuring the biodegradation of crude oil is usually carried out by collecting the CO2 released3 during the degradation process. The amount of CO2 liberated is used as an indicator of the quantity of substrate degraded by the microorganisms. The use of CO2 evolution as an indicator presents some drawbacks. Firstly, CO2 evolution is an indirect method4,5 and secondly, CO2 is a non-specific indicator of only one degraded substrate.6 In the case of biodiesel/LCO blends, a level of complexity is added because the new source of carbon may complicate the identification of the degradation process.
This complication can mislead conclusions and is the likely reason for contradictory results about the use of biodiesel to increase the degradation rate of fossil fuels.7,8
Gas chromatography has also been reported to be used as an analytical tool to study crude oil degradation.9,10 Although gas chromatography is a reliable analytical tool, it is time consuming, laborious and requires special chemical standards. Therefore, it is necessary to identify a reliable and novel methods to estimate the quantity of crude oil in biodiesel/LCO blends. To our knowledge, no other study has determined the crude oil content of biodiesel/ LCO blends by thermal analysis. The aim of the current investigation
was to evaluate the potential use of thermal analysis (TG and DSC) to determine the quantity of crude-light oil constituted by standard biodiesel blends. In addition, nuclear magnetic resonance (NMR), was used to confirm the thermal results. A potential application of this method could be the development of effective bioremediation methods of contaminated soils or sands with spill oil.
EXPERIMENTAL
Materials
Refined soybean oil was purchased from a local store to produce biodiesel in a 1-L reactor which was specially designed for biofuel research. Potassium hydroxide, methanol, and anhydrous magnesium sulfate were all reagent grade (Sigma-Aldrich). The biodiesel was prepared in accordance with our procedure, as previously described.11 In summary 100 g of soybean oil was mixed with 22 g of MeOH containing 1 g of KOH. The reaction mixture was kept at 600 rpm and room temperature (25 °C) for 60 min. The petroleum (LCO) used in this research was provided by PEMEX (Petróleos Mexicanos) from oil well POL, with API gravity of 35° and density between 0.87-0.83 g mL-1. The petroleum was kept in serological glass bottles of 60 mL at room temperature (26 °C) and sealed with a PTFE headspace septum and aluminum rings with the goal of minimizing the loss by evaporation of some compounds.
Preparing the biodiesel/LCO blends
Thermogravimetry (TG) and differential scanning calorimetry (DSC)
Differential scanning calorimetry (DSC) and thermogravimetry (TG) were performed using a calorimeter and a thermobalance from TA Instruments (New Castle) Discovery series. TG measurement conditions were: temperature range of 50–500 °C, heating rate 10 °C min-1, average mass of the sample 4.7 ± 0.1 mg, dry air flow 50 mL min-1. The DSC instrument was calibrated for heat flow using indium with a heat of fusion of 28.45 J g-1. In the DSC measurements the samples were equilibrated to 25 °C and were immediately cooled to -90 °C at a rate of 2.0 °C min-1, once the sample reached -90 °C, it remained at this temperature for 1 min and was then heated to 50 °C at a rate of 2.0 °C min-1. Measurements were conducted in triplicates.
Nuclear magnetic resonance (NMR)
The quantitative 1H NMR spectra were recorded at 25 °C on Varian/Agilent 600 NMR spectrometer at a frequency of 599.74 MHz with p/2 pulse of 10 µs and 10 s of recycle delay. The samples were diluted in CDCl3 containing tetramethylsilane, TMS (δ = 0.0) as a reference for chemical shift (ppm).
RESULTS AND DISCUSSIONS
Thermal methods
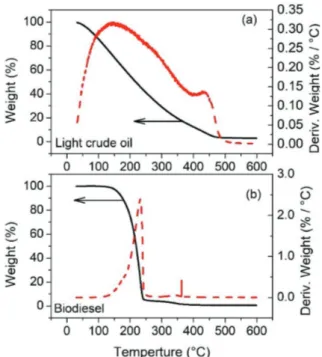
Figure 1 a-b shows thermogravimetric curves of neat biodiesel and light crude oil (LCO). Figure 1a shows the mass change (solid line) and the corresponding derivative of mass change with respect to temperature (dash line) of the LCO. From the DTG curve (dashed line) two regions were identified. The first region is located between 30 °C and 400 °C, in which, immediately following the beginning of the experiment, the weight of the LCO sample begins to decrease continuously until the sample reaches approximately 400 °C, at this point, around 93 wt.% of the sample was vaporized. The cause of this weight loss can be attributed to the combustion of hydrocarbons with low molecular weight which are the major components in the
LCO.12,13 A very small loss of mass was observed during the second increase in temperature to between 400 and 500 °C. This loss of mass was attributed to vaporization of hydrocarbons with medium molecular weight and residue. After 500 °C the residue (7 wt.%) likely composed of non-volatile hydrocarbons or coke, remains stable up to the end of the experiment.14
In Figure 1b, the TG curve indicates that biodiesel is stable up to approximately 150 °C, from this point the weight begins to decrease continuously until the sample is almost completely vaporized (96 wt.%) at approximately 240 °C. The residual weight is attributed to contaminants such as mono- di-, triglycerides or glycerol that are typically less than 3.5 wt.%, considering that the content of methyl esters should be at least 96.5 wt.%.15 An overlap of the thermogravimetric behavior between biodiesel and light crude oil is evident in Figure 1a-b. Therefore, it was concluded that thermogravimetric curves are not recommended for the quantification of light crude oil in biodiesel/LCO blends.
Differential scanning calorimetry (DSC) was also used as an attempt to quantify light crude oil in biodiesel/LCO blends. DSC measures heat flux differences between a sample and an inert reference. The DSC curves are obtained by plotting the difference in heat output versus temperature. Therefore, endothermic or exothermic processes during cooling/heating of the sample are detected. Figure 2 shows the DSC behavior of light crude oil and neat biodiesel. In both measurements, the experiment starts at 25 °C and then the sample is cooled to -90 °C, this temperature is maintained for one minute, and then, finally, heated back to 50 °C.
The DSC curve of LCO does not have many features in comparison with the DSC curve of biodiesel. However, there is a peak of crystallization near 14.2 °C, attributed to waxes that are indicated as heavy hydrocarbons (C20-C60) composed of linear n-alkanes16 which are commonly present in crude oils.17 The DSC curve of biodiesel shows crystallization peaks close to -7 °C and -61.0 °C that represent saturated and unsaturated methyl esters respectively.18 It is clear from Figure 2 that the wax appearance temperature (WAT) for LCO and the crystallization onset temperature of biodiesel are found at different temperatures. Therefore, the WAT for LCO is relatively easy to identify and can be a key feature for quantifying the amount of LCO in the biodiesel/ LCO blend. Figure 3 shows the typical cooling cycle for LCO, biodiesel and blends of both components. It can be seen in Figure 3 that the wax appearance temperature (14.2 ± 0.5 °C) of light crude
Figure 1. TG/DTG curves for a) light crude oil and b) neat biodiesel
Figure 2. DSC curves of biodiesel and light crude oil showing their cooling
oil does not suffer a significant change with the addition of biodiesel to the mixture, confirming the potential use of the crystallization heat to quantify the LCO in the blends. On the other hand, the peaks on the DSC curve for biodiesel evidently suffer dramatic changes as a function of the blend composition and are, therefore, not useful to the measurement of the LCO in the blends.
Figure 3 also shows a decrease in the peak corresponding to the exothermic heat flux due to the precipitation of waxes that belong to LCO. The wax content and the heat flux during wax crystallization follows a linear relationship.19,20 This finding suggests that measuring the wax content using DSC can be used as an indicator of the LCO content in the biodiesel/LCO blends. The heat flux released during crystallization is determined by integrating the corresponding peak. The average heat flux and standard error was plotted as a function of the LCO fraction in biodiesel/LCO blends. Figure 4 contains the resulting plot which shows a good linear correlation between the heat flux during the crystallization and the light crude oil fraction with a squared correlation coefficient (R2) of 0.99.
This result demonstrates that DSC can be used to determine the LCO content in biodiesel/LCO blends.
Nuclear magnetic resonance spectroscopy
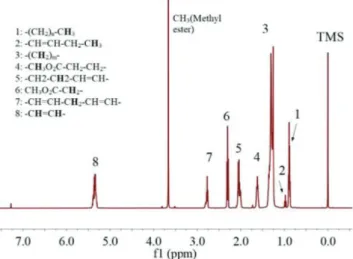
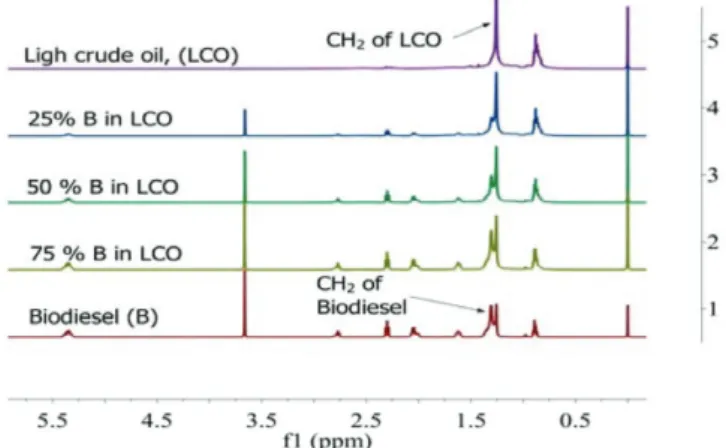
The light-crude oil content in mixtures of biodiesel containing light crude oil was also determined using nuclear magnetic resonance (NMR). Figure 5 shows typical spectrum of biodiesel and Figure 6 shows typical spectrum of LCO. In both cases, the spectra were in good agreement with the spectra observed in similar studies.20-22 The proton assignments were carried out based on the literature. Figure 5 shows that biodiesel has various protons which can be used to estimate the light crude oil content in the mixtures. However, it can be seen in Figure 6 that the major components of the LCO are the aliphatic protons (0.5 - 3.1 ppm). This suggests that a comparison between the aliphatic protons in biodiesel and light crude oil could give a good approximation of LCO in the mixtures. The suggestion is re-enforced by observing the behavior of the aliphatic region of the mixtures that can be observed in Figure 7. This Figure indicates that it is relatively easy to resolve the aliphatic peaks of biodiesel and LCO and use them to calculate the LCO in the mixture.
The peak height ratio between CH2 of Biodiesel and CH2 of LCO was calculated and plotted in Figure 8 as a function of the LCO fraction. An excellent linear behavior can be observed between both parameters in Figure 8 (R2=0.99).
Mixtures of known biodiesel LCO ratios were treated as samples of unknown composition and were analyzed by DSC and NMR. Subsequently, the actual values of crude oil fractions vs the predicted
Figure 3. Cooling DSC curve of LCO, biodiesel and blends of both components
Figure 5. 1H NMR spectrum of neat biodiesel
Figure 4. Enthalpy of wax crystallization as a function of light crude oil
fraction
values from DSC and NMR measurements were compared and can be observed in Figure 9. Clearly, DSC and NMR show a good correlation, suggesting that both techniques promise to be good analytical tools for LCO determination in biodiesel/LCO blends.
CONCLUSIONS
Biodiesel/Light-crude oil blends were prepared as standard samples to evaluate the potential usefulness of thermal analysis for
Figure 9. Actual values of light crude oil fractions vs estimated values obtained
from DSC and NMR measurements in biodiesel /LCO blends
Figure 8. Peak height ratio between CH2 of Biodiesel and CH2 of LCO as a
function of LCO fraction
Figure 7. 1H NMR spectra for different mixtures of biodiesel with light crude oil
quantification of light crude oil in the mixtures. Nuclear magnetic resonance was also used to support and confirm the results found by thermal analysis. A thermogravimetric curve, which overlapped between biodiesel and light crude oil, suggested that this measurement method is not appropriate for the quantification of light crude oil in the mixtures. However, results from differential scanning calorimetry were more promising because they exhibited a good linear correlation (R2 = 0.99) between the DSC signal of the wax crystallization and the LCO content in the biodiesel mixtures with LCO. Nuclear magnetic resonance was used to complement and confirm the results from thermal analysis. From the NMR results, it was found that the peak height ratio between aliphatic (CH2) compounds of biodiesel and LCO also follow a good linear (R2 = 0.98) behavior with the LCO fraction. Additionally, a good relationship was observed between NMR and DSC.
ACKNOWLEDGEMENTS
The authors thank the National Council of Science and Technology (CONACYT) of México for the financial support as well as the Cátedra-Conacyt Project 1568 (E. Hernández-Nuñes). Thermogravimetrics analysis were performed at the Laboratorio Nacional de Nano y Biomateriales (LANNBIO), under grants FOMIX-Yucatán 2008-108160 and CONACYT LAB-2009-01 No.123913. Special tanks to Dr. William S. Gonzalez-Gómez for his valuable help in the thermogravimetric measurements.
REFERENCES
1. Pasqualino, J. C.; Montane, D.; Salvado, J.; Biomass Bioenergy 2006, 30, 874.
2. Mudge, S. M.; Pereira, G.; Spill Sci. Technol. Bull. 1999, 5, 353. 3. Ng, Y. F.; Ge, L.; Chan, W. K.; Tan, S. N.; Yong, J. W. H.; Tan, T. T. Y.;
Fuel 2015, 139, 523.
4. Cerqueira, V. S.; Hollenbach, E. B.; Maboni, F.; Vainstein, M. H.; Camargo, F. A.; Maria do Carmo, R. P.; Bento, F. M.; Bioresour. Technol. 2011, 102, 11003.
5. Zhang, X.; Peterson, C.; Reece, D.; Haws, R.; Möller, G.; Trans. ASAE
1998, 41, 1423.
6. Kim, S.-J.; Choi, D. H.; Sim, D. S.; Oh, Y.-S.; Chemosphere 2005, 59, 845.
7. Lisiecki, P.; Chrzanowski, Ł.; Szulc, A.; Ławniczak, Ł.; Białas, W.; Dziadas, M.; Owsianiak, M.; Staniewski, J.; Cyplik, P.; Marecik, R.; Fuel 2014, 116, 321.
8. Mariano, A. P.; Tomasella, R. C.; De Oliveira, L. M.; Contiero, J.; De Angelis, D. d. F.; Afr. J. Biotechnol. 2008, 7, 1323.
9. Atlas, R.; Bartha, R.; Can. J. Microbiol. 1972, 18, 1851.
10. Medina-Moreno, S.; Huerta-Ochoa, S.; Gutiérrez-Rojas, M.; Can. J. Microbiol. 2005, 51, 231.
11. Vega-Lizama, T.; Díaz-Ballote, L.; Hernández-Mézquita, E.; May-Crespo, F.; Castro-Borges, P.; Castillo-Atoche, A.; González-García, G.; Maldonado, L.; Fuel 2015, 156, 158.
12. Kök, M. V.; Varfolomeev, M. A.; Nurgaliev, D. K.; J. Pet. Sci. Eng. 2017, 154, 537.
13. Kök, M. V.; Varfolomeev, M. A.; Nurgaliev, D. K.; J. Pet. Sci. Eng. 2018, 167, 480.
14. Yuan, C.-d.; Emelianov, D.; Varfolomeev, M. A.; Energy Fuels 2018, 32, 5571.
15. EN 14103: Fat and oil derivatives. Fatty acid methyl esters (FAME). Determination of ester and linolenic acid methyl ester contents, European Committee for Standardization, Brussels, 2003.
16. Coto, B.; Martos, C.; Espada, J. J.; Robustillo, M. D.; Peña, J. L.; Fuel
17. Alcazar-Vara, L. A.; Buenrostro-Gonzalez, E.; Fuel Process. Technol.
2011, 92, 2366.
18. Yadav, C.; Saini, A.; Bera, M.; Maji, P. K.; Fuel Process. Technol. 2017, 167, 395.
19. Chen, J.; Zhang, J.; Li, H.; Thermochim. Acta 2004, 410, 23.
20. Bagai, R.; Singh, N.; Kumar, R.; Chopra, A.; Mahendra, P.; Christopher, J.; Saxena, D. J. Pet. Sci. Eng. 2017, 35, 1595.
21. Monteiro, M.; Ambrozin, A.; Liao, L.; Ferreira, A.; Fuel 2009, 88, 691. 22. Sugiura, K.; Ishihara, M.; Shimauchi, T.; Harayama, S.; Environ. Sci.
Technol. 1996, 31, 45.