Effects of Ag Addition on Some Physical Properties of Granular
Y Ba
2Cu
3O
7−δSuperconductor
Paula de Azambuja, Pedro Rodrigues J´unior, Alcione Roberto Jurelo,∗ Francisco
Carlos Serbena, Carlos Eugˆenio Foerster, and Rosˆangela Menegotto Costa
Departamento de F´ısica, Universidade Estadual de Ponta Grossa, Av. Gen. Carlos Cavalcanti 4748, 84.030-000, Ponta Grossa, Paran´a, Brazil
Gelson Biscaia de Souza
Departamento de Ciˆencias, Universidade Estadual de Maring´a, av. Colombo, 5790, Maring´a, PR, CEP 87020-900, Brazil
Carlos Maurcio Lepienski
Departamento de F´ısica, Universidade Fedral do Paran´a, Centro Polit´ecnico, C.P. 19044, Curitiba, PR, CEP 81531-990, Brazil
Adilson Luiz Chinelatto
Departamento de Engenharia de Materiais, Universidade Estadual de Ponta Grossa, Av. Gen. Carlos Cavalcanti 4748, 84030-000, Ponta Grossa, Paran´a, Brazil
(Received on 21 April, 2008)
The effects of Ag addition on some physical properties ofY Ba2Cu3O7−δsuperconductor has been studied. The samples were produced by different routes and characterized by scanning electron microscopy, differen-tial thermal analysis, thermogravimetric analysis, X-ray diffraction and nanoindentation. The superconducting properties were studied bydcmagnetization and electrical resistivity measurements. The X-ray patterns revealed that all samples were polycrystalline and corresponded to the orthorhombicY Ba2Cu3O7−δphase. However, for
some samples, silver appears to be present within the grains. The superconducting properties were not signifi-cantly influenced by Ag addition. Hardness and elastic modulus were also obtained by instrumented indentation. Ag addition was found to be effective in improving the mechanical properties, probably by filling the pores in the grain boundaries. Hardness profiles indicated values between 3.1 and 3.4 GPa at deep tip penetration depths. The highest elastic modulus of 146 GPa was attained for samples prepared usingY2O3,BaCO3,CuOandAg2O
as precursors, while the lowest modulus (125 GPa) was obtained for the pureY Ba2Cu3O7−δsample.
Keywords: High-TCSuperconductor; Polycrystalline; YBCO; Ag Addition
1. INTRODUCTION
For most applications of high-temperature superconduc-tors (HTSC’s), it is desirable good superconducting and me-chanical properties. It has been reported that silver addi-tion is effective in improving mechanical properties of the brittle superconducting oxidesY Ba2Cu3O7−δ (Y-123) [1-3].
For example, studies on textured Ag doped Y-123 samples showed that the Ag addition improved fracture toughness and the resistance to thermal shock [4]. At mesoscopic level, sil-ver fills the intergranular spaces and increases plasticity and the resistance to crack formation [5].
It has been found that Ag enhances the critical current density and magnetic-flux trapping [6,7]. Also, silver im-proves the grain growth and helps to obtain a better grain orientation, lowering the electrical resistance in the normal-state [8,9]. In a general manner, silver addition to Y-123 clearly enhances the process dominated by the weak-links [10].
Silver can be introduced into the samples by various ways, such as by mixing with metallicAg, by mixing withAgO2 or by electrochemical methods [11,12]. Due to its excel-lent chemical compatibility, the silver ion can be encoun-tered into the Y-123 grains [7,13]. Yet, as copper and silver
∗Electronic address:[email protected]
are from the same group of the periodic table, Ag atoms can substitute Cu(1) in the Y-123 grains and consequently many physical properties are affected by presence of microscopic granularity [14]. However, some authors [15,16] also report thatCusites are not substituted by Ag ions and the excess of Ag fills the pores in the bulk.
Studies devoted to Ag addition in Y-123 samples have shown its numerous advantages. The aim of this study is to produce and characterize pellets of silver doped Y-123 by different routes. The samples were characterized by scanning electron microscopy, differential thermal analysis (DTA), thermogravimetric analysis (TGA), X-ray diffrac-tion, dc magnetization and electrical resistivity measure-ments. Also, the hardness and elastic modulus were mea-sured by instrumented indentation.
2. EXPERIMENTAL DETAILS
FIG. 1: SEM micrographs of a pure Y-123 (GA) and Ag-doped Y-123 samples (GB, GC and GD).
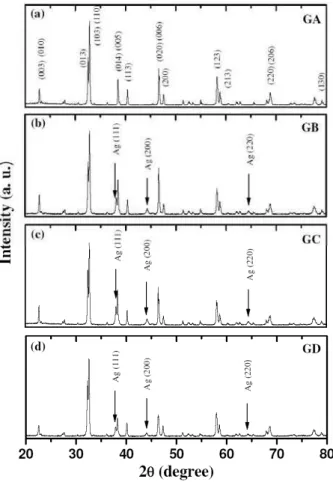
FIG. 2: Representative X-ray diffraction patterns for a pure Y-123 (GA) and for Ag-doped Y-123 samples (GB, GC and GD) prior to sintering.
420 0C for 24 hours. In group B(GB), a fully oxygenated 1:2:3 compound was first prepared by the usual solid-state reaction method described above. Samples of composition Y Ba2Cu3O7−δ/Ag, with Ag2O 20 wt. % were then
pre-pared fromAg2Oand 1:2:3 powders as described in Equa-tion (1). TheAg2Oand stoichimetricY−123 powders were well mixed, pressed into pellets and sintered at 9200Cfor 24 hours. Samples were heated in flowing oxygen at 4200Cfor 24 hours.
Y Ba2Cu3O7−δ+ (1)
+20wt%Ag2O→Y Ba2Cu3O7−δ/Ag(GB)
Samples in group C (GC) were prepared with the same chemical formula as in group A, but instead of using the prereacted 1:2:3, we usedY2O3,BaCO3,CuOandAg2Oas precursors as described in Equation (2) below.
1/2Y2O3+2BaCO3+3CuO+ (2) 20wt%Ag2O→Y Ba2Cu3O7−δ/Ag(GC)
In groupD(GD), samples of compositionY Ba2Cu3O7−δ/Ag
with pureAg(metallic) 20 wt % were prepared from Ag and the prereacted 1:2:3 powders as described by Equation (3). The Ag and stoichimetric Y-123 powders were well mixed, pressed into pellets and sintered at 9200Cfor 24 hours. Sam-ples were heated in flowing oxygen at 4200Cfor 24 hours.
Y Ba2Cu3O7−δ+ (3)
+20wt%Ag→Y Ba2Cu3O7−δ/Ag(GD)
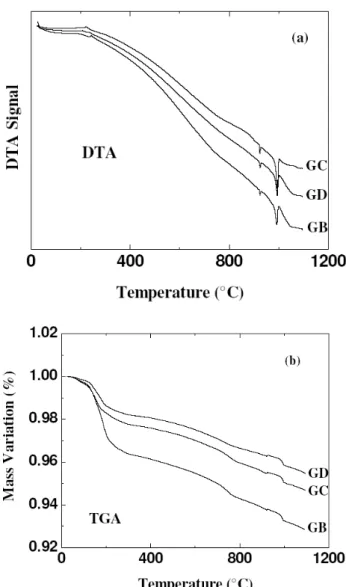
FIG. 3: (a) DTA and (b) TGA curves for Ag-doped Y-123 samples (GB,GCandGD).
3. RESULTS AND DISCUSSION
Samples polished with diamond paste finishing were ob-served by scanning electron microscopy. Fig. 1 shows the morphology for a pure Y-123 (sample GA) and for Ag-doped Y-123 samples (GB, GC andGD) polished with diamond past finishing. The granular nature and the porosity of the samples are clearly shown. For most Y-123 grains, their di-ameter was in range between 5 and 10µm. A random distri-bution of metallic Ag particles between 10 and 50µmin di-ameter was homogeneously dispersed within the Y-123 ma-trix for samplesGB,GCandGD. Many defects such as pores are created during the heating and the cooling steps. Also, this kind of defect can be introduced during oxygen anneal-ing. We can observe that the porosity forAg-doped samples has been significantly reduced, probably because the Ag par-ticles fill in the pores, and with a consequent increasing in the effective density of Ag-doped samples. This result is in ac-cordance with the porosity determined by the weight method using theoretical density (Table I). Also, for samplesGCand
FIG. 4: Temperature dependence of the electrical resistivity of pure Y-123 (GA) and Ag-doped Y-123 samples (GB,GCandGD). In the inset,dρ/dTversusTforGAsample is shown.
GD, we can observe the presence ofCuO, indicating proba-bly that the substitution of Cu by Ag is important for these samples.
TABLE I: Density for pure and Ag-doped Y-123 samples.
Sample
d
(g/cm
3)
GA
5.020 + 0.001
GB
6.007 + 0.009
GC
6.073 + 0.008
GD
5.907 + 0.001
The typical X-ray diffraction patterns for a pure Y-123 (GA) and for Ag-doped Y-Y-123 powders (GB, GC and GD) prior to sintering are shown in Fig. 2. The X-ray pat-terns revealed that all powders have the orthorhombic Y-123 phase. PowdersGB,GC andGDrevealed small quantities ofAg. The variation of lattice parametersa,b,c, cell vol-umeVand densityρfor different samples are shown in Ta-ble II. The variation of the unit cell parameters and density can indicate that Cu atoms may be substituted by Ag atoms, which is in agreement with other studies [20,21]. Also, forAg-doped Y-123 samples, we could identify three silver peaks, (111), (200) and (220) [14,22], which indicates the presence of Ag as a separated phase ofY−123. However, no peaks of theCuOphase were identified for powdersGCand GD, which indicates there is segregation of theCuOphase during sintering as seen in Fig. 1(c) and 1(d), probably by incorporation ofAginto the Y-123 grains.
FIG. 5: FC and ZFC magnetization curves as a function of temper-ature for all samples measured atH=10 G.
the other hand, with introduction ofAg, we can observe the presence of two endothermic peaks. The first peak (lower in-tensity) is due to melting of bulk Ag with temperature around 950 0C (for all doped samples) and the peak second tem-perature (higher intensity)is due to Y-123 melting, that was shifted towards lower temperatures: 9910CforGB, 9960C forGCand 9920CforGDsamples. As it was not observed others phases from DTA, the results indicated that Ag helps to lower the melting temperature of Y-123 without producing any other additional compound. Thermogravimetry ofAg -doped Y-123 samples (GB,GCandGD) in oxygen has been carried out and analyzed. As can be observed from Fig. 3(b), there is a small oxygen loss around 2000Cfor all samples, however for sampleGBthe mass variation is higher than for the others. Also, there is a difference of mass variation be-tween the samples. This can be attributed to the different oxygen concentration in the grain boundaries, possibly due to the use ofAg2Oas a precursor.
Fig. 4 shows the temperature dependence of the electrical resistivity for pure and Ag-doped Y-123 samples near the su-perconductive transition. The curves are normalized to unity at 95 K. The current wasI=10mAand the values ofρ(T)
are within the range of the reported values for the pure and Y-123/Agsamples. Also, both pure andAg-doped samples exhibit metallic behavior in the normal state (not shown). The transition width, ∆T, defined between 5 % and 95 % of the transition height, is approximately 2.6 K for sample GA, 1.5 K forGB, 1Kfor GCand 1.2K forGD. Yet, the zero-resistance temperature was 89.0Kfor sampleGA, 91.5 K forGB, 91.2KforGC and 91.4Kfor GD. In the inset, dρ/dT is shown as a function of temperature forGA sam-ple. The derivative of the resistivity is a simple procedure for magnifying details of the transition, as for example, the maximum ofdρ/dT, denoted by TP, and that corresponds approximately to the bulk critical temperatureTC [23]. For
our samples,TPis approximately 91.2 K for sampleGA, 92.7 K forGB, 91.8KforGCand 92.3KforGD, showing that the GB sample has the highest TP. From the plot of the derivative dρ/dT versus temperature, we can observe that there is an asymmetry indρ/dT in the temperature region belowTP for pure Y-123 sample, indicating that the transi-tion is a two-step process. This suggests that the pure sam-ple must have a strong disorder at mesoscopic level [24,25]. On the other hand, the same behavior was not observed for Ag-doped samples, indicating much better links between su-perconducting grains.
Fig. 5 exemplifies typical magnetization results as a func-tion of temperature with H= 10 G for pure Y-123 (GA) andAg-doped Y-123 samples (GB,GCandGD). The mea-surements were performed according to field-cooling (FC) and zero-field-cooling (ZFC) prescriptions. Meissner effect or field exclusion effect can be observed in the FC process if the sample quality is very good or defect-free. We can observe from Fig. 5 that the Meissner flux expulsion is ap-proximately the same for all samples. Also, it is noticeable that diamagnetic signal is very small in the FC process when compared with the ZFC. It is interesting to note thatTC is practically unaltered,∼92.2−93 K, for all samples, within our experimental resolution. Yet, the magnetic irreversibility temperatureTirr(the temperature corresponding to the point whereχFC−χZFCdeparts from zero) also did not change sig-nificantly between the Ag-doped samples, and also as when compared with the pure compound.
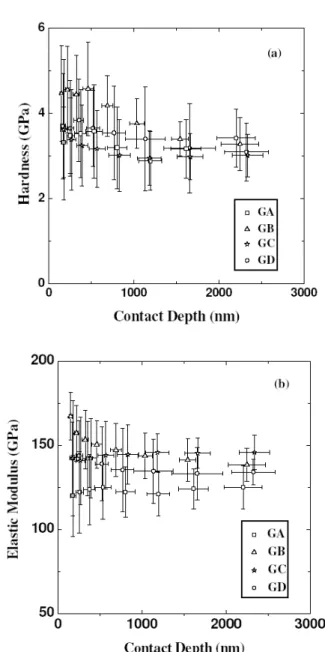
Typical SEM images (Fig. 1) showed the presence of su-perconductors grains (Y-123), pores and microcracks. For the Ag doped samples, Ag metallic grains are present in great quantity as an embedded phase. This mixture of Y-123 phase, Ag grains and pores makes difficult to precise evalu-ate hardness and elastic modulus of each phase because the material is a composite. To compensate this structural herent complexity and heterogeneity, a large ensemble of in-dentations was performed in order to obtain reliable hardness and elastic modulus profiles. Typical load-unloading curves for the undoped sample and Ag doped samples are shown in Fig. 6. The tip incursions observed at deeper penetrations can be attributed to pores and/or presence of Ag grains. In case of pores, the tip can lose sustentation and in case of Ag precipitates, a lower hardness is measured in comparison to the ceramic structure. These situations cannot be prevented during testing because both pores and Ag grains can be situ-ated under the near surface region and are not identified when defining where to indent. Moreover, at the highest applied loads, it cannot be excluded that chipping occurs as a result of lateral crack detachment during the indentation and this also means tip sustentation lost.
TABLE II: Lattice parametersa,b,c, unit cell volumeVand densityρfor pure and Ag-doped Y-123 samples.
Sample
a
(
Å)
b
(
Å)
c
(
Å)
V
(A
3)
ρ
(g/cm
3)
GA
3.81795
±
0.00008
3.88414
±
0.00009
11.6782
±
0.0002
173.181 +
0.009
6.388 +
0.001
GB
3.8167
±
0.0001
3.8832
±
0.0002
11.6802
±
0.0003
173.11 +
0.01
6.390 +
0.001
GC
3.81946
±
0.00008
3.88617
±
0.00009
11.6971
±
0.0001
173.620 +
0.006
6.372 +
0.001
GD
3.82020
±
0.00009
3.8845
±
0.0001
11.6889
±
0.0003
173.457 +
0.007
6.378 +
0.001
FIG. 6: Typical loading-unloading curves for pure and different Ag-doped Y-123 pellets at room temperature.
All of the hardness profiles have a great dispersion in its values that can be attributed to the fact that the samples are composites. The measured hardness in these cases corre-sponds to an averaged behavior between the superconductor ceramic, the metallic Ag grains and the presence of defects. Taking into account this composite character of ours sam-ples, the present hardness profiles are in agreement with re-ports in the literature for Y-123 based structures where hard-ness varies from 4 to 12 GPa [26-32]. Consequently, the broad range of the reported values can then be attributed to the different sample processing conditions and also to the employed measurement technique, which in almost of all reported situations corresponds to the conventional Vickers method. The elastic modulus profiles for the undoped and Ag doped samples are shown in Fig. 7(b). The undoped sam-ple has a value around 120 GPa from near surface to deeper regions (Table III). The Ag presence increases slightly the value from 140 to 150 GPa, but as also observed in the hard-ness profiles, the error bars are very large for all of the stud-ied samples. The measured values of the elastic modulus in the present situation agree with the reported data [26-32] and the same interpretation of composite behavior can be used to interpret these results.
FIG. 7: (a) Hardness and (b) elastic modulus as a function of contact depth for different Y-123 samples.
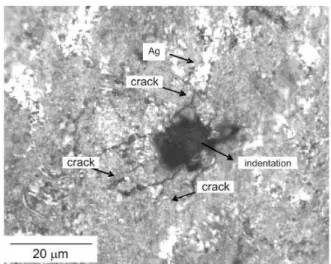
ob-FIG. 8: Optical micrograph of a cube-corner indentation in sample GC.
TABLE III: Hardness and elastic modulus at the deepest region for pure and Ag-doped Y-123 samples measured using a Berkovich
indenter.
Sample
H (GPa)
E (GPa)
GA
3.4
±
0.7
125
±
12
GB
3.3
±
0.6
139
±
10
GC
3.1
±
0.5
146
±
10
GD
3.1
±
0.7
135
±
8
served. This behavior is in agreement with the
polycrys-talline and composite nature of the samples. Radial and sec-ondary cracks can be indentified in the figure, but due to the presence of pores and metallic Ag precipitates, the ra-dial crack length and directions are not well defined and are very difficult to estimate. Therefore, it was not possible to measure the fracture toughness in these samples.
4. CONCLUSION
In the present study, the effects of the addition of Ag to the Y Ba2Cu3O7−δ system were investigated. Silver was added
to theY Ba2Cu3O7−δsystem through the mixture with
metal-lic Ag and withAg2O. Samples were produced by different routes and characterized by scanning electron microscopy, differential thermal analysis, thermogravimetric analysis and X-ray diffraction, whereas the superconducting properties bydcmagnetization and electrical resistivity measurements. Also, hardness and elastic modulus were measured by instrumented indentation. It was found that Cu sites are substituted by Ag ions, as well as that metallic Ag also fills the pores in the grain boundaries. The results obtained are in agreement with those reported in the literature and demonstrated that the addition of silver to theY Ba2Cu3O7−δ
system is effective in improving the mechanical properties without degradation of the superconducting properties.
Acknowledgements
This work was partially financed by the CNPq Brazilian Agency under contract n0474077/2007-1.
[1] N. Sakai, A. Mase, H. Ikuta, S-J Seo, U. Mizutani, and M. Murakami, Supercond. Sci. Technol. 13, 770 (2000). [2] C. Leblond-Harnois, R. Caillard, I. Monot-Laffez, G.
Des-gardin, and B. Raveau, Physica C341, 2439 (2000).
[3] G. Plesch, I. Van Driessche, A. Cigan, J. Manka, S. Hoste, and J. Kliment, Measurement Science Review1, 33 (2001). [4] P. Diko, G. Fuchs, and G. Krabbes, Physica C363, 60 (2001). [5] J. Joo, J. G. Kim, and W. Nah, Supercond. Sci. Technol.11,
645 (1998).
[6] O. Gorur, C. Terzoglu, A. Varilci, and M. Altunbas, Super-cond. Sci. Technol.18, 1233 (2005).
[7] E. Mendoza, T. Puig, A.E. Carrillo, J. Plain, and X. Obradors, Physica C334, 7 (2000).
[8] J. H. Miller, S. L. Holder, J. D. Hunn, and G. N. Holder, Appl. Phys. Lett.54, 2256 (1989).
[9] C. Harnois, Supercond. Sci. Technol.15, 864 (2002). [10] K. Salama, V. Selvamanickan, L. Gao, and K. Sun, Appl.
Phys. Lett.54, 2352 (1989).
[11] T. Petrisor, A. Giurgiu, and L. Ciontea, Appl. Supercond.1, 1219 (1993).
[12] B. Ropers, F. Carmona, and S. Flandroiss, Physica C204, 71 (1992).
[13] C. R. Taylor, and C. Greaves, Physica C235-240, 853 (1994). [14] Ch. Zang, A. Kulpa, and A. C. D. Chaklader, Physica C252,
67 (1995).
[15] H. Salamati, Ali A Babaci-Brojeny, and Medhi Safa, Super-cond. Sci. Technol.14, 816 (2001).
[16] Y. Nakamura, K. Tachiban, S. Kato, T. Ban, S. I. Yoo, and H. Fujimoto, Physica C294, 302 (1998).
[17] A.C. Larson, and R.B. Von Dreele, GSAS, Los Alamos Na-tional Laboratory (2004) Report LAUR 86-748.
[18] B. H. Toby, J. Appl. Cryst.34, 210 (2001).
[19] W. C. Oliver, and G. M. Pharr, J. of Mat. Res.7, 156 (1992). [20] A. K. Gangopadhyay, and T. O. Mason, Physica C178, 64
(1991).
[21] J. Joo, J. P. Singh, R. B. Poeppel, A. K. Gangopaddhyay, and T. O. Mason, J. Appl. Phys.71, 2351 (1992).
[22] S. Pinol, M. Najib, T. Puig, X. Obradors, H. Xuriguera, and M. Segarra, Physica C372-376, 738 (2002).
[23] A. R. Jurelo, I. Abrego Castillo, J. Roa-Rojas, L. M. Ferreira, L. Ghivelder, P. Pureur, and P. Rodrigues Jr., Physica C311, 133 (1999).
[24] A. R. Jurelo, J. V. Kunzler, J. Schaf, P. Pureur, and J. Rosen-blatt, Phys. Rev. B56, 14815 (1997).
[25] F. M. Barros, F. W. Fabris, P. Pureur, J. Schaf, V. N. Vieira, A. R. Jurelo, and M. P. Canto, Phys. Rev. B73, 94516 (2006). [26] R. R. Reddy, M. Murakami, S. Tanakam, and P. V. Reddy,
Physica C257, 137 (1996).
[27] T. Miyamato, K. Nagashima, N. Sakai, and M. Murakami, Su-percond. Sci. Technol.13, 816 (2000).
[28] Y. Yoshino, A. Iwabuchi, K. Noto, and M. Murakami, Physica C357-360, 796 (2001).
[30] F. Tancret, I. Monot, and F. Osterstock, Mater. Sci. and Eng. A298, 268 (2001).
[31] M. Matsui, N. Sakai, and M. Murakami, Supercond. Sci. Tech-nol.15, 1092 (2002).