ASSESSMENT
OF
N
MINERALIZATION
AND
N
LEACHING
IN
SOIL
USING
A
NEW
IN-SITU
INCUBATION
METHOD
Sousa J.R.
1, Cabral F.
2, Coutinho J.
11
Centro de Química, Dep. Biologia e Ambiente, Universidade de Trás-os-Montes e Alto Douro, ap. 1013,
5001-911, Vila Real, Portugal. E-mail: [email protected]
2
Unidade de Investigação Química Ambiental (UIQA), UTL, Instituto Superior de Agronomia,
1349-017, Lisboa, Portugal.
1
INTRODUCTION
Towards sustainable soil management, the application of organic residues to the soil has to be based on criteria sustained by experimental studies. Several methods for estimating the amount of N that mineralizes from land-applied organic residues can be used but laboratory incubations has been the main methodology used due to several advantages related to practical and economical aspects (Qafoku et al., 2001). However, this type of methodology is performed under controlled temperature and moisture content, at optimal conditions for the mineralization process, limiting the extrapolation of laboratory derived values to the field conditions (Hanselman et al., 2004). Since N mineralization process can be affected by the dynamic of these factors, several authors consider field incubations as a more realistic method to assess N mineralization (Subler et al., 1995; Halselman et al., 2004). Nevertheless, the quality of the results obtained depends on the type of reactor devices used for measuring N mineralization under these conditions. In fact, various reactors devices described in the specific literature, like buried bags (Eno, 1960) or covered cylinders (Raison et al., 1987), reveal some disadvantages or limitations in monitoring N mineralization in field conditions. More recently, refining reactor devices, by introducing exchange resins, promoted a more sensible indicator comparatively to other methods since temperature, moisture content and aeration inside the containerized soil are close to undisturbed soil (Halselman et al., 2004). Considering that resin-trap incubation is the most promising in-situ technology in measuring nitrogen net mineralization rates from organic soil amendments, the aim of the present study is to evaluate the quality of the results obtained by using a new in-situ incubation device for the determination of N mineralization kinetics in the soil as well as the potential of nitrogen leaching as a potential alternative use in field studies of N mineralization kinetics from organic residues applied to soils.
2
MATERIAL AND METHODS
In this study, a new reactor device with 1500 g of sieved soil (Ø 4 mm) and 10 g of exchange resins (AMBERLITE type, relative a mixture of cationic (H+) and anionic (OH-) resins, with a exchange ionic capacity superior to 0.6 mmol ml-1 and a size between 0.3 and 1.1 mm) (B.D.H., 1981), at the open end bottom was constructed and setup in a Mediterranean climate and non-cultivated field conditions during a 392 days period.
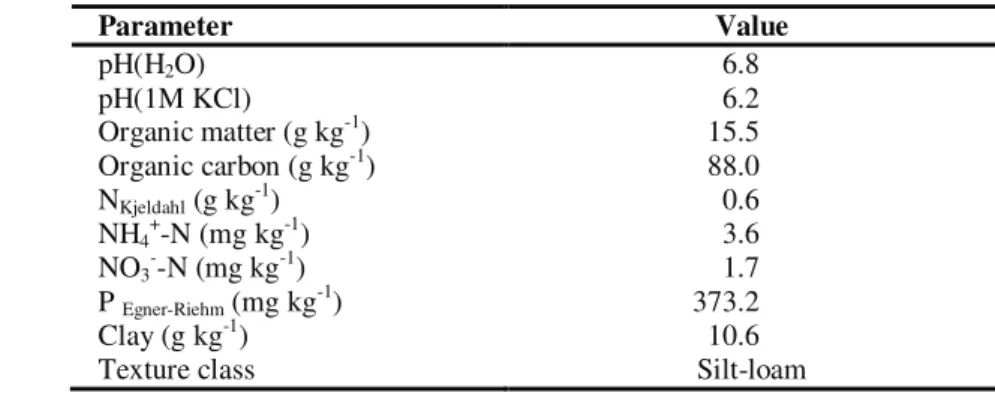
Table 1 shows some of the physical and chemical characteristics of the soil used in this study, a eutric Regosol (WRB, 2006).
TABLE 1 Some physical and chemical properties of soil used in the field incubation experiment.
Parameter Value pH(H2O) 6.8 pH(1M KCl) 6.2 Organic matter (g kg-1) 15.5 Organic carbon (g kg-1) 88.0 NKjeldahl (g kg-1) 0.6 NH4+-N (mg kg-1) 3.6 NO3--N (mg kg-1) 1.7 P Egner-Riehm (mg kg-1) 373.2 Clay (g kg-1) 10.6
Twenty four reactors were installed (day 0) and six sampling dates (28, 56, 84, 112, 224 and 392 days) were considered. At each date, 4 reactors were destructed and soil mineral N (NH4+ + NO3-) and mineral N adsorbed
on the exchange resins was extracted with a 2M KCl solution (Houba et al. 1995) and quantified using a segmented flow auto-analyser (SKALAR®), based in the Berthelot reaction and the sulphanilamide method, after reduction in a cadmium column. The N net mineralization was calculated as the cumulative sum of the net change in soil mineral N content during each time period plus the mineral N adsorbed in the exchange resins at the end of each period and the results expressed in mg of N per kg of soil. The calendar time was normalized for temperature and moisture content, using factors obtained by empirical mathematical models described by Recous (1997) and Paul et al. (2002), respectively. Considering the results obtained, the validation of this new reactor device in assessing N soil mineralization was performed by analyse of repeatability aspects, based on the calculation of the respective coefficient of variation (C.V.) value, and the degree of adjustment to the one pool exponential asymptotic model defined by Stanford & Smith (1970) (Nmin=N0*(1-exp(-k*time normalized))), expressed by the value of r2adjust..
Results from mineral N and N leaching in each time period were analysed by analysis of variance (one way-ANOVA). The statistical significance of the mean differences was determined by the TUKEY test at a 0.05 probability level.
3
RESULTS AND DISCUSSION
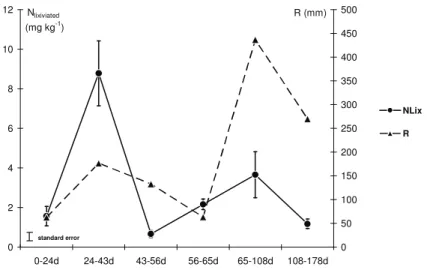
Figure 1 presents the values of mineral N adsorbed by the exchange resins (mg kg-1) at different time intervals during the incubation period, as an indicator of potential N leaching. The results showed significant differences (p<0.05) between the amounts of N leached at the different time intervals, with the most significant losses observed at the initial phase, between the 24 and 43 normalized days, where the values registered (8.8 mg N per kg soil) represent 48.8% of the total sum of N leached at the end of the incubation period (17.9 mg of N per kg of soil). These results are associated not only to the rainfall values registered in this phase of the incubation, the third high value observed during the incubation period (176.4 mm) but principally to the quantity of soluble inorganic forms of nitrogen present in the soil, which promote a higher nitrogen leaching as suggested by Berg & McClaugherty (2008). 0 2 4 6 8 10 12 0-24d 24-43d 43-56d 56-65d 65-108d 108-178d Nlixiviated (mg kg-1) 0 50 100 150 200 250 300 350 400 450 500 R (mm) NLix R standard error
FIGURE 1 Nitrogen leaching (NLix) (mg kg-1) and precipitation (R) values (mm) registered along the
incubation period (normalized days).
After this period, the variation of N leaching depended on the dynamic of N mineralization process. The lowest amount of N leached registered between 43 and 56 days (0.7 mg of N per kg of soil) was a consequence of the combined effect of the low soil temperature and the high precipitation values recorded which limited the microbial activity and, consequently, the quantities of N mineralized and leached. With the improvement of the environmental soil conditions, the microbial activity increased and a second maximum of N leached (3.7 mg N per kg of soil) was registered, coincident with a new peak of precipitation (436.6 mm). These results demonstrate the high sensibility of the reactor device to the environmental factors variation, like precipitation, with the high adsorptions of mineral N by the exchange resins coinciding with the periods of higher precipitation (figure 1).
Nevertheless, the quantities registered in this late phase, between 65 and 108 incubations days, were significantly smaller comparatively to the lowest N leached in the initial periods. The quality of the organic matter remaining in soil in this phase of the incubation period, after the expected initial flush of mineralisation (Cabrera, 1993), limited the quantities of inorganic N present in soil solution and the potential of N leaching, what is consistent with the results obtained by Berg & McClaugherty (2008), that observed a lower amount of N leached from materials with higher concentrations of recalcitrant compounds, like lignin or cellulose. At the end of the incubation period, taking into consideration the environmental conditions of the site under study, namely the total amount of precipitation registered (1141.6 mm), the total N leached from soil was 17.9 mg of N per kg of soil and year.
Considering the nitrogen content in soil during the incubation period (figure 2), the results obtained reveal an identical evolution trend as in the N leaching process (figure 1), with the highest and more significant amount of available nitrogen observed at the initial phase (24 days), registering values of 7.3 mg N kg-1. The presence of higher amounts of nitrogen inorganic forms and the faster mineralization of the more soluble compounds, related to the organic matter labile pool, contributed to higher nitrogen availability in the soil at the initial phase. Along the incubation period, particularly at 43 and 65 days, the significantly minor availability of N registered, with values varying in a range between 0.8 and 3.5 mg N kg-1, reflect the disappearance of the organic matter soluble fraction, responsible for the initial flush, but also the limitation effect imposed by a less favourable soil environmental conditions to N mineralization, that suppressed or limited microbial activity and, consequently, affected the kinetics of N mineralization process. On the other hand, the significantly increase observed on N mineral availability at the two final sampling dates reflects the improvement of soil environmental conditions for microbial activity; such as reduced soil moisture and high temperature values. Considering that the organic matter recalcitrant compounds are the main substrate for microbial activity in this phase of the incubation period, the results obtained are in accordance to the Mikan et al. (2002) observations that reported an increase in the mineralization kinetics of recalcitrant compounds with increasing temperature values. Nevertheless, the variations on environmental conditions don’t apparently affect the nitrification process. In all dates, the nitrate (NO3-) form represent the major fraction of
available nitrogen in soil as in the leaching process (data not show), corroborating the presuppose defended by many author’s, that in agricultural normal soil conditions the ammonium form (NH4+) is rapidly transformed (oxidise) in
nitrate form (NO3-) (Mengel, 1996).
0 1 2 3 4 5 6 7 8 9 0d 24d 43d 56d 65d 108d 178d Nmineral (mg kg-1) NO3 -NH4+ a a c c c d b
FIGURE 2 Mineral nitrogen content (NH4+-N + NO3--N) (mg kg-1) in soil along the incubation period
(normalized days).
Taking the sum of the two processes evaluated, i.e. N leaching at the end of each period and net change in mineral N soil content during each period, the N net mineralization in the soil under study was calculated and the cumulative results are presented in figure 3. The results reveal N mineralization cumulative values of 23.1 mg kg-1 year-1, where different kinetic phases of N mineralization were observed. One initial phase, with a more rapid N net mineralization in the first 55 incubation days, corresponding to 62.3% of the total of N mineralized at the end of the incubation period. Several authors associate this high initial values to the oxidation of easy available organic matter compounds present in soil and related to the organic matter labile pool (Berg & McClaugherty, 2008) but, also, to the effect of soil preparation treatment, namely the drying operation that promote a killer of soil biomass (Cabrera,
1993), that was mineralized by the microorganisms survivors, to the temperature biocide effect, and to the sieving operation that facilitates the accessibility of organic compounds protected by organic-clay aggregates, that are destroyed in this mechanical operation (Benbi & Ritcher, 2002).
With the disappearance of the labile fraction, a reduction of kinetic mineralization process was observed, that is described by the minor slope of the curve at the final stage of the incubation period. This behaviour made it easier the adjustment of the exponential model described by Stanford & Smith (1970), that explains more than 98% of the variation registered in the N mineralization process (figure 3). The potential of this exponential model used was registered in many soil incubations studies performed at laboratory or at field conditions, with many different types of soils, different agricultural systems, where the results obtained, with the same or high magnitude, reveal their universality (Sanford & Smith, 1970; Sousa et al., 2002).
Considering the parameters related by dynamic aspects of the N mineralization obtained by estimated model, the results reveal a kinetic constant (k) value of 0.015 day-1 for the soil under study. Taking the last value, the life-time (t1/2 time=0.693/k) for N mineralization was calculated and a value of 46.2 normalised days was obtained.
This value was lower than the results obtained in others independent incubations experiments, carried out with different soils and environmental conditions (Lagoa, 2004). These differences may be explained by discrepancies existent between the various experiments environmental conditions or related with the quality of organic matter associated with each soil type.
In order to the other validation aspect, the precision, the results reveal an acceptable repeatability results, with coefficient of variation (C.V.) values of 3.9%. These results were considered acceptable taking into consideration the conditions where the incubation was performed. For different field conditions and with other reactor device, without incorporation of exchange resins, Halseman et al. (2006) registered C.V. superiors in factor of 100. The results obtained with this reactor device were the same magnitude that are observed in more controlled experiment, conducted in laboratory conditions (Qian & Schoenau, 2005), where the factors associated with repeatability results are more controlled.
0 5 10 15 20 25 0 20 40 60 80 100 120 140 160 180 200 normalized days Nmineralized (mg kg-1) Ÿ N-NH4+ Ƒ N-NO3 -Ɣ N-min
Nmin = 25,32*(1-exp(-0,015*normalized time))
r2ajust. = 0,985 ***
FIGURE 3 Net N mineralization (mg kg-1) during the incubation period (normalized days).
4
CONCLUSIONS
Considering the high quality of adjustment obtained by the empirical model used, reveal by a high and significant value of r2adjust. (0,985***), and the high repeatability results, with low C.V. values (3.9%), it may be concluded that
the use of this type of reactor used in N mineralization of soil must be considered as a reliable alternative in field studies of N mineralization kinetics with or without organic residues applied to soils.
REFERENCES
BDH 1981. Ion exchange resins. Poole BH 124NN. England.
Benbi DK., Richter J 2002. A critical review of some approaches to modelling nitrogen mineralization. Biol. Fertil. Soils 35: 168-183.
Berg B, McClaugherty C 2008. Plant litter: Decomposition, Humus formation, Carbon Sequestration. Springer-Verlag, Berlin.
Cabrera ML 1993. Modelling the flush of nitrogen mineralization caused by drying out and rewetting soils. Soil Sci. Soc. Am. J. 57: 63-66.
Eno CF 1960. Nitrate production in the field by incubating the soil in polyethylene bags. Soil Sci. Soc. Am. Proc. 24: 277-279.
Hanselman TA, Graetz DA, Obreza TA 2004. A comparison of in situ methods for measuring net nitrogen mineralization rates of organic soil amendments. J. Environ. Qual. 33: 1098-1105.
Houba VG, Novozamsky I, Tenminghoff E 1995. Soil Analysis Procedures. Department of soil science and plant nutrition, Wageningen Agricultural University, The Netherlands.
Lagoa RAR 2004. Efeito do acondicionamento e preparação dos correctivos orgânicos e do tipo de incubação aeróbia na mineralização do azoto no solo. Relatório final de estágio, UTAD, Vila Real, 60 pp.
Mengel K 1996. Turnover of organic nitrogen in soils and its availability to crops. Plant Soil 181: 83-93.
Mikan CJ, Schimel JP, Doyle AP 2002. Temperature controls of microbial respiration in artic tundra soils above and bellow freezing. Soil Biol. Biochem. 37: 1411-1418.
Paul KI, Polgase PJ, O’Connell AM, Carlyle JC, Smethurst PJ, Khanna PK 2002. Soil nitrogen availability predictor (SNAP): a simple model for predicting mineralization of nitrogen in forest soils. Aust. J. Soil Res. 40: 1011-1026.
Qafoku OS, Cabrera ML, Windham WR, Hill NS 2001. Rapid methods to determine potentially mineralizable nitrogen in broiler litter. J. Environ. Qual. 30: 217-221.
Qian P, Schoenau JJ 2005. Use of Ion-Exchange Membrane to Assess Nitrogen-Supply Power of Soils. Journal Pant Nutrition 28: 2193-2200.
Raison RJ, Connell MJ, Khanna PK 1987. Methodology for studying fluxes of soil mineral-N in situ. Soil Biol. Biochem. 19: 521-530.
Recous S 1997. Calcul d’un temps normalise prenant en compte les variations de temperature et humidite. Note interne. INRA.
Sousa JR, Cabral F, Coutinho J 2002. Parâmetros bioquímicos no estudo da mineralização de correctivos orgânicos aplicados ao solo. IX Simpósio Ibérico sobre Nutrição Mineral das Plantas. Zaragoza, Espanha.
Stanford G, Smith SJ 1972. Nitrogen mineralization potentials in soils. Soil Sci. Soc. Am. J. 36: 465-472.
Subler S, Blair JM, Edwards CA 1995. Using anion-exchange membranes to measure soil nitrate availability and net nitrification. Soil Biol. Biochem. 27: 911-917.