BGD
12, 1453–1474, 2015Temperature sensitivity of SOC
mineralization
Y. Zhang et al.
Title Page
Abstract Introduction
Conclusions References
Tables Figures
◭ ◮
◭ ◮
Back Close
Full Screen / Esc
Printer-friendly Version Interactive Discussion
Discussion
P
a
per
|
Discussion
P
a
per
|
Discussion
P
a
per
|
Discussion
P
a
per
|
Biogeosciences Discuss., 12, 1453–1474, 2015 www.biogeosciences-discuss.net/12/1453/2015/ doi:10.5194/bgd-12-1453-2015
© Author(s) 2015. CC Attribution 3.0 License.
This discussion paper is/has been under review for the journal Biogeosciences (BG). Please refer to the corresponding final paper in BG if available.
Soil moisture influenced the interannual
variation in temperature sensitivity of soil
organic carbon mineralization in the
Loess Plateau
Y. Zhang1, S. Guo1,2,3, M. Zhao3, L. Du1, R. Li1, J. Jiang2, R. Wang3, and N. Li1
1
State Key Laboratory of Soil Erosion and Dry-land Farming on the Loess Plateau, Institute of Soil and Water Conservation, Northwest A&F University, Yangling 712100, China
2
Institute of Soil and Water Conservation, Chinese Academy of Sciences and Ministry of Water Resource, Yangling 712100, China
3
College of Resources and Environment, Northwest A&F University, Yangling 712100, China Received: 29 October 2014 – Accepted: 30 December 2014 – Published: 22 January 2015 Correspondence to: S. Guo ([email protected])
BGD
12, 1453–1474, 2015Temperature sensitivity of SOC
mineralization
Y. Zhang et al.
Title Page
Abstract Introduction
Conclusions References
Tables Figures
◭ ◮
◭ ◮
Back Close
Full Screen / Esc
Printer-friendly Version Interactive Discussion
Discussion
P
a
per
|
Discussion
P
a
per
|
Discussion
P
a
per
|
Discussion
P
a
per
|
Abstract
Temperature sensitivity of SOC mineralization (Q10) determines how strong the feed-back from global warming may be on the atmospheric CO2concentration, thus under-standing the factors influencing the interannual variation inQ10 is important to
accu-rately estimate the local soil carbon cycle. In situ SOC mineralization was measured 5
using an automated CO2flux system (Li-8100) in long-term bare fallow soil in the Loess Plateau (35◦12′N, 107◦40′E) in Changwu, Shaanxi, China form 2008 to 2013. The
results showed that the annual cumulative SOC mineralization ranged from 226 to 298 g C m−2y−1(mean=253 g C m−2y−1; CV=13 %), annualQ10 ranged from 1.48 to 1.94 (mean=1.70; CV=10 %), and annual soil moisture content ranged from 38.6 to 10
50.7 % WFPS (mean=43.8 % WFPS; CV=11 %), which were mainly affected by the
frequency and distribution of precipitation. Annual Q10 showed a negative quadratic correlation with soil moisture. In conclusion, understanding of the relationships be-tween interannual variation inQ10 of SOC mineralization, soil moisture and precipita-tion is important to accurately estimate the local carbon cycle, especially under the 15
changing climate.
1 Introduction
Temperature sensitivity of soil organic carbon (SOC) mineralization (Q10) is of critical importance because it determines how strong the feedback from global warming may
be on the atmospheric CO2 concentration (Ågren and Wetterstedt, 2007). However,
20
this is an issue of considerable debatable (Davidson et al., 2006; Kirschbaum, 2006), becauseQ10is not constant and variations inQ10are the main source of controversies
in this feedback intensity (Larionova et al., 2007; Karhu et al., 2010; Conant et al., 2011; Sakurai et al., 2012). Therefore, understanding the factors influencing Q10 of SOC mineralization is important to accurately estimate C cycle and the feedback from 25
BGD
12, 1453–1474, 2015Temperature sensitivity of SOC
mineralization
Y. Zhang et al.
Title Page
Abstract Introduction
Conclusions References
Tables Figures
◭ ◮
◭ ◮
Back Close
Full Screen / Esc
Printer-friendly Version Interactive Discussion
Discussion
P
a
per
|
Discussion
P
a
per
|
Discussion
P
a
per
|
Discussion
P
a
per
|
Previous studies have shown thatQ10 variations are closely related to soil tempera-ture (Janssens and Pilegaard, 2003; Zheng et al., 2009; Bond-Lamberty and Thomson, 2010), substrate availability (Davidson et al., 2006; Zheng et al., 2009), substrate qual-ity (von Lutzow and Kogel-Knabner, 2009; Luan and Liu, 2012), and the composition and size of the constituent microbial population (Djukic et al., 2010; Karhu et al., 2010; 5
Vanhala et al., 2011). Soil moisture is the most significant limiting factor for under-ground physiological processes in dry and semi-dry ecosystems (Balogh et al., 2011; Cable et al., 2011; Wang et al., 2014). Soil water availability may indirectly affectQ10by influencing the diffusion of substrates, because the diffusion of extracellular enzymes produced by microorganisms and available substrates must conduct in the liquid phase 10
(Davidson et al., 1998; Illeris et al., 2004), but the response of Q10 to soil water avail-ability is extremely complex and controversial (Davidson et al., 2000, 2006; McCulley et al., 2007). For example, Gulledge and Schimel (2000) found that Q10 was larger in wet years than in drought years, whereas the opposite result was found by Dorr and Mdnich (1987), and many other studies that mainly focused on the short-term or sea-15
sonal variation in Q10(Davidson et al., 2006) have showed that Q10was not affected by soil moisture (Fang and Moncrieff, 2001; Reichstein et al., 2002; Jassal et al., 2008). Additionally, soil water availability experienced marked seasonal and interannual fluctu-ations in these ecosystems due to uneven rainfall distribution caused by the abnormal increase of atmospheric CO2concentrations (Solomon et al., 2007). The uneven rain-20
fall distribution inevitably influenced soil moisture availability (Coronato and Bertiller, 1996; Qiu et al., 2001; Cho and Choi, 2014). Xiao et al. (2014) have shown that the interannual changes in soil moisture storage in the Loess Plateau were decided by the difference in soil moisture storage between October and April, because precipi-tation from April to October of 2004 to 2010 accounted for at least 86 % of annual 25
rainfall. However, to our knowledge, there are few studies investigating the relationship between interannual variation inQ10 for SOC mineralization and soil moisture under
BGD
12, 1453–1474, 2015Temperature sensitivity of SOC
mineralization
Y. Zhang et al.
Title Page
Abstract Introduction
Conclusions References
Tables Figures
◭ ◮
◭ ◮
Back Close
Full Screen / Esc
Printer-friendly Version Interactive Discussion
Discussion
P
a
per
|
Discussion
P
a
per
|
Discussion
P
a
per
|
Discussion
P
a
per
|
The Loess Plateau is located in northwest China covering an area of 640 000 km2. It has a continental monsoonal climate. The mean annual rainfall for a 30 year period (1984–2013) is 560 mm, with the highest rainfall of 954 mm in 2008 and the lowest rainfall of only 296 mm in 1995. The rainfall from July to September accounts for an average of 57 % of yearly rainfall (Guo et al., 2012). Several recent studies have at-5
tempted to determine the dominant factors responsible for the variation of soil respira-tion in agricultural ecosystems (Lafond et al., 2011; Shi et al., 2011; Jurasinski et al., 2012). However, there have been no studies on the interannual variation inQ10, nor the factors responsible for these changes. This highlights the need to accurately evaluate the response of SOM mineralization to increasing temperature under warmer climate 10
scenarios in the eroded or degraded regions, because air temperature has been in-creasing over the past decades (Fan and Wang, 2011; Wang et al., 2012). Thus, the objectives of the present study are to (1) quantify the interannual variation inQ10 of SOC mineralization; (2) determine the effect of soil moisture on the this interannual variation; and (3) analyze the relationships among precipitation, soil moisture, andQ10
15
for the period 2008–2013 in the Loess Plateau, China.
2 Materials and methods 2.1 Site description
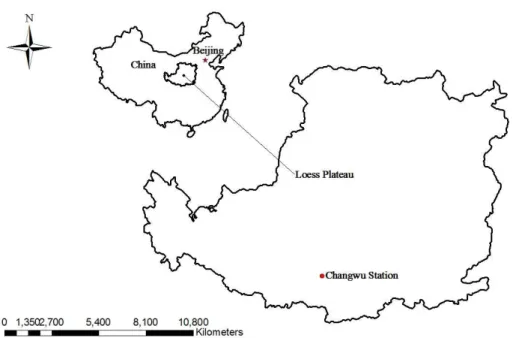
This study was a part of a long-term field experiment that began in 1984 in the State Key Agro-Ecological Experimental Station in the Loess Plateau in Changwu, Shaanxi, 20
China (35◦12′N, 107◦40′E; 1200 m a.s.l.) (Fig. 1). This region had a continental
mon-soon climate with a mean annual precipitation of 560 mm for the period 1984–2013, over 60 % of which occurred from July to September. During this 30 year period, the
annual mean air temperature was 9.4◦C and the monthly mean temperature between
BGD
12, 1453–1474, 2015Temperature sensitivity of SOC
mineralization
Y. Zhang et al.
Title Page
Abstract Introduction
Conclusions References
Tables Figures
◭ ◮
◭ ◮
Back Close
Full Screen / Esc
Printer-friendly Version Interactive Discussion
Discussion
P
a
per
|
Discussion
P
a
per
|
Discussion
P
a
per
|
Discussion
P
a
per
|
cumulated temperature of 3029◦C, annual sunshine duration of 2230 h, annual total
radiation of 484 kJ cm−2, and a frost-free period of 171 days.
The site was located in a typical rain-fed cropping region of the Loess Plateau high-land in northwest China. The soil was classified as a loam (Cumulic Haplustoll, USDA Soil Taxonomy System) developed from loess deposits. Soils collected at the study site 5
in 1984 at a depth of 0–20 cm contained 10.5 % CaCO3, 6.5 g organic C kg−1, 0.80 g total N kg−1, and 200 mg NH
4OAc-extractable K kg− 1
, and had a pH of 8.4 (with a 1 : 1 ratio of soil: H2O), a water-holding capacity of 0.29 cm3cm−3(v/v), the wilting point of
11 %, a soil bulk density of 1.3 g cm−3, and a clay content of 24 %.
2.2 Experimental design and management
10
The purpose of this long-term experiment was to investigate the effects of different crop rotations and fertilizers on soil productivity, nutrient contents, and moisture contents in the semi-arid Loess Plateau. A total of 36 treatments were used in the experiment, including bare fallow, continuous monoculture or rotation of wheat, legume and maize with various fertilizer rates. However in this paper, we have used three bare fallow plots 15
to study the mechanism of underground SOC mineralization rates. Each plot had a total area of 66.95 m2(10.3 m×6.5 m), with a 0.5 m spacing between plots.
2.3 Measurements of SOC mineralization rate and soil microclimate
SOC mineralization rate was measured using an automated closed soil CO2 flux sys-tem with a portable chamber (20 cm in diameter, Li-8100, Lincoln, NE, USA). Approx-20
imately one day before the first measurement, a polyvinyl chloride collar (20 cm in diameter and 12 cm in height) was inserted to a depth of 2 cm into each plot, and left in place throughout the experimental period from 2008 to 2013. All visible living or-ganisms were removed before the measurement. If necessary, one or more additional measurements would be taken until the variations between two consecutive measure-25
BGD
12, 1453–1474, 2015Temperature sensitivity of SOC
mineralization
Y. Zhang et al.
Title Page
Abstract Introduction
Conclusions References
Tables Figures
◭ ◮
◭ ◮
Back Close
Full Screen / Esc
Printer-friendly Version Interactive Discussion
Discussion
P
a
per
|
Discussion
P
a
per
|
Discussion
P
a
per
|
Discussion
P
a
per
|
was the average of the two measurements with a 90 s enclosure period and 30 s delay between them. Field measurements were performed between 09.00 and 11.00 a.m. from March 2008 to November 2013, except in December, January, and February be-cause of cold weather. A total of 17, 25, 26, 22, 26 and 17 SOC mineralization mea-surements were made in 2008–2013, respectively.
5
Soil temperatures and water contents at a 5 cm depth were measured at a distance of 10 cm from the chamber collar at the same time as the SOC mineralization rates using a Li-Cor thermocouple probe and a Theta Probe ML2X with a HH2 water content meter (Delta-T Devices, Cambridge, England), respectively. Soil water-filled pore space (WFPS) was calculated as follows: WFPS (%)=[volumetric water content/100×(2.65−
10
soil bulk density)/2.65].
2.4 Data analysis
An exponential (or “Q10”) function was used to simulate the relationship between SOC
mineralization rate and soil temperature (Xu and Qi, 2001):
F =β0eβ1T (1)
15
Q10=e10β1 (2)
whereF (mol m2s−1) is the SOC mineralization rate, T (◦C) is the soil temperature at
a depth of 5 cm, andβ0andβ1are the fitted parameters.
A quadratic polynomial function was used to simulate the relationship between SOC mineralization rate and soil moisture content (Tang et al., 2005):
20
F =β3θ2+β2θ+β4 (3)
whereθ is the soil moisture at a depth of 0–5 cm, and β2, β3, and β4 are the fitted parameters.
BGD
12, 1453–1474, 2015Temperature sensitivity of SOC
mineralization
Y. Zhang et al.
Title Page
Abstract Introduction
Conclusions References
Tables Figures
◭ ◮
◭ ◮
Back Close
Full Screen / Esc
Printer-friendly Version Interactive Discussion
Discussion
P
a
per
|
Discussion
P
a
per
|
Discussion
P
a
per
|
Discussion
P
a
per
|
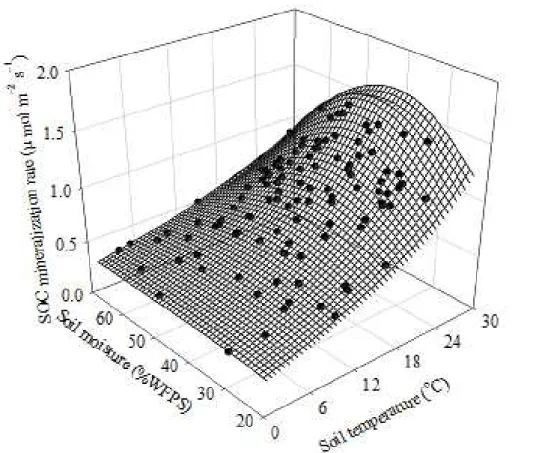
Our data indicated that SOC mineralization rate increased with increasing soil mois-ture content to a maximum at approximately 46 % WFPS, and then decreased with further increase of soil moisture content. After comparing different functions and result-ing residual plots, a bivariate model was used to simulate the effect of soil moisture content and temperature on SOC mineralization rate:
5
F =β0eβ1T θ+β2T θ2 (4)
The annual cumulative SOC mineralization rate was estimated by linear interpolating between measurement dates to obtain the mean daily SOC mineralization rate for each plot, and then summing the mean daily SOC mineralization rate for a given year.
The relationships between Q10 and meteorological factors were investigated using 10
the SAS software (version 8.0; SAS Institute, Cary, NC). All other statistical analyses
were performed with ANOVA atP =0.05.
3 Results
3.1 Interannual variation in Q0
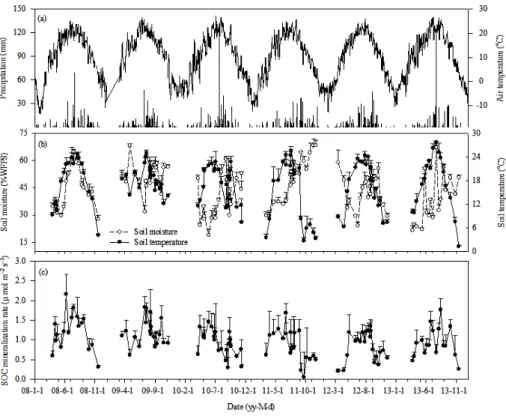
The temporal variation in the SOC mineralization rate was correlated with that of the 15
soil temperature in all six years (Fig. 2b and c), and it increased exponentially with soil temperature (P <0.01). The annualQ10 in our sites was 1.65 in 2008, 1.94 in 2009, 1.72 in 2010, 1.48 in 2011, 1.86 in 2012, and 1.55 in 2013, respectively, with a mean
Q10 of 1.72 and a CV of 10 % (Table 2); the mean annual SOC mineralization rate
ranged from 0.83 (2012) to 1.22 mol m−2s−1 (2008), with a mean of 0.99 mol m−2s−1
20
BGD
12, 1453–1474, 2015Temperature sensitivity of SOC
mineralization
Y. Zhang et al.
Title Page
Abstract Introduction
Conclusions References
Tables Figures
◭ ◮
◭ ◮
Back Close
Full Screen / Esc
Printer-friendly Version Interactive Discussion
Discussion
P
a
per
|
Discussion
P
a
per
|
Discussion
P
a
per
|
Discussion
P
a
per
|
3.2 Interannual variation in soil microclimate
Soil temperature and soil moisture at a depth of 0–5 cm showed significant temporal variations over the six-year observation period (Fig. 2b). The seasonal mean soil mois-ture content was 38.6 % WFPS in the dry season and 49.2 % WFPS in the wet sea-son. The mean annual soil moisture content ranged from 38.6 (2013) to 50.7 % WFPS 5
(2011), with a mean of 43.8 % WFPS and a CV of 11 %. The seasonal mean soil tem-perature was 14.50◦C in the dry season and 20.39◦C in the wet season. The mean
annual soil temperature ranged from 14.90 (2011) to 18.42◦C (2009), with a mean of
17.05◦C and a CV of only 7 %.
3.3 Effect of soil moisture on the interannual variation of Q10 10
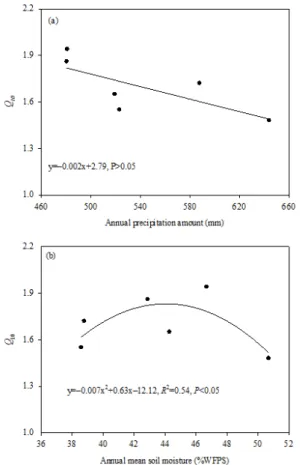
AnnualQ10 showed a negative quadratic correlation with annual mean soil moisture
(Fig. 3b). Additionally, the seasonal SOC mineralization rate increased exponentially with soil temperature, and showed a negative quadratic correlation with soil moisture content (Table 2). The response surface of SOC mineralization rate to soil temperature and moisture including both seasonal and interannual scales clearly described how soil 15
microclimate influenced SOC mineralization rate (Fig. 4).
4 Discussion
The range of annual Q10 (1.48–1.94, with a CV of 10 %) in our sites for the period 2008–2013 was within the range of the global meanQ10 for different ecosystems (1.3– 3.3) (Raich and Schlesinger, 1992). However, the mean annualQ10 in our sites (1.70)
20
BGD
12, 1453–1474, 2015Temperature sensitivity of SOC
mineralization
Y. Zhang et al.
Title Page
Abstract Introduction
Conclusions References
Tables Figures
◭ ◮
◭ ◮
Back Close
Full Screen / Esc
Printer-friendly Version Interactive Discussion
Discussion
P
a
per
|
Discussion
P
a
per
|
Discussion
P
a
per
|
Discussion
P
a
per
|
The annual Q10 was negatively linearly correlated with annual mean precipitation, but this correlation did not reach statistical significance (P >0.05); whereas it was sig-nificantly related to soil moisture content (Fig. 3). This was in agreement with pre-vious studies (Suseela et al., 2012; Poll et al., 2013). However, Q10 was found to be negatively correlated with mean annual precipitation (P <0.01) in different forest 5
ecosystems in China, which could be due to the relatively abundant rainfall in the forest ecosystems (700–1956 mm) (Peng et al., 2009). Soil moisture was the major limiting factor that drived underground biological processes, especially in water-limited regions (Reth et al., 2005; Balogh et al., 2011; Wang et al., 2014). Although precipitation was the only source of water for soil moisture underneath long-term bare fallow soil, there 10
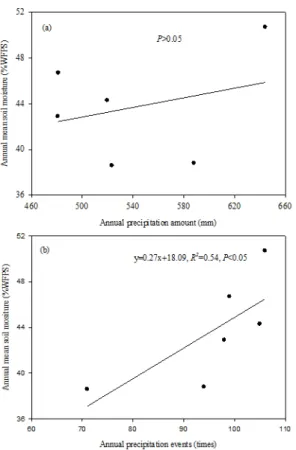
was no significant relationship between annual mean soil moisture and annual precip-itation amount (P >0.05) (Fig. 5a), but rainfall frequency and distribution were closely related to annual mean soil moisture content (Fig. 5b). Similar results have also been found in other studies (Coronato and Bertiller, 1996; Qiu et al., 2001; Cho and Choi, 2014). The annual precipitation during the six-year observation period of 2008–2013 15
ranged from 481 mm (2009) to 644 mm (2011), with a CV of 12 % (Table 1). The annual mean soil moisture content was high (51 % WFPS) in 2011 due to relatively uniform distribution of precipitation, and low (38 % WFPS) in 2010 and 2013 due to relatively uneven distribution of precipitation. For example, the rainfall amount on 23 July 2010 (118 mm) and 22 July 2013 (121 mm) was about 20 and 23 % of that in 2010 (588 mm) 20
and 2013 (523 mm), respectively. However, the annual mean soil moisture was mod-erate (43–47 % WFPS) in 2008, 2009 and 2012 due to the normal distribution of pre-cipitation. Similarly, the interannual soil moisture regulation in the forest ecosystems in the Loess Plateau was determined not only by rainfall amount but also by rainfall distribution (Li et al., 1998).
25
BGD
12, 1453–1474, 2015Temperature sensitivity of SOC
mineralization
Y. Zhang et al.
Title Page
Abstract Introduction
Conclusions References
Tables Figures
◭ ◮
◭ ◮
Back Close
Full Screen / Esc
Printer-friendly Version Interactive Discussion
Discussion
P
a
per
|
Discussion
P
a
per
|
Discussion
P
a
per
|
Discussion
P
a
per
|
et al., 2004; Smith, 2005). This could be attributed to the following reasons: firstly, lower soil water availability could reduceQ10 by limiting respiration substrate availability and soil pore water became increasingly disconnected, thus slowing down the diffusion rate of solutes (Wan et al., 2007; Balogh et al., 2011), and decreasing the activity and quan-tity of organisms due to drought stress (Davidson et al., 2006). Secondly, higher soil 5
moisture could also reduce Q10 by limiting O2 diffusion rate (Davidson et al., 1998; Byrne et al., 2005; Saiz et al., 2007) because of low effective soil porosity, as the diff u-sion rate of O2through water was much slower than that through air (Cook and Knight, 2003; Manzoni et al., 2012), thus the decomposition activity of aerobic microbes was inhibited due to lack of oxygen (Davidson et al., 2000). Finally, the diffusion rate of both 10
soluble organic matter and O2 were not inhibited, also the survival of microorganisms not subject to water stress at suitable soil water content, instead increasing tempera-ture increased the diffusion of soluble organic matter, thus resulting in an increase in Q10 (McCulley et al., 2007). Overall, soil moisture content may be the most important factors that affected the interannual variation in Q10.
15
The variation in the temperature sensitivities of SOC mineralization could have po-tential implications for climate carbon modeling (Davidson and Janssens, 2006; Conant et al., 2011), as uncertainty remains regarding environmental controls over SOC miner-alization (Larionova et al., 2007; Karhu et al., 2010; Conant et al., 2011; Sakurai et al., 2012). The previous results have emphasized the importance of seasonal variation in 20
precipitation and soil moisture in determining the temperature sensitivities of SOC min-eralization (Xu and Qi, 2001; Davidson et al., 2006; Davidson and Janssens, 2006), but have rarely taken into account the interannual variation in soil moisture resulting from the uneven distribution of precipitation. Carbon cycle modeling without considering this interannual variation in soil moisture may produce misleading conclusions.
BGD
12, 1453–1474, 2015Temperature sensitivity of SOC
mineralization
Y. Zhang et al.
Title Page
Abstract Introduction
Conclusions References
Tables Figures
◭ ◮
◭ ◮
Back Close
Full Screen / Esc
Printer-friendly Version Interactive Discussion
Discussion
P
a
per
|
Discussion
P
a
per
|
Discussion
P
a
per
|
Discussion
P
a
per
|
5 Conclusions
Understanding the factors influencing the temperature sensitivity of SOC mineralization is important to accurately estimate local carbon cycle. The results of this study showed that the annual cumulative SOC mineralization, mean soil moisture, and Q10 showed
a large interannual variation, with a CV of 13, 11 and 10 %, respectively. The annual 5
Q10 showed a negative quadratic correlation with annual mean soil moisture, which was determined by uneven distribution and frequency of rainfall. In conclusion, the interannual variation in soil moisture content should be considered in carbon cycle models in semi-arid areas.
References
10
Ågren, G. I. and Wetterstedt, J.: What determines the temperature response of soil organic matter decomposition?, Soil Biol. Biochem., 39, 1794–1798, 2007.
Balogh, J., Pinter, K., Foti, S., Cserhalmi, D., Papp, M., and Nagy, Z.: Dependence of soil respi-ration on soil moisture, clay content, soil organic matter, and CO2uptake in dry grasslands,
Soil Biol. Biochem., 43, 1006–1013, 2011.
15
Bond-Lamberty, B. and Thomson, A.: A global database of soil respiration data, Biogeo-sciences, 7, 1915–1926, doi:10.5194/bg-7-1915-2010, 2010.
Bowden, R. D., Newkirk, K. M., and Rullo, G. M.: Carbon dioxide and methane fluxes by a forest soil under laboratory-controlled moisture and temperature conditions, Soil Biol. Biochem., 30, 1591–1597, 1998.
20
Byrne, K. A., Kiely, G., and Leahy, P.: CO2 fluxes in adjacent new and permanent temperate grasslands, Agr. Forest Meteorol., 135, 82–92, 2005.
Cable, J. M., Ogle, K., Lucas, R. W., Huxman, T. E., Loik, M. E., Smith, S. D., Tissue, D. T., Ewers, B. E., Pendall, E., and Welker, J. M.: The temperature responses of soil respiration in deserts: a seven desert synthesis, Biogeochemistry, 103, 71–90, 2011.
25
BGD
12, 1453–1474, 2015Temperature sensitivity of SOC
mineralization
Y. Zhang et al.
Title Page
Abstract Introduction
Conclusions References
Tables Figures
◭ ◮
◭ ◮
Back Close
Full Screen / Esc
Printer-friendly Version Interactive Discussion
Discussion
P
a
per
|
Discussion
P
a
per
|
Discussion
P
a
per
|
Discussion
P
a
per
|
Conant, R. T., Dalla-Betta, P., Klopatek, C. C., and Klopatek, J. M.: Controls on soil respiration in semiarid soils, Soil Biol. Biochem., 36, 945–951, 2004.
Conant, R. T., Ryan, M. G., Ågren, G. I., Birge, H. E., Davidson, E. A., Eliasson, P. E., Evans, S. E., Frey, S. D., Giardina, C. P., and Hopkins, F. M.: Temperature and soil or-ganic matter decomposition rates–synthesis of current knowledge and a way forward, Glob.
5
Change Biol., 17, 3392–3404, 2011.
Cook, F. and Knight, J.: Oxygen transport to plant roots: modeling for physical understanding of soil aeration, Soil Sci. Soc. Am. J., 67, 20–31, 2003.
Coronato, F. R. and Bertiller, M. B.: Precipitation and landscape related effects on soil moisture in semi-arid rangelands of Patagonia, J. Arid Environ., 34, 1–9, 1996.
10
Davidson, E., Belk, E., and Boone, R. D.: Soil water content and temperature as independent or confounded factors controlling soil respiration in a temperate mixed hardwood forest, Glob. Change Biol., 4, 217–227, 1998.
Davidson, E. A., Verchot, L. V., Cattanio, J. H., Ackerman, I. L., and Carvalho, J. E. M.: Effects of soil water content on soil respiration in forests and cattle pastures of eastern Amazonia,
15
Biogeochemistry, 48, 53–69, 2000.
Davidson, E. A., Janssens, I. A., and Luo, Y. Q.: On the variability of respiration in terrestrial ecosystems: moving beyond Q(10), Glob. Change Biol., 12, 154–164, 2006.
Djukic, I., Zehetner, F., Mentler, A., and Gerzabek, M. H.: Microbial community composition and activity in different Alpine vegetation zones, Soil Biol. Biochem., 42, 155–161, 2010
20
Dörr, H. and Münnich, K.: Annual variation in soil respiration in selected areas of the temperate zone, Tellus B, 39, 114–121, 1987.
Fan, X. H. and Wang, M. B.: Change trends of air temperature and precipitation over Shanxi Province, China, Theor. Appl. Climatol., 103, 519–531, 2011.
Fang, C. and Moncrieff, J. B.: The dependence of soil CO2 efflux on temperature, Soil Biol.
25
Biochem., 33, 155–165, 2001.
Gershenson, A., Bader, N. E., and Cheng, W.: Effects of substrate availability on the tempera-ture sensitivity of soil organic matter decomposition, Glob. Change Biol., 15, 176–183, 2009. Gulledge, J. and Schimel, J. P.: Controls on soil carbon dioxide and methane fluxes in a variety
of taiga forest stands in interior Alaska, Ecosystems, 3, 269–282, 2000.
30
BGD
12, 1453–1474, 2015Temperature sensitivity of SOC
mineralization
Y. Zhang et al.
Title Page
Abstract Introduction
Conclusions References
Tables Figures
◭ ◮
◭ ◮
Back Close
Full Screen / Esc
Printer-friendly Version Interactive Discussion
Discussion
P
a
per
|
Discussion
P
a
per
|
Discussion
P
a
per
|
Discussion
P
a
per
|
Illeris, L., Christensen, T. R., and Mastepanov, M.: Moisture effects on temperature sensitivity of CO2exchange in a subarctic heath ecosystem, Biogeochemistry, 70, 315–330, 2004.
Janssens, I. A. and Pilegaard, K.: Large seasonal changes inQ10of soil respiration in a beech forest, Glob. Change Biol., 9, 911–918, 2003.
Jassal, R. S., Black, T. A., Novak, M. D., Gaumont-Guay, D., and Nesic, Z.: Effect of soil water
5
stress on soil respiration and its temperature sensitivity in an 18-year-old temperate Douglas-fir stand, Glob. Change Biol., 14, 1305–1318, 2008.
Jurasinski, G., Jordan, A., and Glatzel, S.: Mapping soil CO2efflux in an old-growth forest using
regression kriging with estimated fine root biomass as ancillary data, Forest Ecol. Manag., 263, 101–113, 2012.
10
Karhu, K., Fritze, H., Hämäläinen, K., Vanhala, P., Jungner, H., Oinonen, M., Sonninen, E., Tuomi, M., Spetz, P., and Kitunen, V.: Temperature sensitivity of soil carbon fractions in boreal forest soil, Ecology, 91, 370–376, 2010.
Kirschbaum, M. U. F.: The temperature dependence of organic-matter decomposition-still a topic of debate, Soil Biol. Biochem., 38, 2510–2518, 2006.
15
Lafond, J. A., Allaire, S. E., Dutilleul, P., Pelletier, B., Lange, S. F., and Cambouris, A. N.: Spa-tiotemporal analysis of the relative soil gas diffusion coefficient in two sandy soils: variability decomposition and correlations between sampling dates at two spatial scales, Soil Sci. Soc. Am. J., 75, 1613–1625, 2011.
Larionova, A. A., Yevdokimov, I. V., and Bykhovets, S. S.: Temperature response of soil
respi-20
ration is dependent on concentration of readily decomposable C, Biogeosciences, 4, 1073– 1081. 2007.
Li, H. J., Wang, M. B., and Chai, B. F.: Study on characteristics of soil water of planted forest and its relation to precipitation in northwestern shanxi, J. Soil Erosion Soil and Water Conserv., 4, 60–65, 1998.
25
Luan, J. and Liu, S.: temeprature sensitivity of soil respiration: uncertainties of global warming positive or negative feedback, Acta Ecol. Sin., 32, 4902–4913, 2012.
Manzoni, S., Schimel, J. P., and Porporato, A.: Responses of soil microbial communities to water stress: results from a meta-analysis, Ecology, 93, 930–938, 2012.
McCulley, R. L., Boutton, T. W., and Archer, S. R.: Soil respiration in a subtropical savanna
30
parkland: response to water additions, Soil Sci. Soc. Am. J., 71, 820–828, 2007.
BGD
12, 1453–1474, 2015Temperature sensitivity of SOC
mineralization
Y. Zhang et al.
Title Page
Abstract Introduction
Conclusions References
Tables Figures
◭ ◮
◭ ◮
Back Close
Full Screen / Esc
Printer-friendly Version Interactive Discussion
Discussion
P
a
per
|
Discussion
P
a
per
|
Discussion
P
a
per
|
Discussion
P
a
per
|
Poll, C., Marhan, S., Back, F., Niklaus, P. A., and Kandeler, E.: Field-scale manipulation of soil temperature and precipitation change soil CO2flux in a temperate agricultural ecosystem,
Agr. Ecosyst. Environ., 165, 88–97, 2013.
Qiu, Y., Fu, B. J., Wang, J., and Chen, L. D.: Spatial variability of soil moisture content and its relation to environmental indices in a semi-arid gully catchment of the Loess Plateau, China,
5
J. Arid Environ., 49, 723–750, 2001.
Raich, J. W. and Schlesinger, W. H.: The global carbon-dioxide flux in soil respiration and its relationship to vegetation and climate, Tellus B, 44, 81–99, 1992.
Reth, S., Reichstein, M., and Falge, E.: The effect of soil water content, soil temperature, soil pH-value and the root mass on soil CO2 efflux-A modified model, Plant Soil, 268, 21–33,
10
2005.
Reichstein, M., Tenhunen, J. D., Roupsard, O., Ourcival, J. M., Rambal, S., Dore, S., and Valen-tini, R.: Ecosystem respiration in two Mediterranean evergreen Holm Oak forests: drought effects and decomposition dynamics, Funct. Ecol., 16, 27–39, 2002.
Saiz, G., Black, K., Reidy, B., Lopez, S., and Farrell, E. P.: Assessment of soil CO2efflux and
15
its components using a process-based model in a young temperate forest site, Geoderma, 139, 79–89, 2007.
Sakurai, G., Jomura, M., Yonemura, S., Iizumi, T., Shirato, Y., and Yokozawa, M.: Inversely estimating temperature sensitivity of soil carbon decomposition by assimilating a turnover model and long-term field data, Soil Biol. Biochem., 46, 191–199, 2012.
20
Shi, W. Y., Tateno, R., Zhang, J. G., Wang, Y. L., Yamanaka, N., and Du, S.: Response of soil respiration to precipitation during the dry season in two typical forest stands in the forest-grassland transition zone of the Loess Plateau, Agr. Forest Meteorol., 151, 854–863, 2011. Smith, V. R.: Moisture, carbon and inorganic nutrient controls of soil respiration at a
sub-Antarctic island, Soil Biol. Biochem., 37, 81–91, 2005.
25
Solomon, S., Qin, D., Manning, M., Chen, Z., Marquis, M., Averyt, K., Tignor, M., and Miller, H.: Climate Change 2007: the Physical Science Basis. Contribution of Working Group I to the 4th Assessment Report of the Intergovernmental Panel on Climate Change, Cambridge Univ. Press, Cambridge, UK, 2007.
Suseela, V., Conant, R. T., Wallenstein, M. D., and Dukes, J. S.: Effects of soil moisture on
30
BGD
12, 1453–1474, 2015Temperature sensitivity of SOC
mineralization
Y. Zhang et al.
Title Page
Abstract Introduction
Conclusions References
Tables Figures
◭ ◮
◭ ◮
Back Close
Full Screen / Esc
Printer-friendly Version Interactive Discussion
Discussion
P
a
per
|
Discussion
P
a
per
|
Discussion
P
a
per
|
Discussion
P
a
per
|
Tang, J., Qi, Y., Xu, M., Misson, L., and Goldstein, A. H.: Forest thinning and soil respiration in a ponderosa pine plantation in the Sierra Nevada, Tree Physiol., 25, 57–66, 2005.
Vanhala, P., Karhu, K., Tuomi, M., Bjorklof, K., Fritze, H., Hyvarinen, H., and Liski, J.: Transplan-tation of organic surface horizons of boreal soils into warmer regions alters microbiology but not the temperature sensitivity of decomposition, Glob. Change Biol., 17, 538–550, 2011.
5
Von Lutzow, M. and Kogel-Knabner, I.: Temperature sensitivity of soil organic matter decomposition-what do we know?, Biol. Fert. Soils, 46, 1–15, 2009.
Wan, S., Norby, R. J., Ledford, J., and Weltzin, J. F.: Responses of soil respiration to elevated CO2, air warming, and changing soil water availability in a model old-field grassland, Glob. Change Biol., 13, 2411–2424, 2007.
10
Wang, B., Zha, T. S., Jia, X., Wu, B., Zhang, Y. Q., and Qin, S. G.: Soil moisture modifies the response of soil respiration to temperature in a desert shrub ecosystem, Biogeosciences, 11, 259–268, doi:10.5194/bg-11-259-2014, 2014.
Wang, Q. X., Fan, X. H., Qin, Z. D., and Wang, M. B: Change trends of temperature and precipitation in the Loess Plateau Region of China, 1961–2010, Global Planet. Change,
15
92–93, 138–147, 2012.
Xiao, L., Xue, S., Liu, G. B., and Zhang, C.: Soil moisture variability under different land uses in the Zhifanggou catchment of the Loess Plateau, China, Arid Land Res. Manag., 28, 274– 290, 2014.
Xu, M. and Qi, Y.: Spatial and seasonal variations ofQ10 determined by soil respiration
mea-20
surements at a Sierra Nevadan forest, Global Biogeochem. Cy., 15, 687–696, 2001.
BGD
12, 1453–1474, 2015Temperature sensitivity of SOC
mineralization
Y. Zhang et al.
Title Page
Abstract Introduction
Conclusions References
Tables Figures
◭ ◮
◭ ◮
Back Close
Full Screen / Esc
Printer-friendly Version Interactive Discussion
Discussion
P
a
per
|
Discussion
P
a
per
|
Discussion
P
a
per
|
Discussion
P
a
per
|
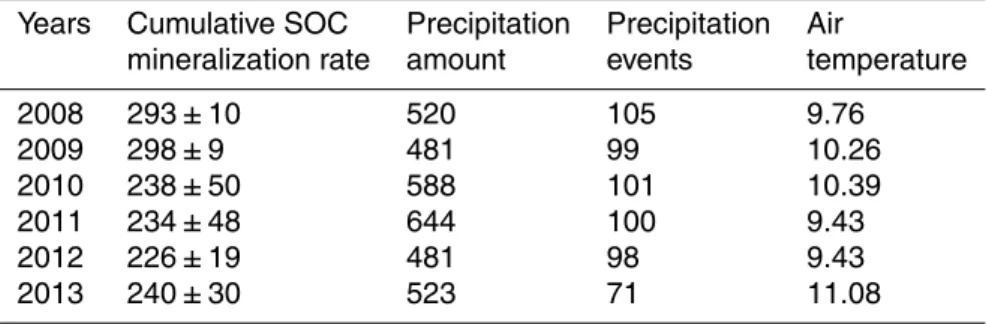
Table 1. Cumulative SOC mineralization rate (g C m−2
year−1
), annual precipitation amount (mm), annual precipitation events (times), and air temperature (◦C) from 2009 to 2013. Data are represented as mean±SD.
Years Cumulative SOC Precipitation Precipitation Air
mineralization rate amount events temperature
2008 293±10 520 105 9.76
2009 298±9 481 99 10.26
2010 238±50 588 101 10.39
2011 234±48 644 100 9.43
2012 226±19 481 98 9.43
BGD
12, 1453–1474, 2015Temperature sensitivity of SOC
mineralization
Y. Zhang et al.
Title Page
Abstract Introduction
Conclusions References
Tables Figures
◭ ◮
◭ ◮
Back Close
Full Screen / Esc
Printer-friendly Version Interactive Discussion
Discussion
P
a
per
|
Discussion
P
a
per
|
Discussion
P
a
per
|
Discussion
P
a
per
|
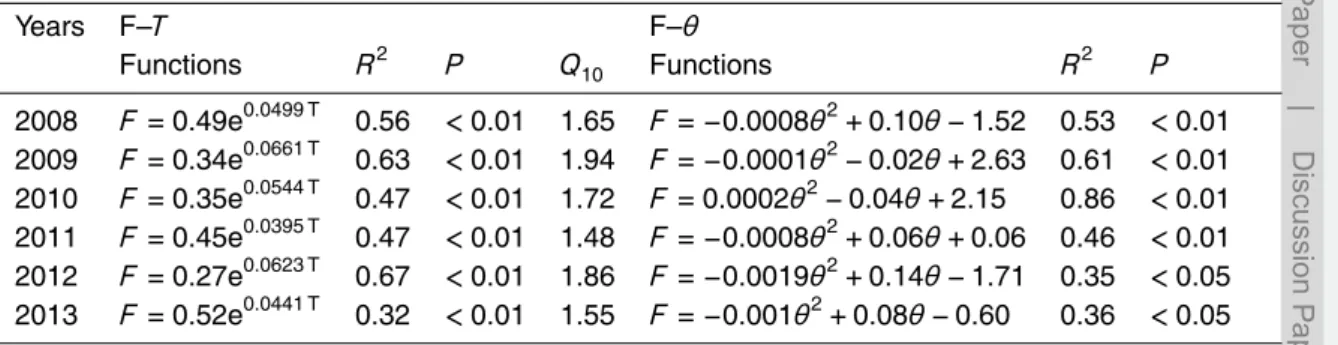
Table 2. Relationships between SOC mineralization rate and soil temperature (F–T) or soil moisture (F–θ) for each year from 2008 to 2013.
Years F–T F–θ
Functions R2 P Q10 Functions R2 P
2008 F =0.49e0.0499 T 0.56 <0.01 1.65 F =−0.0008θ2+0.10θ−1.52 0.53 <0.01
2009 F =0.34e0.0661 T 0.63 <0.01 1.94 F =−0.0001θ2−0.02θ+2.63 0.61 <0.01
2010 F =0.35e0.0544 T 0.47 <0.01 1.72 F =0.0002θ2−0.04θ+2.15 0.86 <0.01 2011 F =0.45e0.0395 T 0.47 <0.01 1.48 F =−0.0008θ2+0.06θ+0.06 0.46 <0.01
2012 F =0.27e0.0623 T 0.67 <0.01 1.86 F =−0.0019θ2+0.14θ−1.71 0.35 <0.05
BGD
12, 1453–1474, 2015Temperature sensitivity of SOC
mineralization
Y. Zhang et al.
Title Page
Abstract Introduction
Conclusions References
Tables Figures
◭ ◮
◭ ◮
Back Close
Full Screen / Esc
Printer-friendly Version Interactive Discussion
Discussion
P
a
per
|
Discussion
P
a
per
|
Discussion
P
a
per
|
Discussion
P
a
per
|