Universidade do Algarve
Faculdade de Engenharia e Recursos Naturais
Nanoparticle-Based Biosensors:
Development and Application
Tese para a obtenção do grau de doutor no ramo de Ciências Biotecnológicas, especialidade de Biotecnologia Molecular
Raul Baltazar
Faro
2009
Universidade do Algarve
Faculdade de Engenharia e Recursos Naturais
Nanoparticle-Based Biosensors:
Development and Application
Tese para a obtenção do grau de doutor no ramo de Ciências Biotecnológicas, especialidade de Biotecnologia Molecular
Raul Baltazar
Orientador: Doutor Guilherme Ferreira
Constituição do Júri:
Presidente: Reitor da Universidade do Algarve
Vogais:
Doutor João Pedro Estrela Rodrigues Conde; Doutor Alfredo Jaime Cravador;
Doutor Tito da Silva Trindade (relator);
Doutor Guilherme Nuno de Passos Correia Matos Ferreira; Doutor Carlos dos Santos Silva e Pereira de Lima (relator).
Faro
2009
Abstract
The development of technologies for imaging systems is a key issue in Medical Bioengineering. Within that context, the establishment of methodologies to link biomolecules to metallic and/or semiconductor nanoparticles, generating biologically active colorimetric sensors, constitutes an important research field towards the detection of molecular interactions both in
vivo and in vitro. This thesis deals with the study and application of nanoparticle-based
colorimetric sensors, namely gold nanoparticles (AuNPs) and quantum dots (QDs), for the study of biomolecular interactions and for biosensing purposes.
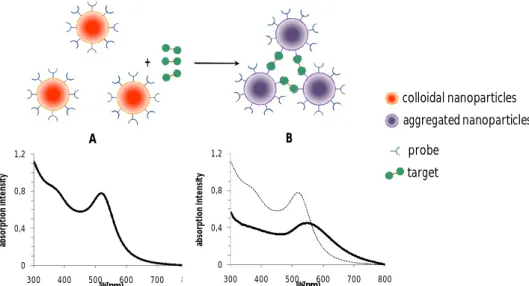
AuNPs are well known for their strong interactions with light that result on surface plasmon resonances (SPRs) which are transduced by characteristic optical absorption profiles. The wavelength peak of those plasmon resonances is found to depend greatly on three major factors: the nanoparticles morphology, the dielectric characteristics of the medium in which the nanoparticles are embedded and the interparticle distances. Since the SPR peak shifts to higher wavelengths and broadens when nanoparticles are brought close together, due to interparticle plasmon coupling, the biorecognition-induced aggregation of AuNPs has become a very attractive tool as colorimetric transduction signal in a variety of biosensing platforms. In this thesis, the colorimetric signal changes generated upon AuNPs aggregation was explored for the development of strategies for immunosensing and DNA-detection.
QDs, on their hand, possess unique photophysical properties for the development of robust and efficient fluorescent sensors, including high quantum yields, broad absorption spectra, narrow size-tunable photoluminescent emissions and exceptional resistance to both photobleaching and chemical degradation. Additionally, scientific research over the last few years proved that these nanometer-sized semiconductor particles can be linked with a range of biomolecules (including: peptides, antibodies, nucleic acids, and small-molecule ligands) and be used as biological labels. In this thesis, a few critical steps were taken on the characterization of
the QDs photoluminescence properties, namely: under long-term photo-excitation with laser light and, when exposed to range of different temperatures.
Keywords: gold nanoparticles; surface plasmon resonance; quantum dots; biosensing.
Resumo
O desenvolvimento de tecnologias para sistemas de produção de imagem é de importância chave do ponto de vista da Bioengenharia Médica. Neste âmbito, o estabelecimento de metodologias para ligar moléculas biológicas a nanopartículas metálicas e/ou semiconductoras, gerando assim sensores colorimétricos biologicamente activos, é uma área científica de grande importância para a detecção de interacções moleculares tanto in vivo como
in vitro. Nesta tese faz-se o estudo e a aplicação de sensores colorimétricos baseados em
nanopartículas (nomeadamente: nanopartículas de ouro e quantum dots) para a detecção de interacções moleculares e no desenvolvimento de biosensores.
As nanopartículas de ouro são conhecidas pelas interacções fortes que têm com a luz, resultando em ressonâncias do plasmão de superfície que são transduzidas por um perfil característico no espectro de absorção óptica. O comprimento de onda a que se encontra o máximo dessas ressonâncias depende fortemente de três factores principais: a morfologia das nanopartículas, as características dieléctricas do meio no qual as partículas estão inseridas e a distância entre partículas. Devido ao acoplamento das ressonâncias das partículas que ocorre quando distância entre elas suficientemente reduzida, o pico da ressonância do plasmão alarga-se e é desviado para maiores comprimentos de onda. Por isso, a indução da agregação de nanopartículas de ouro através de reconhecimento biomolecular tem-se revelado como ferramenta geradora de sinais colorimétricos numa variedade cada vez maior de plataformas bio-sensoras. Nesta tese, os sinais colorimétricos gerados pela agregação de nanopartículas de ouro são explorados no desenvolvimento de estratégias para sensores imunológicos e para detecção de DNA.
Os quantum dots possuem propriedades fotofísicas únicas para o desenvolvimento de sensores de fluorescência robustos e eficientes. Estas propriedades incluem: altas eficiências quânticas, espectro de absorção largo, emissões foto-luminescentes com bandas estreitas cuja posição no espectro óptico é ajustável pelo ajuste do tamanho físico destas nanopartículas, e uma resistência excepcional tanto à perda de eficiência luminescente como à degradação química. Adicionalmente, nos últimos anos, a investigação científica tem vindo a provar que estas partículas semiconductoras de tamanho nanométrico podem ser ligadas a uma grande variedade de biomoléculas (incluindo: péptidos, anticorpos, ácidos nucleicos, e pequenas moléculas ligantes), permitindo o seu uso na marcação óptica dessas biomoleculas. Nesta tese, foram dados alguns passos críticos na caracterização das propriedades foto-luminescentes dos quantum dots, nomeadamente quando sujeitos a duas condições particulares: exposição à excitação laser por tempos prolongados, e exposição diferentes temperaturas.
Palavras-chave: nanopartículas de ouro, ressonância do plasmão de superfície, quantum
Acknowledgments
Four years ago biotechnology seemed to me as an exotic and futuristic world. Today, I see it as a window that allows me to look inside a beaker and see a whole universe of atomic dimensions with amazing properties.
I am deeply grateful to Prof. Guilherme Ferreira, my supervisor, for a number of reasons, among which: for believing that, as a physicist, I could give a positive input into to the research developed in his laboratory as a member of his recently formed research team; for pushing me through in my scientific quest within the biotechnology world, even when I stumbled at the some difficulty; for his guidance; and, perhaps most of all, for teaching me to ask questions – the right questions! – and then to search for the answers.
I am grateful to my lab mates and friends: Luís Rosa, Luísa Pedro, Rogério Rodrigues, João Encarnação and more recently to Sandra Soares, first for their joyful team-spirit and second for helping me “getting this job done”. I must devote a special thanks to Luís and to Luísa, for their continuous efforts (and unending patience!) in trying to make a biotechnologist out of me.
I thank to my closest friends outside the lab (Dário, Sandra, Patrick, Marlene, Rui, Zézinha, Viktor, Dina, Elsa, Helder, Gonçalo) who, in times of despair, told me: Fight! You can do it!
Thanks to my family for their spiritual support, their love and for believing in me. The words to thank my parents, Fernanda e António, are still to be invented! This achievement is yours.
I thank to my wife, Sónia, for her love and understanding, for keeping me in track towards what, in the end, matters - US.
I devote this work to my daughter, Lia. Her little smile, her happy laughing have the healing properties that no science can ever reach.
I acknowledge the Portuguese Foundation for Science and Technology, for my PhD grant number SFRH/BD/17286/2004 and for the funding to the projects POCTI/BIO/38922 and POCTI/CTM/37719.
Index
Abstract ... iii
Resumo ... v
Acknowledgments ... vii
Index ... ix
List of Tables ... xiii
List of Figures ... xv
List of abbreviations ... xxi
1. Introduction ... 23
1.1. Biosensors: a definition ... 23
1.2. Nanoparticles: a definition ... 24
1.3. Gold Nanoparticles ... 25
1.3.1. Surface Plasmon Resonance ... 25
1.3.2. Synthesis and Functionalization ... 32
1.3.3. Biosensing ... 36
1.4. Semiconductor Quantum Dots ... 47
1.4.1. Fundamental Principles and Definitions ... 47
1.4.2. Properties of Quantum Dots ... 51
1.4.3. Synthesis and Functionalization ... 53
1.4.4. Biosensing ... 59
2. Summary ... 67
3.1. Introduction ... 70
3.2. Materials ... 71
3.3. Experimental Methods ... 71
3.3.1. dsDNA hybridization and purification ... 71
3.3.2. Sample preparation... 72
3.4. Results and Discussion ... 73
3.4.1. Experimental ... 73
3.4.2. Mathematical Design... 76
3.5. Conclusions ... 80
4. Biosensing with aptamers ... 81
4.1. Introduction ... 81
4.1.1. Aptamers ... 81
4.1.2. Targets ... 82
4.2. Materials and Methods ... 84
4.2.1. Reagents ... 84
4.2.2. Instrumentation ... 84
4.2.3. Experimental Methods ... 85
4.3. Results and Discussion ... 86
4.3.1. Target: Inflexal V ... 87
4.3.2. Target: Haemagglutinins ... 92
4.4. Conclusions ... 93
5. Development of Gold Nanoparticles Based Colorimetric Immunosensing 95 5.1. Introduction ... 95
5.2. Materials and Methods ... 96
5.2.1. Reagents ... 96
5.2.2. Instrumentation ... 96
5.2.3. Experimental Methods ... 97
5.3.1. Gold Nanoparticles Biotinylation ... 99
5.3.2. Streptavidin Induced Aggregation ... 104
5.3.3. Kinetics of Streptavidin Induced Aggregation ... 108
5.3.4. Real-time Monitoring of Streptavidin Induced Aggregation ... 114
5.4. Conclusions ... 116
6. Quantum Dots photoluminescence under long term-photoexcitation and temperature dependence ... 119
6.1. Introduction ... 119
6.2. Materials and Methods ... 120
6.2.1. Reagents ... 120
6.2.2. Experimental Setup... 121
6.2.3. Experimental Methods ... 122
6.3. Results and Discussion ... 123
6.3.1. Temperature Profiling ... 123
6.3.2. Long-term Photo-excitation Profiling... 126
6.4. Conclusions ... 133
7. Concluding Remarks ... 135
7.1. Future work ... 137
List of Tables
Table 3.1 – List of the samples prepared, detailing the respective concentrations of NaCl and of DNA (either single- or double-stranded). Here: 26.5, 53.0, 79.5 and 106.3 nM of DNA correspond, respectively, to 0.5, 1.0, 1.5 and 2.0 times the maximum-estimated-coverage (m.e.c.) with 20-base ssDNA. Notice that dsDNA was mixed at the same concentrations as the ssDNA, although the estimated “hypothetical” coverages are naturally different (lower). ... 73 Table 3.2 - Analysis of Variance (ANOVA), from Statistica©. df: degrees of freedom; F: Fisher test, p-value: probability distribution value. The correlation coefficient (R2) was 0.97. ... 78 Table 4.1 – Sequential steps for the preparation of each of the 8 samples, aiming the detection of the vaccine
Inflexal V. In each sample, the reagents were introduced sequentially (top-to-bottom) in the borosilicate vials of a
microplate. ... 90 Table 5.1 – Comparison of the averaged flocculation parameter measured 7 and 24 hours upon introducing the streptavidin (during the last 17 hours the samples were left standing in dark, at room temperature). ... 107 Table 6.1 – Samples preparation scheme detailing the NaCl concentration present on the dilution buffer of each sample. ... 123 Table 6.2 – Results from fitting Equation 6.2 to the variation to the luminescence intensity during the long-term photo-excitation of samples -A1, -B1 and -C1. ... 133
List of Figures
Figure 1.1 - Illustration of the typical band structure of: a metal particle with bulk properties, (b) a large cluster of cubic close-packed atoms, and (c) a simple tri-atomic cluster. c.b. = conduction band; v.b. = valence band. (Adapted from: Schmid, 1992). ... 26 Figure 1.2 – Scheme illustrating the oscillation of the surface plasmon dipole. The electric field of an incoming light wave induces a polarization of the (free) conduction electrons with respect to the much heavier ionic core of a spherical AuNP. The net charge difference occurs only at the nanoparticle surfaces, and act as restoring force. Consequently, a dipolar oscillation of the plasmon electrons is created with period Τ. (Adapted from: Link and El-Sayed, 2000). ... 27 Figure 1.3 – (A) UV-Vis absorption spectra of 9, 22, 48 and 99 nm diameter AuNPs in water. All spectra are normalized at their absorption maxima, which are 517, 521, 533 and 575 nm, respectively. (B) UV-Vis spectra of gold nanorods with aspect ratios of (a) 1.5, (b) 2.0 and (c) 2.5. (Adapted from: Link and El-Sayed, 1999; Todera et
al., 2009) ... 29
Figure 1.4 – Simulated optical absorption spectra for 10 nm AuNPs embedded in media with εm = 1.0. 1.77, 2.0 and 2.5. (Adapted from: Pérez-Luna et al., 2004). ... 29 Figure 1.5 – (A) Comparison of computer-simulated (⊡ = 72 nm nanoparticles, ⨀ = 84 nm nanoparticles) and experimentally measured (△) resonant wavelength shifts as a function of the gap between two particles. The longitudinal-mode absorption peak-shift decays exponentially with increasing particle spacing, and the decay function is size independent because the shift and the gap are scaled by the wavelength peak and particle size, respectively. Computer simulations were performed using the Discrete Dipole Approximation. (B) Electrodynamic calculations of the extinction spectra variation of a pair of 20 nm diameter AuNPs as a function of the interparticle distance. Inset is the peak shift vs. interparticle distance. Spectra calculated considering the Generalized Multiparticle Mie (GMM) method (Adapted from: Su et al., 2003; Zhong et al., 2004). ... 31 Figure 1.6 – Two main routes to attach bio-functional ligands to AuNPs surfaces. R1: ligands with the desired Z functionality react directly with the nanoparticles; R2: a ligand with a Y functionality reacts directly with the nanoparticles and, in a second step, is converted in the desired functionality Z. Notice that both methods may be applied, in principle, both to citrate-coated AuNPs and to AuNPs synthesized with coating ligands; the difference is that, in the later case, the direct attachment of the “primary” ligands is made through a ligand-exchange-reaction (Adapted from: Neouze and Schubert, 2008). ... 34 Figure 1.7 – Main routes for the attachment of biomolecules to AuNPs surfaces. (A) electrostatic interaction between the negatively charged AuNPs surfaces and positively charged domains on the biomolecules; (B) covalent binding between thiol groups present on the biomolecule (innately or modified) and gold surfaces; (C) amide bond formation between carboxyl groups on the AuNPs surfaces and amine groups present on the biomolecule (innately or modified), through EDC/NHS chemistry; (D) affinity interactions between streptavidin labeled AuNPs and biotin-modified biomolecules. (Adapted from: Katz and Willner, 2004)... 35 Figure 1.8 – Schematic example of biorecognition-induced aggregation of AuNPs. (A) Colloidal solution of probe-functionalized AuNPs and its typical optical absorption spectrum. (B) The biorecognition-induced aggregation of the functionalized AuNPs by means of interaction with the target analyte results in a plasmon peak shift towards higher wavelength as well as in broadening of the spectrum, which can be detected with the naked eye by a color change from red-to-blue of the colloidal solution. ... 37 Figure 1.9 – (A) left vial: colloidal solution of AuNPs; right-vial: solution of aggregated AuNPs; (B) Optical absorption spectrum evolution along time of an example of an aggregating system consisting of a solution of ~10 nm AuNPs to which NaCl was mixed ([NaCl]f = 150 mM); (C) spectra of colloidal (red) and aggregated (purple)
AuNPs normalized to the intensity at the absorption peak. Each of the shaded areas corresponds to the flocculation parameter value at each aggregation status. ... 38 Figure 1.10 – Top scheme: AuNPs aggregation through interparticle crosslinking: A) AuNPs are brought close together by target molecules having multiple binding sites for the corresponding receptors previously attached on nanoparticles surfaces; B) biological recognition events (or processes) that remove (or break) crosslinking molecules, causing redispersion of the nanoparticles; C) biological recognition events (or processes) that can modify crosslinking molecules, avoiding aggregation, and D) biological recognition events (or processes) that can modify the receptors on the nanoparticles surfaces, can indirectly control aggregation and redispersion. Bottom scheme: AuNPs aggregation induced by direct recognition (without crosslinkers) of receptor-modified nanoparticles and complementary-modified nanoparticles: E) biological recognition events (or processes) that break these interparticle interactions result redispersion of the nanoparticles; F) aggregation can be regulated by biological processes that
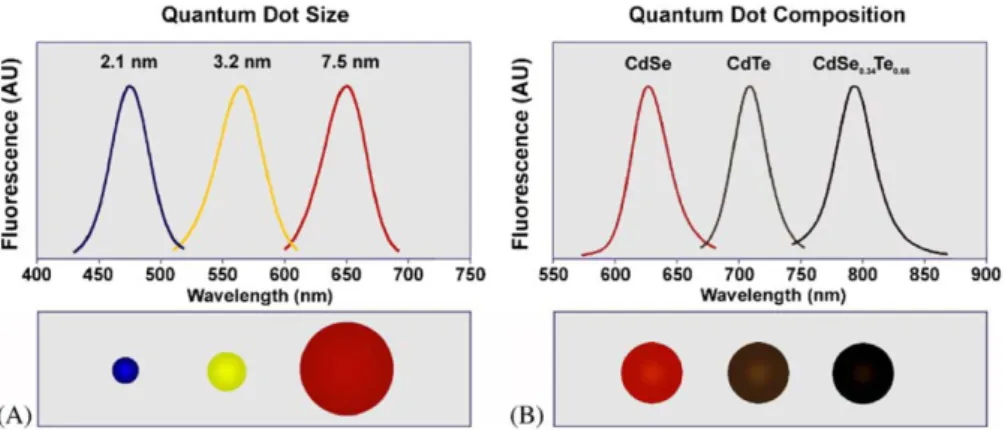
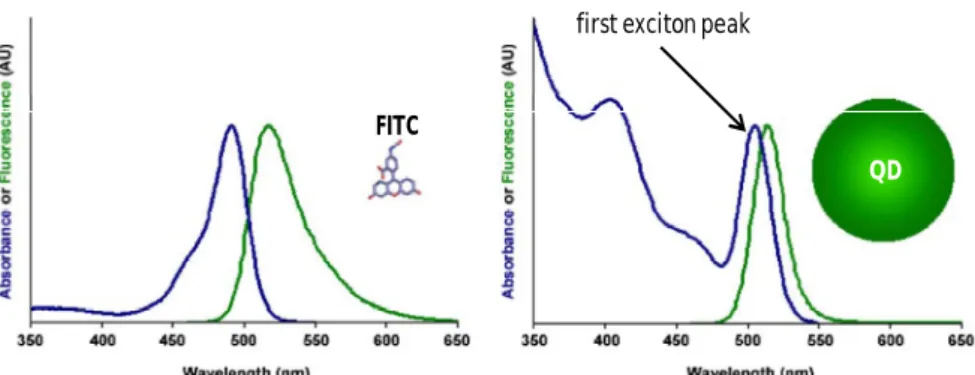
modify surface-attached receptors (equivalent to pathway D in the top scheme). (Adapted from: Zhao et al., 2008). ... 40 Figure 1.11 – Scheme of a Pb2+ biosensor. (A) Special ssDNA-covered AuNPs are aggregated by means of crosslinking with a specific DNA-enzyme (17E). In the presence of Pb2+, the enzyme cleaves the substrate (17DS) at the RNA (rA) linkage, leading to redispersion of the aggregated AuNPs. (Adapted from: Liu and Lu, 2005 )... 41 Figure 1.12 – Glucose sensing mechanism. Dextran-coated AuNPs are induced to aggregate through crosslinking with concanavalin-A. When mixed in solution, glucose competitively binds to concanavalin-A resulting in the redispersion of the AuNPs (Adapted from: Aslan et al., 2004). ... 41 Figure 1.13 – (A) bare AuNPs are induced to aggregate through crosslinking with cysteine-terminated peptides. (B) the specific protease (target) cleaves the crosslinking peptide in two, eliminating the aggregation mechanism... 42 Figure 1.14 – Illustration of the application of DNA-aggregated AuNP probes for colorimetric screening of endonuclease inhibitors. (Adapted from: Xu et al., 2007) ... 42 Figure 1.15 – Schematic illustration of the working cycle and color change of the special ssDNA-functionalized AuNP under acid and basic pH. (Adapted from: Sharma et al., 2007) ... 43 Figure 1.16 – Representation of the colorimetric method for differentiating between single- and double-stranded oligonucleotides. (Adapted from: Li and Rothberg, 2004). ... 44 Figure 1.17 – Schematic illustration of AuNP aggregation and color change triggered by the enzymatic cleavage of DNA on AuNPs. Before enzymatic cleavage, DNA-modified AuNPs are stable at a relatively high salt concentration owing to the electrostatic and steric stabilization. The removal of DNA (colloidal stabilizer) on the AuNP surface by enzymatic cleavage destabilizes the AuNP and results in a rapid aggregation. (Adapted from: Zhao et al., 2008) ... 45 Figure 1.18 – Schematics of the continuous energy levels structure in bulk semiconductor materials. Shaded areas represent the energy levels occupied by electrons and the white areas represent the energy levels available to the electrons in the semiconductor material. c.b. = conduction band; v.b. = valence band. Refer to the text for the detailed description. ... 48 Figure 1.19 – Schematics comparing the structure of the energy levels in (a) bulk semiconductor materials and (b) in quantum dots. EBR = Exciton Bohr Radius... 49 Figure 1.20 - Representation of theoretically predicted electronic structure of CdSe/ZnS core/shell quantum dots, and proposed exciton recombination routes. (Adapted from: Jones et al., 2003)... 50 Figure 1.21 – The emission wavelength of quantum dots is tuned by changing the nanoparticle size and/or its composition. (A) The emission wavelength of CdSe quantum dots may be adjusted within the range from 450 to 650 nm by selecting the nanoparticle diameters between 2 and 7.5 nm. (B) While keeping the nanoparticle size constant (5 nm in diameter) and varying the composition of the ternary alloy CdSexTe1-x, the emission maximum may be tuned to any wavelength between 610 and 800 nm. (Image originally published in: Bailey et al., 2004). ... 51 Figure 1.22 – Comparison between the absorbance and emission profiles of a quantum dot and FITC (an organic dye). (Adapted from: Bailey et al., 2004). ... 52 Figure 1.23 – (A) Growth of the quantum dots cores (e.g. CdSe) in coordinating solvents. (B) Growth of a higher band gap semiconductor shell (e.g., ZnS) over the (CdSe) cores. (Adapted from: Bailey et al. 2004). ... 54 Figure 1.24 – Illustration of the two general strategies to disperse hydrophobic quantum dots in aqueous solutions. (A) Ligands exchange reaction: TOPO is replace by bifunctional ligands such as mercaptoaceptic acid. (B) Native TOPO is maintained on the quantum dots surfaces and are covered with an amphiphilic polymer. (Adapted from: Bailey et al. 2004) ... 56 Figure 1.25 – Schematics of the most common methods to conjugate carboxylic acid covered quantum dots to biological molecules such as proteins, peptides, nucleic acids, or small organic molecules. For the sake of clarity, the elements of this scheme are not proportional in size. . (Adapted from: Smith et al., 2006). ... 57 Figure 1.26 – Representation of the quantum dot-based binding assay to quantitate HTLV-1 binding to target cells. (Adapted from: Kampani et al, 2007) ... 58 Figure 1.27 – QD-based immunoassay for cancer-marker detection. (1) The antibody of the target-protein is immobilized on a solid substrate; (2) the target-protein is recognized by the immobilized antibodies; (3) secondary antibodies are allowed to bind to the target-proteins on the substrate; (4) Streptavidin-conjugated quantum dots are captured on the substrate through biotin-streptavidin affinity. (Adapted from: Kerman et al., 2007) ... 60 Figure 1.28 – Schematics of the strategy for the simultaneous detection of four different toxins. First, antibodies against all four toxins were adsorbed on a solid surface. Second, the immobilized antibodies were exposed to a mix
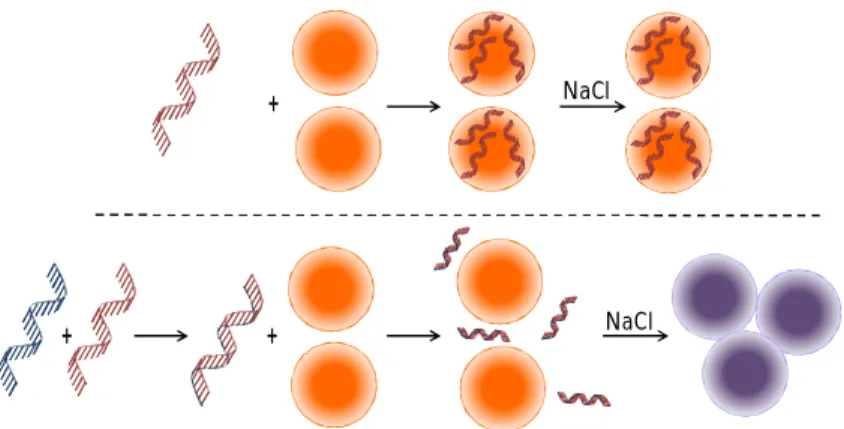
of all four toxins. Third, toxins were detected by anti-toxin antibodies conjugated to the various QDs. (Adapted from: Goldman et al., 2006) ... 60 Figure 1.29 – Multiplexed analysis of anthrax-related genetic targets for pathogenicity. (A) color pallet for the three QD-labeled target-probe pairs and their resulting colocalized fluorescent images upon hybridization. (B) Fluorescent image showing detection of the three genetic targets. (Adapted from: Ho et al., 2005) ... 61 Figure 1.30 – Schematics of the RET-based maltose-sensor with quantum dots as energy donors. (Adapted from: Costa-Fernandez, 2006) ... 63 Figure 1.31 – Conformational diagram of a molecular beacon in the presence and in the absence of the complementary target. (Adapted from: Kim et al., 2008) ... 64 Figure 1.32 – Illustration of the activation of the QD-AuNPs based probe. Protease cleavage of the peptide linker releases the AuNPs that were suppressing QDs fluorescence. (Adapted from: Chang et al.. 2005) ... 65 Figure 3.1 – Representation of the electrostatic (attractive) interaction between bare AuNPs and single-stranded DNA, and the protection-against-salt-induced-aggregation effect of the later over the former. ... 70 Figure 3.2 - Representation of the electrostatic (repulsive) interaction between bare AuNPs and double-stranded DNA, with no protection-against-salt-induced-aggregation. ... 71 Figure 3.3 – Image of an agarose gel (under UV illumination) used to purify double-stranded DNA from non-hybridized single-strands. ... 72 Figure 3.4 - Flocculation parameter variation values (averaged over the triplicates), as a function of the salt and ssDNA (or dsDNA) concentrations. The values presented are relative to the flocculation parameter of AuNPs diluted to the same final concentration with milli-Q water. The standard deviation (not shown) was measured below 20%.
Purple bars: control samples (to which no DNA was mixed); Green bars: ssDNA containing samples; Red bars:
dsDNA containing samples. ... 74 Figure 3.5 – Variation of the flocculation parameter values as a function of the ssDNA concentration, for each set of samples with different salt concentrations. The marks at the xx axis origin correspond to the respective control samples (to which no DNA was mixed). The presented flocculation values are absolute and the lines were introduced to help guiding the eye. ... 74 Figure 3.6 – Representation of ideal “well ordered” adsorption of single-strands on the AuNP surface. Maximum estimated coverage ≈ 17 ssDNA per AuNP. ... 75 Figure 3.7 – Representation of a non-ideal (perhaps more close to reality) adsorption of single strands of DNA on the AuNP surface. ... 75 Figure 3.8 – Representation of the extreme case of ssDNA adsorption where each strand adsorbs “standing up” to the AuNP surface. Maximum estimated coverage ≈ 92 ssDNA per AuNP. ... 75 Figure 3.9 – Variation of the flocculation parameter values as a function of the NaCl concentration, for each set of samples with different ssDNA concentrations. The mark at the xx axis origin corresponds to the (equal) flocculation parameter values of the samples to which no salt was mixed. The flocculation values shown are absolute and the lines were introduced to help guiding the eye. ... 76 Figure 3.10 – Factors levels and respective responses chosen for the full-factorial-design. Note that the values at the corners of the square are the averaged responses at the respective factors levels. ... 77 Figure 3.11 - Three-dimensional plot of Equation 3.1, within the investigated levels range. The blue marks at the corners of the response surface represent the experimentally obtained flocculation parameter values used on the design. ... 78 Figure 3.12 – Normal probability plot of the residuals, from Statistica©. ... 79 Figure 3.13 - Comparative results between the experimentally obtained flocculation parameter values and the predicted by Equation 1. ... 79 Figure 4.1 – A successfully engineered aptamers folds to a highly specific architecture upon biorecognition/binding to its target... 82 Figure 4.2 – Schematics of an influenza virosome (from www.pevion.com). ... 83 Figure 4.3 – A: bare AuNPs aggregate when challenged with certain amounts of salt. B: in the absence of the target, aptamers present themselves sufficiently unfolded, exposing the positively charged bases to the electrostatic attraction towards the negatively charge AuNPs surfaces. Upon binding, nanoparticles acquire extra “resistance” against salt induced aggregation. C: when put into contact with its specific target, the aptamers fold, acquiring a
highly ordered structure while binding to it, leaving the AuNPs unprotected against salt-induced aggregation. ... 85 Figure 4.4 – Schemes of the three variations of the designed experimental strategy for the detection of the vaccine
Inflexal V, using unmodified AuNPs solutions and specific aptamers. ... 88
Figure 4.5 – Results, in terms of flocculation parameter variation, of the assays performed for the detection of the vaccine Inflexal V with unmodified AuNPs and specific aptamers. The results are average over triplicates, and the error bars represent the calculated standard-deviation. All measurements were performed one hour upon introducing the last reagent. Sample-1 (control-sample): unmodified bare AuNPs solution challenged with 100 mM of NaCl. Sample-2 (control-sample): aptamer-to-nanoparticle ratio = 5 : 1. Sample-3 (control-sample): haemagglutinin-to-nanoparticle ratio = 5 : 1. Sample-4: aptamer-to-haemagglutinin-to-haemagglutinin-to-nanoparticle ratio = 5 : 5 : 1. Sample-5: aptamer-to-haemagglutinin-to-nanoparticle ratio = 5 : 10 : 1. Sample-6: aptamer-to-haemagglutinin-to-nanoparticle ratio = 5 : 5 : 1. Sample-7: haemagglutinin-to-nanoparticle ratio = 5 : 5 : 1. Sample-8: aptamer-to-haemagglutinin-to-nanoparticle ratio = 5 : 10 : 1. ... 89 Figure 4.6 - Results, in terms of flocculation parameter variation, of the assays performed for the detection of the purified haemagglutinins with unmodified AuNPs and specific aptamers. The results are average over triplicates, and the error bars represent the calculated standard-deviation. All measurements were performed one hour upon introducing the last reagent (HA = haemagglutinin). ... 92 Figure 5.1 – In the absence of a stabilizing agent (bottom route), colloidal AuNPs undergo aggregation during the chemisorption of the alkanethiol linkers. This has been attributed to the hydrophobic character acquired by the gold surfaces during self-assembled-monolayer formation due to the exposed methylene chains of the linkers (Aslan and Pérez-Luna, 2002). On the other hand, if a surfactant monolayer is physisorbed on the nanoparticles surfaces prior to the introduction of the alkanethiols in solution (upper route), steric repulsion keeps the nanoparticles from aggregating during the chemisorption of the alkanethiols. When the full linker monolayer is formed, aggregation no longer occurs and the surfactant is no longer needed. (Adapted from: Aslan and Pérez-Luna, 2002). ... 97 Figure 5.2 – Scheme of the procedure utilized to functionalize 9.6 nm AuNPs with biotin molecules. Step 1: physisorption of a surfactant monolayer at the nanoparticles surfaces; Step 2: chemisorption of the self-assembled-monolayer of linkers with the probe molecules; Step 3: washing by centrifugation to remove unbound linkers and biotin molecules. ... 98 Figure 5.3 – Scheme representing the aggregation of two biotinylated nanoparticles by means of biomolecular recognition of a streptavidin molecule. ... 99 Figure 5.4 – Typical optical absorption spectra at each step of the AuNPs biotinylation procedure. Refer to subsection 5.2.3.1 for detail description of the procedures at each step. ...100 Figure 5.5 – Variation of the optical parameters during the AuNPs functionalization procedure. Left-hand side plot: variation of the SPR peak position; Middle plot: absorption intensity variation at the SPR peak (the dilution factors were accounted for); Right-hand side plot: flocculation parameter variation. The lines that connect the marks are an aid to help guiding the eye ...100 Figure 5.6 – Possible (simultaneous) routes of reaction during the biotin functionalization procedure. Upon introduction of the DSU in solution, it may: undergo hydrolyzation of the succinimidyl endgroups (left-hand route), covalently bind to the biotin molecules (through their amine termini) at the succinimidyl endgroups (right-hand route) and/or “just” dissociate the disulfide bonds (middle route). In the cases of initial hydrolysis or initial covalent binding to biotin, the disulfide bond will then dissociate and contribute to the formation of the self-assembled-monolayer. In the case of initial disulfide bond dissociation, the succinimidyl ester groups will then undergo hydrolysis and/or covalently bind to the biotin. In all cases, it is expected that each nanoparticle end up covered with a mixed monolayer of biotin-terminated and hydroxyl-terminated methylene chains...101 Figure 5.7 – Alternative (competitive) routes of reaction of the linker terminal succinimidyl ester groups in a basic buffer. Left-hand side: hydrolysis; Right-hand side: covalent binding to primary amines. Adapted from Grubor et
al., 2004. ...102
Figure 5.8 – Irreversible fusion of the gold cores and/or merging of the methylene chains caused by high centrifugation speeds and times. ...103 Figure 5.9 – High-enough number of hydroxyl groups, at the AuNPs surfaces, produces an electrostatic repulsion effect strong enough to prevent the nanoparticles from precipitating out of solution with lower speeds and centrifugation times...104 Figure 5.10 – Flocculation parameter upon incubating biotinylated nanoparticles with different relative amounts of streptavidin for approximately 400 minutes (close to 7 hours). The plotted values were averaged over triplicates, and are relative to the flocculation parameter values of the “just” biotinylated AuNPs. The line that connects the marks is
an aid to help guiding the eye. ... 104 Figure 5.11 – Left-hand side: SPR peak position variation upon incubating biotinylated nanoparticles with different relative amounts of streptavidin for approximately 400 minutes; Right-hand side: corresponding variation of the absorption intensity at the resonance peak. The lines that connect the marks are an aid to help guiding the eye. .... 105 Figure 5.12 – Red spectrum: stock colloidal AuNPs, as supplied. Green spectrum: biotin-functionalized AuNPs.
Purple spectrum: acquired 7 hours upon mixing streptavidin to the biotinylated nanoparticles, at a
streptavidin-to-nanoparticle ratio of 5:1. Black spectrum: acquired approximately 24 hours upon mixing the streptavidin and left resting overnight. ... 105 Figure 5.13 – Introducing large amounts of streptavidin quickly blocks most or all the available biotin sites on the AuNPs surfaces at initial stages, preventing aggregation. ... 106 Figure 5.14 – Flocculation parameter variation of samples with streptavidin-to-nanoparticle ratios between 3:1 and 16:1. (The lines that connect the marks are just an aid to guide the eye.) ... 111 Figure 5.15 - Continuous lines: flocculation parameter variation of samples with streptavidin-to-nanoparticle ratios above 16:1 and below 3:1. Dashed lines: flocculation parameter variation along time of control samples. Four types of specificity control experiments were performed: BSA (Bovine Serum Albumin) was mixed in a solution of biotinylated AuNPs, at a BSA-to-nanoparticle ratio of 5 :1; Milli-Q water containing 0.1% of NaN3 was mixed in a
solution of biotinylated AuNPs, in a volume equal to that of the streptavidin introduced at a ratio of 5 :1; Streptavidin was introduced at ratio of 5:1, in a solution of nanoparticles to which milli-Q water was mixed instead of biotin during the functionalization procedure; Streptavidin was introduced at ratio of 5:1, in a solution of nanoparticles to which BSA was mixed instead of biotin during the functionalization procedure. (The lines that connect the marks are just an aid to guide the eye.) ... 112 Figure 5.16 – Top left-hand plot: comparison of the curves resulting from the fitting Equation 5.9 to the flocculation parameter data from samples with streptavidin-to-nanoparticle ratios between 4:1 and 8:1 presented in Figure 5.14. In the remaining plots: the red-dots are the experimental values averaged over triplicates samples, with the respective standard deviation error bars; continuous lines are plots resulting from the averaged fitting parameters of each triplicate set of samples for each streptavidin-to-nanoparticle ratio; dashed lines are curves of the maximum and minimum fits considering the error resulting from the calculation of the fitting parameters. All fits, produced in OriginLab© 7.5, presented R2 values above 0.98. ... 113 Figure 5.17 – Comparison between the fitting results of both models, with the average of experimental flocculation data from the set of samples with streptavidin-to-nanoparticle ratio of 4:1. Note that the flocculation data was normalized to the maximum value before both fittings, because the diffusion-limited equation may only vary between 0 a 1. ... 113 Figure 5.18 – Variation of the average time constant, τsum, relative to the streptavidin-to-nanoparticles ratio (in the
interval between 4:1 and 8:1. (The line that connect the marks are just an aid to guide the eye.) ... 114 Figure 5.19 – Spectral evolution of a sample of biotinylated AuNPs to which streptavidin was mixed at a streptavidin-to-nanoparticle ratio of 4:1. Spectra were acquired continuously for approximately 16 hours (one spectrum every 20 minutes), without disturbing the sample. Only about 1/3 of the acquired spectra is shown for the sake of clarity. Red spectrum: stock bare AuNPs. Blue spectrum: biotinylated AuNPs before the introduction of streptavidin. Green spectrum: acquired 20 minutes after the introduction of streptavidin. Purple spectrum: acquired 40 minutes after the introduction of streptavidin. ... 115 Figure 5.20 – Variation of optical parameters corresponding spectra in Figure 5.19. Left-hand side: flocculation parameter variation. Middle: resonance peak position variation. Right-hand side: absorption intensity variation at the resonance peak. ... 115 Figure 5.21 – Fitting of the reaction-limited model (Equation 5.9) to the flocculation parameter data retrieved from spectra in Figure 5.19. Fit parameters: bf = 24.9; τsum = 120.4 s; R2 = 0.99. ... 116
Figure 6.1 – Experimental optical setup. LCTF = liquid crystal tunable filter; CCD = charge-coupled-device camera. ... 121 Figure 6.2 – Heating-cooling cycle applied to the quantum dots sample. Initially, the sample was rapidly cooled from room-temperature to 5 ºC, and the first measurement was made approximately 20 minutes after temperature stabilization. The sample was then heated to 45 ºC, in 5 ºC steps, allowing for temperature stabilization for at least 15 minutes in each step before spectra acquisition. The sample was then cooled to 0 ºC and re-heated to 5 ºC, following the same procedures. ... 122 Figure 6.3 – Evolution of the photoluminescence spectra throughout the heating (left-hand side) and cooling
Figure 6.4 – Variation of the optical parameters obtained by Gauss-fitting the spectra in Figure 6.3. All fittings produced correlation factors R2 > 0.99. It was found that: (a) the emission peak shifts to higher wavelengths with increasing temperature, at approximately 0.11 nm/ºC (a value also reported by Liu et al., 2006 and Dai et al, 2007); and (b) the emission intensity decreases linearly with increasing temperature, at approximately 0.38 /ºC. ...124 Figure 6.5 – Marks: experimental data of the variation of the band-gap width as a function of the temperature. Line: Fit of Equation 6.1 to the experimental data (R2 > 0.99) ...125 Figure 6.6 – Photoluminescence spectra evolution of sample-A1, acquired at several times during photo-excitation and resting periods. ...126 Figure 6.7 – Variation of the optical parameters from samples -A1, -B1 and -C1 during photo-excitation (continuous lines) and resting periods (dashed lines). The parameter values were obtained by gauss-fitting the photoluminescence spectra. All fittings produced correlation factors R2 > 0.99. ...127 Figure 6.8 - Photoluminescence spectra of sample-A2, acquired during the time that sample-A1 was under study. ...127 Figure 6.9 – Variation of the optical parameters of samples -A1, -B2 and -C2 during the time that the corresponding photo-excited samples were under study. Parameter values were obtained by gauss-fitting the photoluminescence spectra. All fittings produced correlation factors R2 > 0.99. ...128 Figure 6.10 – Absorption spectra evolution of: (A) sample-A1 and (B) sample-A2. ...128 Figure 6.11 – Variation of the absorption intensity and absorption peak position of samples exposed to long-term photo-excitation (A and B) and of samples kept in dark (C and D). ...129 Figure 6.12 – Representation of theoretically predicted electronic structure of CdSe/ZnS core/shell quantum dots, and proposed exciton decay route. “U” and “L” (on the left) denote the upper and lower states with the same angular momentums and the dashed lines denote optically spin-forbiden states. (Adapted from Jones et al., 2003)). ...131 Figure 6.13 – Emission intensity variation during the two long-term photo-excitation periods of sample-A1. Samples -B1 and -C1, present similar results. ...132
List of abbreviations
AuNP – gold nanoparticle BSA – bovine
cDNA – complementary DNA Cy - cyanine
DMF – Dimethylformamide DNA – deoxyribonucleic acid
dsDNA – double-stranded deoxyribonucleic acid DSU – Dithiobis-succinimydil undecanoate
EDC – 1-Ethyl-3-[3-dimethylaminopropyl]carbodiimide hydrochloride EDL – electrical double layer
EDTA - ethylenediaminetetraacetic acid FWHM – full width at half maximum HA – haemagglutinin
IRIV – Immunopotentiating Reconstituted Influenza Virosome MgCl2 – magnesium chloride
NaCl – Sodium Chloride
NHS – N-hydroxysulfosuccinimide RET – resonance energy transfer SAM – self-assembled-monolayer SH - thiol
SNP – single nucleotide polymorphism SPR – surface plasmon resonance
ssDNA – single-stranded deoxyribonucleic acid Tween-20 - Polysorbate 20
UV – ultraviolet light
1. Introduction
Nanotechnology (defined as the creation and utilization of materials, devices and systems through the control of matter on the nanometer scale) is a recent revolutionary development of science and engineering that is evolving at a very fast pace. It is driven by the desire to fabricate materials with novel and improved properties that are likely to impact virtually all areas of physical and chemical sciences, biological sciences, health sciences, and other interdisciplinary fields of science and engineering. Particularly, one of the major breakthroughs in nanotechnology science lies on the development of nanoparticles-based biomedicine applications. In that context, this dissertation presents studies performed aiming the design and development of nanoparticle-based biosensors.
1.1. Biosensors: a definition
From a general point of view, a biosensor may be defined as a measurement system, operating under the fundamental principles of biological recognition and sensing, consisting in two basic components: (1) a probe with a biological recognition element (the bioreceptor), which should provide the sensor with a high degree of selectivity and sensitivity towards the analyte to be detected and; (2) a transducer, which converts the interaction of the analyte with the bioreceptor into some kind of detectable and/or measurable signal (Vo-Dinh, 2004).
Transduction has been accomplished through a large variety of methods, and biosensors may be classified accordingly to the transduction methods employed. New types of transducers are constantly being developed for use in biosensors but, most forms of transduction can be categorized in one of the following main classes: (1) optical detection methods; (2)
electrochemical detection methods; (3) mass-based detection methods, and (4) voltaic and magnetic. Naturally, each of these main classes contains many different subclasses, creating a large number of possible transduction methods or combinations of methods. (Vo-Dinh, 2004).
Bioreceptors, on their hand, are key elements to the specificity and sensitivity on biosensor-based technologies, given that signal transduction by the biosensor is triggered as a consequence of the interaction of the bioreceptors with the target analyte of interest. The different existing bioreceptors are, at least, as numerous as the different analytes that have been detected in biosensing, and may be classified into five major categories: (1) antibody/antigen, (2) enzymes, (3) nucleic acids/DNA, (4) cellular structures/cells, and (5) biomimetic (Vo-Dinh, 2004).
1.2. Nanoparticles: a definition
Nanoparticles are, by definition, particles where all the three dimensions are at the nanometer scale (ranging from 1 to 100 nm) and are composed of up to 106 atoms (Kreibig et al., 2006). Since their size is intermediate between that of individual atoms and that of the bulk material, typically, these materials show behaviors that are intermediate between that of a macroscopic solid and that of an atomic or molecular system (Schmid, 1994).
Due to smallness of their size, nanoparticles have a very high percentage of surface atoms which translates in surface related properties (chemical and physical) that can be greatly affected if any modification is made in parameters such as: size, size dispersity, structure, chemical composition, particle coverage, particle shape or the dielectric constant of the medium surrounding the nanoparticle (Brust and Kiely, 2002; Schmid and Corain, 2003; Zhang et al., 2003; Schmid et al., 1999; Ratner and Ratner, 2003; Dabbousi et al., 1997; Chan and Nie, 1998; Hines and Guyot-Sionnest, 1996). Therefore, nanoparticles are amenable to ‘‘tuning’’. Furthermore, the range of sizes of nanoparticles is comparable to that of the biomolecules encountered at the cellular level, which facilitates the development of biosensors that can probe, for instance, proteins, antibodies or DNA.
Their distinct properties and the fact that nowadays nanoparticles may be controllably synthesized in variety of materials (such as: gold, silver, platinum, iridium, palladium, iron oxide, etc.) and shapes (such as: spherical, triangular, cubical, pentagonal, rod-shaped, shells, ellipsoidal and so forth) allows them to find a large variety of applications in a number of fields
such as electronics (Thelander et al., 2001), chemical (Darbha et al.,2008) and biological sensors (Simonian et al.,2005; Montmeat et al., 2003; Pingarrón et al., 2008; Stringer et al., 2008), biotechnology (Cui et al., 2005; Liu et al., 2008; Dobrovolskaia et al., 2009) and medicine (Huang et al., 2005; Visaria et al., 2006; Nath et al., 2008), just to mention few.
On the current work, two types of spherical nanoparticles were addressed aiming biosensing applications, where biorecognition signals are transduced colorimetrically: gold nanoparticles (applications in chapters 3, 4 and 5) and semiconductor quantum dots (chapter 6). The following sections 1.3 and 1.4, detail the main characterizing properties of these two types of nanoparticles.
1.3. Gold Nanoparticles
Up until now, a variety of bio-functionalized metal nanoparticles has been produced and investigated for their potential applications in the biological field. From within those investigations, gold nanoparticles (AuNPs) have emerged as favorites in biomedical, biosensing, imaging and therapy applications owing to their biocompatibility, dimensions, ease of characterization and very high chemical reactivity at the nanometer scale, allowing surface modification reactions with a wide variety of chemical and biochemical vectors (Kell et al., 2005; Xue et al., 2005).
1.3.1. Surface Plasmon Resonance
Presently, it is widely recognized that both structural and electronic properties of solid state matter change as the samples sizes are diminished down to the nanometer scale. For instance, if a metal particle with bulk properties is reduced to a size of a few dozen or a few hundred atoms, the density of states in both the valence and conductions bands decreases to such an extent that electronic properties of the particles change dramatically. The justification is that, in a bulky metal, electrons are highly delocalized (least confined), because there is no separation between the valence and conduction bands (Figure 1.1a), which renders metals their conducting properties. As the size of the metal is decreased, the continuous density of electronic states in its band structure changes until, at small enough sizes, it is finally broken into discrete energy levels. At an initial “shrinking” stage, the electronic motion confinement produces a separation between the valence and the conduction bands such that the metal becomes a semiconductor
(Figure 1.1b). Even smaller particle sizes imply higher electronic confinement, increasing even further the separation of the energetic levels, which results on the formation well-defined bonding and anti-bonding molecular orbitals, and the material becomes an insulator (Figure 1.1c) (Tan et al., 2004).
Figure 1.1 - Illustration of the typical band structure of: (a) metal particle with bulk properties, (b) a large cluster of cubic close-packed atoms, and (c) a simple tri-atomic cluster. c.b. = conduction band; v.b. = valence band. (Adapted from: Schmid, 1992).
By decreasing the metal particle size below the electron mean-free-path (the average distance each electron travels between scattering collisions with the lattice centers in a bulk material), the conduction electrons in the metal become “not-free” (or confined). Hence, during their random motion, electrons are backscattered in the particle surfaces after penetrating into the potential barrier created by the unsaturated chemical bonds of the superficial metal atoms. Due to their extremely high densities and high levels of interactions, these confined electrons may be considered as members of a strongly coupled Fermi liquid (Kreibig et al., 2006). Hence, they act collectively when experiencing an incident electric field, with an additional “in-phase motion” superimposing to the random individual movements of the electrons in the plasma. This leads to a dipole excitation across the nanoparticle due to the periodic “elongation” of the electron density beyond the surface defined by the outermost ions (Figure 1.2), giving rise to the appearance of a restoring Coulomb force that makes the electrons oscillate collectively with a particular time period – the so called “surface plasmon resonance” (SPR) – which results in intensive optical extinction of near-UV and visible light (Kreibig and Quinten, 2004; Ghosh and Pal, 2007).
bulk nanoparticle molecule
c.b. v.b. c.b. v.b. c.b. v.b. band gap
Figure 1.2 – Scheme illustrating the oscillation of the surface plasmon dipole. The electric field of an incoming light wave induces a polarization of the (free) conduction electrons with respect to the much heavier ionic core of a spherical AuNP. The net charge difference occurs only at the nanoparticle surfaces, and act as restoring force. Consequently, a dipolar oscillation of the plasmon electrons is created with period Τ. (Adapted from: Link and El-Sayed, 2000).
According to Mulvaney (Mulvany, 2001), in dilute dispersions, the surface plasmon absorption band of spherical nanoparticles much smaller than the wavelength of the incident light may be predicted by Equation 1.1, relating the amount of light scattered and/or absorbed by a particle in a certain solution with the properties of both the particle and the solvent.
= 24 ( ′ + 2 ") + " Equation 1.1
Here, is the wavelength of the incident light, R is the particle radius, is the dielectric function of the medium in which the nanoparticles are dispersed, and and are the real and imaginary parts the particle’s complex dielectric function, given by = + = ( + ) , where = is the refraction index and k is the absorption coefficient (Pérez-Luna et al., 2004). If “free” electrons are considered (6s electrons of the conduction band in the case of gold), the real and imaginary parts of this function are given by:
′ = − +
Equation 1.2
" = ( + )
Equation 1.3
where ∞ is the high frequency dielectric constant due to interband and core transitions, is the + + + + + + +
- - -
-light el ect ric fie ld t t + T/2 + + + + + + +
--
- -
-incident radiation frequency, is the bulk plasma frequency, and is the damping frequency given by:
=
Equation 1.4
where is the velocity of free electrons at the Fermi energy and Rbulk is the mean free path of
the conduction electrons. Thus, if nanoparticles and/or solvent properties change, so does their complex dielectric function, producing the corresponding alterations on the surface plasmon absorption band as given by Cext.
Experimentally, it has been observed that within each metal type, the position and magnitude of the surface plasmon absorption band depends critically of three major factors (Link and El-Sayed, 1999; Templeton et al., 2000; Rechberger et al.; 2003; Su et al., 2003; Swanson and Billard, 2003): (1) the size and shape of the particles; (2) the dielectric properties of particles and solvent; and (3) inter-particle interactions.
As the nanoparticles radii become smaller than the electrons mean-free-path (R < Rbulk),
the mean-free-path becomes a function of the nanoparticle size (Rbulk ∝ R). Changing the
electrons mean-free-path will affect the damping frequency, , and consequently . Particularly, when = − (and is small enough), Equation 1.1 predicts the existence of an extinction peak, whose position is strongly affected by the particle size (Mulvany, 2001; Baker and Pradhan, 2004). This prediction is experimentally verified and the SPR peak is observed to shift to higher energies as the particle size decreases (Figure 1.3A). However, decreasing the particle size also decreases the absorption intensity, until it is practically unidentifiable for particles of effective diameter less than 2 nm (Alvarez et al., 1997). Additionally, experience has shown that the optical absorption profile depends also very sensitively on the particles shapes (Tan et al., 2004). For instance, while a spherical AuNP presents one SPR peak around 520 nm, elongated nanoparticles (nanorods) exhibit two plasmon resonances: one transverse and the other longitudinal (Figure 1.3B). The transverse plasmon results from the dipole oscillation across the nanorod diameter and is similar to plasmon resonances in spherical gold colloids, showing an extinction peak around 520 nm. The longitudinal plasmon, on its hand, derives from the dipole oscillation along the nanorod length
and results in an extinction peak that is tunable from the visible through the near-infrared by adapting the nanorods aspect ratio (Liao and Hafner, 2005).
Figure 1.3 – (A) UV-Vis absorption spectra of 9, 22, 48 and 99 nm diameter AuNPs in water. All spectra are normalized at their absorption maxima, which are 517, 521, 533 and 575 nm, respectively. (B) UV-Vis spectra of gold nanorods with aspect ratios of (a) 1.5, (b) 2.0 and (c) 2.5. (Adapted from: Link and El-Sayed, 1999; Todera et
al., 2009)
Equation 1.1, predicts also a variation on the extinction coefficient if there is a change of the dielectric properties of the medium in which the nanoparticles are embedded. Figure 1.4 shows that the SPR peak shifts to higher wavelengths and increases intensity with the increase of the refraction index of the medium (Pérez-Luna et al., 2004).
Figure 1.4 – Simulated optical absorption spectra for 10 nm AuNPs embedded in media with εm = 1.0. 1.77, 2.0 and 2.5. (Adapted from: Pérez-Luna et al., 2004).
Additionally, the optical properties of AuNP solutions depend strongly on the degree of interaction between the individual particles. When the density of nanoparticles is large, each particle will be subject to an average polarization field due to the surrounding particles and, hence, an effective dielectric constant should be considered (Pérez-Luna et al., 2004):
A B
=
1 + 2 3 1 − 3 =
1 + 2 Λ
1 − Λ Equation 1.5
where N is the number density of nanoparticles, ε0 is the dielectric constant of vacuum, =
/ is the filling factor, = [( − ) ( + ⁄ )] is the polarizability of a
small spherical particle in a static electric field and
Λ = + 2 − =3 Equation 1.6
is the Maxwell-Garnet formula. In this context, the extinction cross section is given by:
=4 0.5 − , + , + , Equation 1.7
Considering even the simplest case of a pair of spherical nanoparticles with small enough center-to-center separation (D), the surface plasmon resonances are observed to differ significantly from those of isolated particles due to mutually induced dipoles. The oscillating electrons in one particle feel the electric field due to the oscillations in a second particle, leading to a coupled plasmon oscillation. In this specific case, two oscillation modes exist: one transversal and one longitudinal (relative to the axis of the pair). The absorption peak corresponding to the transversal-mode shifts to only slightly higher wavelengths as the nanoparticles separation decreases, while longitudinal in-phase oscillations are significantly different from non-interacting particles (Mulvany, 2001; Perez-Luna et al., 2004). The average polarizability of the nanoparticles pair is obtained integrating over all possible orientations of the longitudinal and transversal modes, giving:
Λ =2[(1 − 2 ( ⁄ ) ) + (1 + ( ⁄ ) ) ] Equation 1.8
constant and the absorption can be calculated using equations 1.6 and 1.7, respectively.
Effectively, theoretical and experimental data show that the shift and magnitude of the absorption peak corresponding to the longitudinal-mode decreases exponentially as the particle-pair center-to-center separation increases, dropping to zero at distances greater than around 2.5 times the nanoparticle size (Figure 1.5, Su et al., 2003; Zhong et al., 2004).
Figure 1.5 – (A) Comparison of computer-simulated (⊡ = 72 nm nanoparticles, ⨀ = 84 nm nanoparticles) and experimentally measured (△) resonant wavelength shifts as a function of the gap between two particles. The longitudinal-mode absorption peak-shift decays exponentially with increasing particle spacing, and the decay function is size independent because the shift and the gap are scaled by the wavelength peak and particle size, respectively. Computer simulations were performed using the Discrete Dipole Approximation. (B) Electrodynamic calculations of the extinction spectra variation of a pair of 20 nm diameter AuNPs as a function of the interparticle distance. Inset is the peak shift vs. interparticle distance. Spectra calculated considering the Generalized Multiparticle Mie (GMM) method (Adapted from: Su et al., 2003; Zhong et al., 2004).
In many-particle aggregates, additional resonances are typically observed to appear at even longer wavelengths that may extend into to the near-infrared region of the optical spectrum, depending on the size of the aggregates and the number of nanoparticles in the aggregate. In fact, the absorption spectra profile in these aggregated nanoparticles systems may depend on many factors, including the aggregate morphology (size and shape) and nanoparticle density. Thus, much more complex calculations are needed to model the extinction properties of multiple nanoparticles aggregates (Perez-Luna et al., 2004; Ghosh and Pal, 2007; Yurkin and Hoekstra, 2007).
1.3.2. Synthesis and Functionalization 1.3.2.1. Synthesis
Synthesis is a key issue on the development of AuNPs-based biosensing assays, because it defines very important AuNPs properties such as the solubility in water, morphology, size dispersion, and surface functionalities. A “countless” number of methods has been reported on the synthesis of gold nanoparticles (Daniel and Astruc, 2004). Nevertheless, the most commonly used synthesis methods may be divided in two major groups:
(1) the chemical or electrochemical reduction of a gold(III) precursor compound in the presence of a capping agent; or,
(2) the citrate reduction of HAuCl4 in water, first introduced by Turkevich (Turkevich et al., 1951).
The first strategy relies on the ability of the capping agent to bind to the surfaces of the nanoparticles in formation, limiting its growth beyond a chosen range and stabilizing the colloid in the particular solvent used. Additionally, by selecting the adequate experimental conditions (such as: reducing agent, reaction time, temperature and capping agent) the shape and size of the AuNPs can be finely controlled. Given their strong affinity for gold, thiol-based capping agents have been considered of particular interest in the synthesis of gold nanoparticles, resulting in colloidal solutions with narrow size distributions. However, usually, the nanoparticles produced by these methods are soluble only in organic solvents, requiring a further step for solubilization in water. Another downside of this technique is that, most of the times, a cumbersome exchange of the strongly bound capping agents is required, making this type of AuNPs less versatile for biological applications (Baptista et al., 2007).
Due to its simplicity and high yield, spherical gold nanoparticles for biological applications are prepared mainly through some variation of the Turkevich method. One of the great advantages of synthesizing AuNPs through this method relies on the use of citrate as capping agent. In fact, the citrate ions remaining on the AuNPs surfaces after the synthesis procedures not only contribute for the electrostatic stabilization of the nanoparticles in the colloidal solution (overcoming the van der Walls attraction forces) but, also are easily replaced by other capping agents (such as those thiol-based) bearing appropriate functionalities that allow binding almost any biological analyte of interest (Baptista et al., 2007; Tan et al., 2004).
1.3.2.2. Functionalization
In most of the cases, the development of AuNP-based biosensors demands a crucial step of labeling their surfaces with specific biomolecular recognition capabilities. Subsequently, depending on the particular characteristics of the biosensing system under study, the AuNPs may or may not need to be previously coated with a layer of ligands possessing particular functionalities.
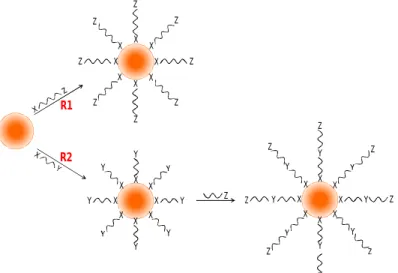
In practice, in most of the cases, the presence of a ligands layer is desirable for introducing a specific functionality on the AuNPs surfaces. Citrate-coated AuNPs, particularly, have been covered with a large variety of ligand types, following a wide range of strategies. Nevertheless, most of the reported methods follow one of the two main routes depicted in Figure 1.6. In route named R1, the biologically-active functional group is introduced in a single-step reaction. This method requires the use of bifunctional ligands composed by a functional group (X) that binds the ligand to the AuNPs surfaces (such as those thiol-based) and by a second functional group (Z) by which the nanoparticles acquire the desired biological functionality (for instance, carboxylic acid based groups). In the alternative functionalization route (named R2), an “intermediary” bifunctional compound (X-Y) is first reacted with the nanoparticles, where the Y-group acts as a coupling site for the desired functionality (Z) being introduced in a second-step reaction.
Naturally, route R1 is preferred whenever possible since it is a one-step reaction only. However, limitations may occur when, for instance, the Z-group is also prone to react with the gold surfaces, resulting in ineffective functional coatings. In such cases, the route R2 is preferred because it introduces a bifunctional ligand with an intermediate Y-group that avoids non-specific interactions during the coating process and, at the same time, can be further reacted to impart the Z-group functionality in the second-step reaction.
Figure 1.6 – Two main routes to attach bio-functional ligands to AuNPs surfaces. R1: ligands with the desired Z functionality react directly with the nanoparticles; R2: a ligand with a Y functionality reacts directly with the nanoparticles and, in a second step, is converted in the desired functionality Z. Notice that both methods may be applied, in principle, both to citrate-coated AuNPs and to AuNPs synthesized with coating ligands; the difference is that, in the later case, the direct attachment of the “primary” ligands is made through a ligand-exchange-reaction (Adapted from: Neouze and Schubert, 2008).
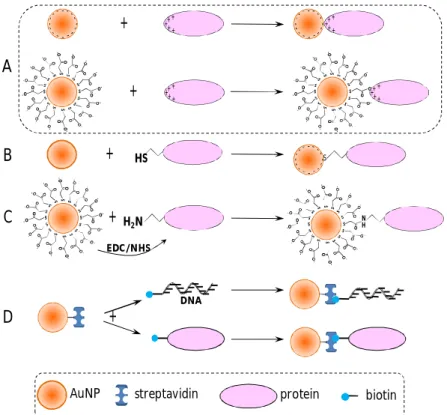
Figure 1.7 presents, schematically, the four most used strategies to attach biomolecular probes are to AuNPs surfaces:
(A) electrostatic interactions between the negatively charged AuNPs surfaces and positively charged biomolecules;
(B) direct covalent-coupling of biomolecules through thiol groups;
(C) covalent coupling of biomolecules to bifunctional ligands previously immobilized on the AuNPs surfaces; and
(D) specific affinity interactions.
Electrostatic adsorption of positively charged biomolecules can be made either directly on the negatively charged surfaces of citrate coated AuNPs or over a negatively charged layer of anionic ligands (such as the carboxylic acid derivatives) (Figure 1.7A). For instance, AuNPs produced by citrate reduction have been functionalized with immunoglobulin G through electrostatic binding between the positively charged amino acid side chains of the protein and the negatively charged citrate groups of the colloids (Shenton et al., 1999). On the other hand, it has been reported the efficient electrostatic immobilization of recombinant esterases onto carboxylic acid coated AuNPs without eliminating their enzymatic activity. (Ha et al., 2005)
X Z Z X Z X X Z Z X X Z Z X X Z X Y Y X X Y Y X X Y Y X X X Z X Y Y X X Y Y X X Y Y X X X Z Z Z Z Z Z Z R1 R2