Minimum period to assess the potential of germination of coffee seeds
1Gabriel Castanheira Guimarães
2, Sttela Dellyzette Veiga Franco da Rosa
3*,
Luis Filipe Serafim Coelho
2, Adriano Delly Veiga
2,
Aline da Consolação Sampaio Clemente
2ABSTRACT – In recent research, early stages of coffee seedling development were identified, after radicle protrusion, in which all the essential parts of the seedling can be assessed to demonstrate the potential of seed germination to generate normal plants. Thus, the objective of this research was to develop studies to reduce the time on the germination test. Ten seed lots of coffee were assessed through the germination test, every two days, from the tenth day of sowing, according to the morphological criteria of the seedlings. The data were compared to the standard germination test and analyzed by means of regression analysis and segmented nonlinear regression and planteau response model. It was concluded that the assessment of coffee seedlings at 16 days, in stage S1, provides the similar result of the pattern germination test, allowing a significant reduction of time in order to demonstrate the germination of the seed lots; the seedling assessment coffee in stage S2 does not have reduction of the time for assessing the coffee germination, in relation to the pattern.
Index terms: Coffea arabica, germination test, segmented nonlinear regression, threshold, response plateau model.
Período mínimo para avaliar o potencial germinativo de sementes de café
RESUMO – Em pesquisas recentes, estádios precoces do desenvolvimento das plântulas de café foram identificados após a protrusão da radícula, em que todas as partes essenciais da plântula podem ser avaliadas, e assim atestam o potencial das sementes em gerar plantas normais. Desta forma, o objetivo nesta pesquisa foi desenvolver estudos para reduzir o período do teste de germinação de sementes de café. Dez lotes de sementes de café foram avaliados por meio do teste de germinação, a cada dois dias, a partir do décimo dia da semeadura, segundo os critérios morfológicos das plântulas. Os dados foram comparados aos do teste padrão de germinação e analisados por meio de análises de regressão não linear segmentada e modelo de resposta em platô. Concluiu-se que a avaliação de plântulas de café aos 16 dias, no estádio S1, proporciona resultados similares ao teste padrão, permitindo redução significativa do período para atestar a germinação de um lote de sementes; a avaliação das plântulas no estádio S2 não permite redução do período de avaliação da germinação de sementes de café em relação ao teste padrão.
Termos para indexação: Coffea arabica, teste de germinação, regressão não linear segmentada, threshold, modelo de resposta em platô.
1Submitted on 12/07/2012. Accepted for publication on 04/08/2013. 2Departamento de Agricultura, Universidade Federal de Lavras (UFLA), Caixa Postal 3037, 37200-000 – Lavras, MG, Brasil.
3Embrapa Café/UFLA, Departamento de Agricultura, UFLA, Caixa Postal 3037, 37200-000 – Lavras, MG, Brasil.
*Corresponding author < [email protected]>
Introduction
A major problem in the production of coffee is spreading plants, which is also made of seedlings originated from seeds. The major drawback of this method is that the coffee seeds have slow and irregular germination, besides low storage
potential, which makes it difficult to obtain seedlings with
desirable standard of quality at the time of planting, besides hindering the assessment of the feasibility and seeds vigor, because of excessive time spent to obtain the results.
The seed germination is the resumption of growth of the
embryonic axis, paralyzed in the final stages of maturation,
occurring in three distinct phases (Bewley and Black, 1994; Marcos-Filho, 2005).
The phases of seed germination and coffee seedlings
growth were identified and described morphologically under
the conditions recommended by the Rules for Seed Testing (Brasil, 2009) in the germination test (Rosa et al., 2010). According to the authors of this work, all essential parts of
a coffee seedling can be identified and assessed in a period
advantageous, according to the authors, in technological,
operational and scientific terms.
The process of coffee germination has been studied (Sales et al., 2003; Braz and Rossetto, 2008), for the time period required for its assessment, 30 days, is considered long, because, when the results are reported, there has been already a variation in the seed quality.
Given the above, the aim of this study is to assess the potential of the early stages of development of coffee seedlings to predict the ability of the seeds to produce normal plants and reduce the test period of germination of this seed species.
Materials and Methods
The experiment was conducted at the Central Laboratory of Seed Analysis of Universidade Federal de Lavras. Ten seed lots of Coffea arabica L. cv. Catuaí Red were used, with different physiological quality levels. The seeds were harvested in the cherry stage, mechanically pulped and had mucilage removed by fermentation in water and then had the endocarps (parchments) manually removed.
Characterization of the seed lots
The seeds without endocarps (parchments) were subjected to the determination of moisture content and germination test before the experiment. The moisture content was performed by the oven method at 105 °C for 24 h, and the results expressed as percentage, in a wet basis (Brasil, 2009).
The germination test was carried out with four replicates of 50 seeds, distributed between germitest-type paper, moistened with water quantity equivalent to 2.5 times the weight of the dry paper and placed in a germination chamber for 30 days at 30 ± 1 °C. Assessments of normal seedlings (N30d) were performed as recommended by the Rules for Seed Testing (Brasil, 2009).
Installation of the experiment
With the purpose of defining the stage in the development of
coffee seedlings for early assessment of the ability of the seeds to produce normal plants under controlled conditions, thus reducing the test period of coffee seeds germination, the ten selected lots were again submitted to the germination test, with assessments every two days during the 30 day period. Assessments were made considering the morphological characteristics of the development stages Seedling 1 (S1), Seedling 2 (S2) and Seedling 3 (S3) described by Rosa et al. (2010). According to this description, in stage S1 the seedlings present radicles shaped like “arrowhead”, which occurs as a result of the enlargement of the region of the junction between the hypocotyl and the main root (neck) caused by the development of the beginnings of
the lateral roots from the pericycle cell. According to the authors, the enlargement of the junction between the hypocotyl and the main root contains an organized series of cells in early stage of differentiation, which will give rise to lateral roots (Figure 1).
Cort
Figure 1. Coffee seedling in stage S1 and appearance of the cell differentiation for the growth of the lateral root. Adapted from Rosa et al. (2010).
In stage S2 were computed the seedlings, where it was possible to visualize the beginnings of the lateral roots at the junction between the hypocotyl and the primary root, and
finally at stage S3 were considered the seedlings with two or
three lateral roots at the junction between the hypocotyl and the primary root, which also had other beginnings of lateral roots.
The results of these assessments were compared statistically to results of the assessments in the germination test (Brasil, 2009).
Experimental design and statistical analyses
The experimental 10 x 11 design was in randomized blocks with four replications in a factorial schematic, being ten lots and eleven assessment periods of the seedlings. The assessments were conducted from the twelfth to the thirtieth day after sowing, totaling 11 assessments dates.
The data was subjected to analyses of variance and mean comparison tests (Scott-Knott, at 5% of probability), which also indicated the assessment periods in which there was a stabilization of the germination process, according to the different assessment criteria of the coffee seedlings. Each variable, obtained at each assessment period and count of the seedlings, was compared to the standard germination test by
means of the Dunnett test, for the significance value of 5%.
To estimate the minimum periods for the assessment of the seedlings, the segmented nonlinear regression model was also used, of response in plateau, which assumes two
segments. The first segment describes an increasing curve
plateau. From this point, the ordinate assumes a constant
value. Confidence intervals were determined to compare each
period corresponding to the morphological stages.
Results and Discussion
There were differences between the ten seed lots regarding the physiological status, which is required in such studies (Table 1).
With respect to the moisture content, there were also marked differences between the lots. These differences were not considered determinant in the germination variations of the lots. This criterion can also be observed in the Rules for Seed Testing (Brasil, 2009), since the requirements do not limit differences in moisture content for the germination test to be performed.
According to the results (Tables 2 and 3), a significant
effect of lots and assessment periods were separately noted, and also the interaction of these factors on the assessments in stages S1, S2 and S3. The percentage of seedlings in stage S1
(Table 2) increased from the first day of assessment, at 10 days
of the sowing, until achieving maximum value, remaining
unchanged and with no significant differences between them
until the last day of the test. Thus, for the ten lots of seeds used, the maximum percentage of seedlings was achieved in the range of 14 to 18 days.
Comparisons between the percentage of seedlings on each day of assessment and at the assessment at 30 days of S3 were also conducted, whose value corresponds to the results of the germination test prescribed by the Rules for Seed Testing (Brasil, 2009), to identify the assessment day when a value statistically equal to the test typically used is obtained. These values were observed on the 14th and 16th days since the percentage of seedlings in stage S1 did not differ from the germination at thirty days (Table 2) (Brasil, 2009).
Table 1. Characterization results of the lots of coffee seeds through the germination test and determination of water content.
Lots Germination (%) Moisture (%)
224 86.0 B* 38.17
228 90.5 A 24.45
245 88.0 B 34.68
253 86.5 B 40.86
254 92.0 A 23.27
256 90.5 A 21.44
263 89.5 B 38.76
266 93.0 A 30.85
267 94.0 A 29.43
285 94.5 A 34.30
*Means followed by the same letter in the column do not differ among themselves by the Scott-Knott test at 5%.
Table 2. Average percentages of seedlings in stage S1, assessed at intervals of two days from the tenth day, from different seed lots of Coffea arabica L.
Stage (1) Assessment
days Lot 224 Lot 228 Lot 245 Lot 253 Lot 254 Lot 256 Lot 263 Lot 266 Lot 267 Lot 285
S1 10 32 b(3)D(2) 18 bC 24 bC 46 bD 19 bC 23 bC 32 bC 25 bD 18 bD 47 bC
S1 12 62 bC 63 bB 66 bB 71 bC 62 bB 66 bB 69 bB 58 bC 53 bC 76 bB
S1 14 75 aB 87 aA 80 aA 81 aB 83 bA 85 aA 82 aA 76 bB 75 bB 89 aA
S1 16 84 aA 89 aA 86 aA 90 aB 92 aA 88 aA 83 aA 87 aA 88 aA 89 aA
S1 18 86 aA 89 aA 86 aA 88 aA 87 aA 88 aA 86 aA 90 aA 87 aA 90 aA
S1 20 91 aA 90 aA 90 aA 89 aA 89 aA 86 aA 90 aA 92 aA 90 aA 92 aA
S1 22 88 aA 93 aA 92 aA 91 aA 91 aA 90 aA 91 aA 93 aA 90 aA 94 aA
S1 24 89 aA 95 aA 92 aA 82 aB 94 aA 99 aA 94 aA 90 aA 93 aA 91 aA
S1 26 91 aA 93 aA 85 aA 82 aB 91 aA 84 aA 87 aA 93 aA 94 aA 95 aA
S1 28 91 aA 95 aA 88 aA 87 aA 90 aA 90 aA 91 aA 93 aA 90 aA 92 aA
S1 30 87 aA 91 aA 88 aA 86 aA 92 aA 90 aA 89 aA 93 aA 94 aA 95 aA
S3 30 86 a 90 a 88 a 86 a 92 a 90 a 89 a 93 a 94 a 94 a
(1) Stages of development of the seedlings of coffee, described by Rosa et al. (2010). (2) Means followed by the same capital letters in columns do not differ among themselves by the Scott-Knott test at 5%. (3) Treatments preceded by equal lowercase letters of the witness (S3), in columns, do not differ from it for the significance value of 5% by the Dunnett test.
For comparisons of the percentage of seedlings in stage S1 using the Scott-Knott test, most lots stabilized on the 14th day after the start of the test, that is, from this day on the
For the comparisons made using Dunnett test (Table 2), it is also noted that at 14 days after the start of the test the lots in stage S1 statistically have the same value as the germination test at 30 days. Only lots 266, 267 and 254 had different results presenting similar results to the test prescribed in the Rules for Seed Testing (Brasil, 2009), only at 16 days.
Observing these results (Table 2) it can be inferred that at 16 days after the start of the test, assessing the seedlings in stage S1, according to characterization proposed by Rosa et al. (2010), all lots stabilized, statistically obtaining the same values at 30 days.
In stage S2, the germination stabilized at 20 days, with no differences in the values obtained in the following days, until the end of the assessment. Only for lots 254, 266 and 285, the stabilization of the percentage of normal seedlings, which reached a maximum germination in stage S2, occurred at 22 days after the start of the test.
Using the Dunnett test to compare the results of the assessments of the seedlings in S2, it was observed that, at 20 days, most lots obtained the same results of the germination test (Table 3). Only lots 254 and 266 obtained similar results to the germination test at 22 days and lot 285 at 18 days.
Table 3. Average percentages of seedlings in stage S2, assessed at intervals of two days from the tenth day, from different seed lots of Coffea arabica L.
Stage (1) Assessment
days Lot 224 Lot 228 Lot 245 Lot 253 Lot 254 Lot 256 Lot 263 Lot 266 Lot 267 Lot 285 S2 10 3 b(3E(2) 1 bE 1 bF 4 bE 0 bF 2 bE 1 bF 0 bE 1 bF 6 bF
S2 12 12 bE 7 bE 14 bE 24 bD 11 bE 8 bE 16 bE 4 bE 5 bF 19 bE
S2 14 29 bD 25 bD 33 bD 41 bC 27 bD 32 bD 33 bD 33 bD 24 bE 38 bD
S2 16 56 bC 42 bC 49 bC 64 bB 55 bC 47 bC 54 bC 42 bD 49 bD 58 bC
S2 18 70 bB 62 bB 68 bB 73 bB 64 bC 66 bB 73 bB 69 bC 66 bC 82 aB
S2 20 82 aA 83 aA 83 aA 82 aA 76 bB 82 aA 82 aA 79 bB 80 aB 82 aB
S2 22 85 aA 90 aA 90 aA 88 aA 88 aA 88 aA 87 aA 90 aA 82 aB 92 aA
S2 24 86 aA 93 aA 90 aA 82 aA 93 aA 86 aA 92 aA 88 aA 90 aA 90 aA
S2 26 89 aA 93 aA 88 aA 82 aA 90 aA 84 aA 85 aA 92 aA 92 aA 94 aA
S2 28 90 aA 94 aA 88 aA 86 aA 90 aA 90 aA 90 aA 93 aA 88 aA 91 aA
S2 30 86 aA 91 aA 88 aA 86 aA 92 aA 90 aA 89 aA 93 aA 94 aA 95 aA
S3 30 86 a 90 a 88 a 86 a 92 a 90 a 89 a 93 a 94 a 94 a
(1) Stages of development of the seedlings of coffee, described by Rosa et al. (2010). (2) Means followed by the same capital letters in columns do not differ among themselves by the Scott-Knott test at 5%. (3) Treatments preceded by equal lowercase letters of the witness (S3), in columns, do not differ from it for the significance value of 5% by the Dunnett test.
For all lots, there were no differences between the percentages of seedlings in stage S1 and the percentage of normal seedlings at 30 days, i.e., the stabilization of the results occurred on the 16th day and the values are statistically equal to the values of the 30th day. Only lot 253 showed different behavior, although, in absolute numbers, the values were not
lower than those determined in the official standards.
Already considering the assessments of the seedlings in stage S2, for all lots, germination stabilized on the 24th day, and from which they no longer showed differences among themselves. Thus, at 24 days are obtained the same results of the germination test at 30 days.
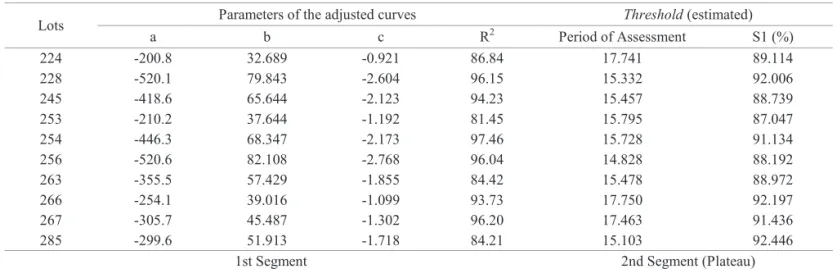
Through nonlinear segmented regressions were performed the adjustments of the assessment results of the seedlings in stages S1 (Figure 2) and S2 (Figure 3), according to the response model in plateau. The model allows the comparison of alternative combinations of curves and plateaus and
chooses, as the best option for adjusting, the combination that has the smallest sum of square of residues. This model
has been used in various applied fields (Paranaíba et al.,
2009; Rosa et al., 2010). From the equations with the highest
correlation coefficients were determined the thresholds (Thres),
i.e., the minimum assessment periods for the stabilization of the process or periods for which the maximum number of seedlings is obtained. According to Webster’s (1989), threshold is the point or moment in any process in which a stimulus
has sufficient intensity to initiate or produce an effect. The estimated parameters of the equations, the coefficients of
determination, as well as the estimate of the minimum periods (thresholds), so that the seeds of the lots reached the maximum percentages in each assessed stage, are shown in Tables 4 and 5. It
is noted that, by the high coefficients of determination, above
0 20
20
40
40
60
60
80
80
100
10 11 12 13 14 15 16 17 18 19 20 21 22 23 24 25 26 27 28 29 30 Assessment Day
(%)
266_Est 266_Obs 266_Thres 266_N30d
Figure 2. Observed (Obs) and estimated (Est) values by nonlinear segmented regression of the percentages of seedlings of Coffea arabica L., in stage S1, of lot 266.
-2020
0 20
20
40
40
60
60
80
80
100
10 11 12 13 14 15 16 17 18 19 20 21 22 23 24 25 26 27 28 29 30
Assessment Day
(%)
228_Est 228_Obs 228_Thres 228_N30d
Figure 3. Observed (Obs) and estimated (Est) values by nonlinear segmented regression of the percentages of seedlings of Coffea arabica L., in stage S2, of lot 228.
The days, during the test performance, in which the counts of the seedling in stages S1 and S2 stabilized, were also estimated using the model. According to the value presented in Table 4, it was found that the stabilization occurred between approximately 14 and 17 days for S1, as was evidenced by the comparisons of the means presented in Table 2. The seed lot
that was briefl y stabilized was 256 and the one that stabilized
later was 266.
Two distinct stages, in the adjusted equations, were found
(Table 4). The fi rst stage in which the percentage of seedlings
which reached stage S1 increases with the days, and the second stage, where the seedlings have already reached the maximum percentage and do not differ by 30 days, represented by the straight line or a plateau.
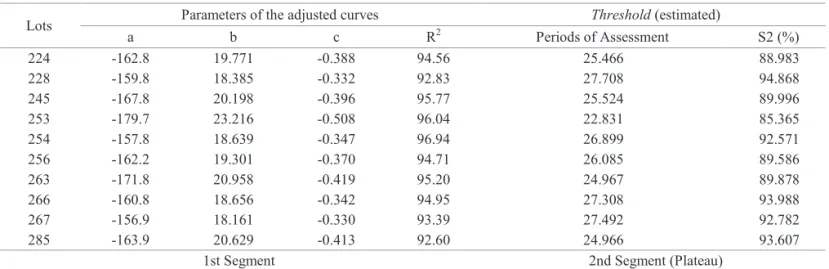
It was found that the percentages of seedlings in stage S2 increase until reaching a maximum value and stabilize (Table 5), indicating that it is not necessary to extend the test to thirty days. It is also found that the later lots stabilized at 27 days after sowing. Therefore, only at 28 days the lots have the same results as in the standard test.
It was found that the model used provided precise
adjustments, with coeffi cients of determination above 90%
(Tables 4 and 5) in relation to the germination data by stages S1 and S2 along the days.
Table 4. Estimates of the segmented nonlinear model parameters with response in plateau of the quadratic regressions (a, b, c),
coeffi cients of determination (R2) and coordinates of thresholds (minimum periods of assessment; percentage of
seedlings in S1 in the plateau) of coffee seeds.
(%)
Assessment Day
100 80 60 40 20 0
10 11 12 13 14 15 16 17 18 19 20 21 22 23 24 25 26 27 28 29 30
10 11 12 13 14 15 16 17 18 19 20 21 22 23 24 25 26 27 28 29 30
(%)
100 80 60 40 20 0 -20
Assessment Day
Lots Parameters of the adjusted curves Threshold (estimated)
a b c R2 Period of Assessment S1 (%)
224 -200.8 32.689 -0.921 86.84 17.741 89.114
228 -520.1 79.843 -2.604 96.15 15.332 92.006
245 -418.6 65.644 -2.123 94.23 15.457 88.739
253 -210.2 37.644 -1.192 81.45 15.795 87.047
254 -446.3 68.347 -2.173 97.46 15.728 91.134
256 -520.6 82.108 -2.768 96.04 14.828 88.192
263 -355.5 57.429 -1.855 84.42 15.478 88.972
266 -254.1 39.016 -1.099 93.73 17.750 92.197
267 -305.7 45.487 -1.302 96.20 17.463 91.436
285 -299.6 51.913 -1.718 84.21 15.103 92.446
1st Segment 2nd Segment (Plateau)
266_Est 266_Obs 266_Thres 266_N30d
228_Est 228_Obs 228_Thres 228_N30d
The reduction of the period for the assessment of the germination in coffee seeds has been investigated by other authors. Reis et al. (2010) estimated the germination of the coffee seeds by soaking in sodium hypochlorite and subsequent observation of the color of the seeds and concluded that the test can be used to assess the germination potential in a fast, accurate, low cost and easy implementation way.
Table 5. Estimates of the segmented nonlinear model parameters with response in plateau of the quadratic regressions (a, b, c),
coefficients of determination (R2) and coordinates of thresholds (minimum periods of assessment; percentage of
seedlings in S2 in the plateau) of coffee seeds.
Lots Parameters of the adjusted curves Threshold (estimated)
a b c R2 Periods of Assessment S2 (%)
224 -162.8 19.771 -0.388 94.56 25.466 88.983
228 -159.8 18.385 -0.332 92.83 27.708 94.868
245 -167.8 20.198 -0.396 95.77 25.524 89.996
253 -179.7 23.216 -0.508 96.04 22.831 85.365
254 -157.8 18.639 -0.347 96.94 26.899 92.571
256 -162.2 19.301 -0.370 94.71 26.085 89.586
263 -171.8 20.958 -0.419 95.20 24.967 89.878
266 -160.8 18.656 -0.342 94.95 27.308 93.988
267 -156.9 18.161 -0.330 93.39 27.492 92.782
285 -163.9 20.629 -0.413 92.60 24.966 93.607
1st Segment 2nd Segment (Plateau)
In this work, by the analysis of all the results obtained, it was found that stage S1 can be considered an alternative to assess and certify the germination potential of coffee seed lots,
with a significant reduction in the period of the test currently
used. In stage S2, the process stabilized next to 28 days, similar to the standard test, which does not provide, therefore, a practical advantage to its use. Stage S1 is characterized by the differentiation of the hypocotyl, which features a distinct pink color of the radicle of white coloration.
Conclusions
The assessment of the germination of coffee seeds can be made at day 16 in S1stage, allowing significant reduction of the period to attest the germination of seeds lots.
The assessment of the coffee seedlings in S2stage does
not allow significant reduction of the assessment period of
coffee germination in relation to the standard test.
References
BEWLEY, J.D.; BLACK, M. Seeds: physiology of development and
germination. New York: Plenum, 1994. 445 p.
BRASIL. Ministério da Agricultura, Pecuária e Abastecimento. Regras para análise de sementes. Ministério da Agricultura, Pecuária e Abastecimento. Secretaria de Defesa Agropecuária. Brasília: MAPA/ ACS, 2009. 395 p. http://www.bs.cca.ufsc.br/publicacoes/regras%20 analise%20sementes.pdf
BRAZ, M.R.S.; ROSSETTO, C.A.V. Condicionamento fisiológico na germinação e no vigor de sementes armazenadas de café. Ciência. Rural, v.38, n.7, p.1849-1856, 2008. http://www.scielo.br/scielo.php?script=sci_ arttext&pid=S0103-84782008000700008& lng=en&nrm=isso
MARCOS-FILHO, J. Fisiologia de sementes de plantas cultivadas. Piracicaba: FEALq, 2005. 495 p.
PARANAÍBA, P.F.; FERREIRA, D.F.; MORAIS, A.R. Tamanho ótimo de parcelas experimentais: Proposição de métodos de estimação. Revista Brasileira de Biometria, v. 27, n. 2, p. 255-268, 2009. http://jaguar.fcav. unesp.br/RME/fasciculos/v27/v27_n2/indice_v27_n2.php
REIS, L.S.; ARAÚJO, E.F.; DIAS, D.C.F.S.; SEDIYAMA, C.S.; MEIRELES, R.C. LERCAFÉ: novo teste para estimar o potencial germinativo de sementes de cafeeiro (Coffea arabica L.). Revista Brasileira de Sementes, v.32, n.1, p.9-16, 2010. http://www.scielo.br/ scielo.php?script=sci_arttext&pid=s0101-31222010000100001 &lang=pt
ROSA, S.D.V.F.; McDONALD, M.B.; VEIGA, A.D.; VILELA, F.L.; FERREIRA, I.A. Staging coffee seedling growth: a rationale for shortening the coffee seed germination test. Seed Science and Technology, v.38, n.2, p.421-431, 2010.http://www.ingentaconnect.com/ content/ista/sst/2010/00000038/00000002/art00015
RUBIM, R.F.; VIEIRA, H.D.; ARAÚJO, E.F.; VIANA, A.P.; COELHO, F.C. Tratamento com hipoclorito de sódio para remoção do pergaminho e aceleração da germinação de sementes de café conilon. Revista Brasileira de Sementes, v.32, n.4, p.88-98, 2010. http://www.scielo. br/scielo.php?script=sci_arttext&pid=S0101-31222010000400010& lng=en&nrm=isso
SALES, J.F.; ALVARENGA, A.A.; OLIVEIRA, J.A.; NOGUEIRA, F.D.; REZENDE, L.C.; SILVA, F.G. Germinação de sementes de café (Coffea arabica L.) submetidas a diferentes concentrações e tempos de embebição em celulase. Ciência e Agrotecnologia, v.27, n.3, p.557-564, 2003. http://www.scielo.br/scielo.php?script=sci_ arttext&pid=S1413-705420030003 00009 &lng=en&nrm=isso