Application of proteomics and cytomics in human neutrophils functional studies
117
0
0
Texto
(2) Dedicated with Love to my wife, Yolanda Virgili And my two mothers, Solange Rosa and Carmem Villa Sola. And in Memory of my Father, João Bezerra Campos Filho. This Dissertation would not have been possible without the timely cooperation from my colleagues, who I would like to take the opportunity to thank individually. They are: Carlos Garcia, Elaine Nascimento, Renan Rodrigues, Pedro Ivo, Nuno Domingos, David Billido, Antonia Odena and my two tutors Wagner Fontes and Eliandre de Oliveira.. 2.
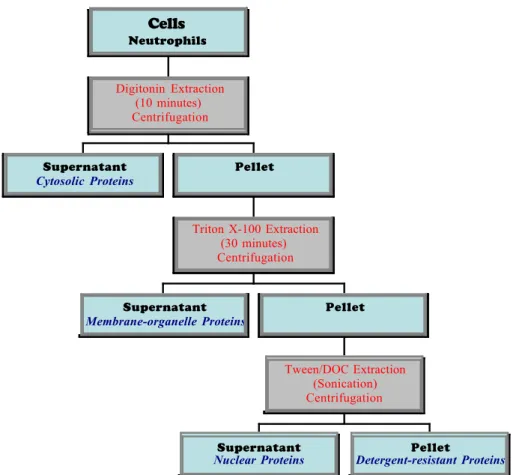
(3) Abstract Biomedical research commonly starts by raising a hypothesis to solve a problem. In this context, scientists select the most appropriate method(s) to answer the question and solve a common dilemma. Over the past decade, we have witnessed a revolution of new technologies in molecular biology – the Omics Science. Highscale technologies such as metabolomics, cytomics, genomics and proteomics are changing the way we study complex biological systems. Current approaches to understanding the functional diversity of an organism preferentially strive for a systems biology approach whereby first the phenotypic classification of a specific cytome is achieved prior to an attempt to perform proteomic analysis. In this context, to better understand the features that involve neutrophil activation and programmed cell death in the pathological and healthy states, this study proposes the integration of cell biology approaches such as flow cytometry with a very robust proteomics platform in an attempt to integrate data at the molecular level with phenotypic data of neutrophils. The application of subcellular fractionation method using digitonin detergent extraction to enrich cytosolic proteins from neutrophils was found reproducible, simple to perform, and inexpensive.. 3.
(4) Contents. Page. 1. Introduction. 06. [1.1] The Neutrophil – an interesting biological puzzle. 06. [1.2] Neutrophil Morphology. 07. a. Azurophil granules b. Peroxidase-negative granules [1.3] Neutrophils in Action. 10. a. Neutrophil cytotoxic arsenal [1.4] The Neutrophil Implication in Pathological Processes. 14. [1.5] Proteomics Technologies – Advances and Caveats. 15. a. Protein Visualization on 2D gels – Staining Procedures b. Differential Gel Electrophoresis (DIGE) c. Gleaning Biological Relevancy through Differential Statistical Analysis d. Mass Spectrometry in Proteomics e. MALDI-TOF Mass Spectrometers f. Mass Spectrometry Proteomics Strategies g. Data Mining in Proteomics h. Neutrophil Proteomics – Lessons from a technical perspective [1.6] Proteomics Meets Cell Biology. 25. a. Neutrophil Proteomics – Lessons from a biological perspective b. Tackling the Proteome Complexity c. Subcellular Proteomics d. Subcellular Fractionation Methods e. Using Detergents to Fractionate Cellular Compartments f. Neutrophil Cell Biology – Lessons from a technical perspective 2. Objectives. 32. 3. Experimental Methods. 33. [3.1] Blood Sample Collection. 33. [3.2] Neutrophil Purification from Blood Centrifugation in Percoll Discontinuous Gradient.. by. Isopycnic 33. [3.3] Neutrophil Priming and Activation. 34. [3.4] Flow Cytometry Acquisition and Analysis. 35. 4.
(5) [3.4] Cytosolic and Membrane/Organelle Proteins Fractionation. 35. [3.5] Preparation of Cytosolic Protein Samples for 2DE.. 36. [3.6] Preparation of Cytosolic and Membrane/Organelle Protein 36 Samples for 1DE. [3.7] Preparation of Total Protein Samples for 4-7 gels.. 36. [3.8] Preparation of Cytosolic and Membrane/Organelles Protein 36 Fractions for 1DE. [3.9] Isoelectric Focusing.. 36. [3.10] Equilibration and 2nd Dimension PAGE.. 37. [3.11] Gel Staining – 1D and 2D gels.. 37. [3.12] Computer-assisted 2-D gel analysis. 38. [3.13] In-gel Digestion of Proteins. 39. [3.14] Protein Identification by Mass Spectrometry. 39. [3.15] Confocal Laser Scanning Microscopy. 40. 4. Results and Discussion. 41. [4.1] Cell Separation by Gradient Centrifugation. 41. [4.2] Assessing Neutrophil Oxidative Burst in Primed and Activated 43 Neutrophils by Flow Cytometry [4.3] Two-dimensional Gel Electrophoresis (2-DE) Analysis – The 46 ‘Divide-and-Conquer’ Workflow [4.4] Subcellular Fractionation of Cytosolic and Plasma Membrane 56 Compartments [4.5] Optimizing Cytosolic Protein Enrichment in Neutrophils. 59. 5. Conclusion. 65. 6. Perspectives. 66. Resume of dissertation in Portuguese. 67. 7. References. 71. 5.
(6) 1. Introduction [1.1] The Neutrophil – an interesting biological puzzle The immune cells are classified into two distinct lineages with specialized cell types required for proper immune response (Fisher, A. 2002). The myeloid lineage of monocytes, macrophages, dendritic cells and neutrophils carries out the innate immune response. The lymphoid lineage of T cells, B cells and natural killer (NK) cells enables adaptive immunity by distinguishing self from non-self antigens and also providing a memory of foreign proteins seen before (Kindt, T. et al., 2002). Other immune cells, such as eosinophils, basophils and mast cells, also participate in the immune response. The human body contains about five liters of blood. Red blood cells constitute about 45% of this volume and white blood cells (WBC) around 1%, the rest being the liquid blood plasma (Diggs, L. 1985). The white blood cells, or leukocytes, can be sub-divided into: lymphocytes, monocytes and granulocytes (Kindt, T. et al., 2002). The former represents the largest group of leukocytes and can themselves be subdivided in neutrophils, eosinophils and basophils (table 1). Circulating neutrophils are terminally differentiated white blood cells presenting a short-life span and characterized by a multilobed nucleus and a granular cytoplasm (fig. 1 and 2e). The latter is due to the presence of specialized granules containing the host-defense molecules, which is rapidly mobilized following an infectious challenge (Faurschou, M. and Borregaard, N. 2003).. Fig. 1: Transmission Electron Micrograph of human neutrophil. Inset is an image taken from a neutrophil 20 s after the phagocytosis of latex particles opsonized with IgG (V, vacuole). The section was stained for myeloperoxidase (MPO) to reveal the. 6.
(7) electron-dense product in the azurophil granules, some of which can be seen degranulating into the phagocytic vacuole (arrows). Bar = 1 µm. (Image from Segal, AW. et al., 1980) Immunologists have long praised the essential role of polymorphonuclear leukocytes, predominantly neutrophils, in the host defense against invading microorganisms. On a per-cell basis, neutrophils make fewer molecules of a given cytokine than do macrophages or lymphocytes, but neutrophils often outnumber mononuclear leukocytes at inflammatory sites by one to two orders of magnitude, and they can therefore be important sources of cytokines such as tumor necrosis factor α (TNFα) at the crucial juncture at which the decision is made to mount an immune response (Nathan, C. 2006). A normal adult produces more than 10 billion neutrophils per day, a figure that can increase as much as tenfold during a period of acute inflammation. The relative abundance of neutrophils, with approximately 50 billion circulating in the bloodstream, and its rapid recruitment to the site of infection make these cells a prominent early player of the innate immune system. Table 1: Cells in Normal Human Adult Peripheral Blood No. per cm3. Cells. Percent of WBC. Diameter (µ m). Platelets. 1-3 x 10⁸. ----. 2-3. Erythrocytes (RBC). 4-6 x 10⁹. ----. 6-8. Leukocytes (WBC). 3-6 x 10⁶. 100%. •. Neutrophils. 2-4 x 10⁶. 50-70%. 10-12. •. Eosinophils. 0.1-5 x 10⁵. 1-3%. 10-12. •. Basophils. 0-0.1 x 10⁶. 0-1%. 8-10. 1-4 x 10⁶. 20-40%. 6-12. 0.2-1 x 10⁶. 1-6%. 12-15. Lymphocytes Monocytes. Source: Diggs LW, et al., (1970). The Morphology of Human Blood Cells, 5th edition. Abbott Laboratories, Abbott Park, IL.. [1.2] Neutrophil Morphology Cell biologists and immunologists have relied mainly on cell morphology to characterize the five different stages of neutrophil differentiation: myeloblast, promyelocyte, myelocyte, banded cells, and segmented cells (fig. 2a-e) (Bainton, D. 1971). Differentiation of myeloblasts into mature neutrophils does not result from a simple state transition; instead, neutrophil differentiation appears to be a multi-step process characterized by the sequential formation of azurophil, specific and gelatinase granules (granulopoiesis) and their constituent granule proteins (Faurschou, M. and Borregaard, N. 2003). The various subsets of granules contained within the neutrophil are key effectors of the neutrophil immune response.. 7.
(8) Fig. 2: Blood films on glass slides of the different stages of neutrophil differentiation stained with a Romanowsky stain. Source: (1) Clinical Chemistry and Hematology Laboratory at the New York State Department of Health - Wadsworth Center; and (2) S.S. Spicer and J.H. Hardin, 1969. Granulopoiesis is initiated in early promyelocytes, when immature transport vesicles bud off from the Golgi and fuse. The resultant early-appearing granule is rich in antibacterial proteins such as elastases, defensins, and myeloperoxidases (MPO), and referred to as “azurophil granules” (or “primary granules”). At the promyelocyte/myelocyte transition, when the production of MPO ceases, peroxidasenegative granules begin its sequential formation. Appearance of “specific granules” (or “secondary granules”) takes place during myelocyte and metamyelocyte stages, and has a high content of lactoferrin; in addition, synthesis of the fMLP receptor and CD11b is initiated at this stage. Gelatinase granules are formed in band and segmented neutrophils, and present a high content of gelatinase (Faurschou, M. and Borregaard, N. 2003). Finally, secretory vesicles containing mainly plasma proteins are formed in segmented neutrophils (Cowland, J. and Borregaard, N. 1999). Secretory vesicles are generated by endocytosis, resulting in membranes rich in receptors, signaling proteins, and adhesion molecules, whereas their lumen contains plasma (Faurschou, M and Borregaard, N. 2003; Lominadze, G. et al., 2005). In conclusion, the proteome of each subpopulation of granules is formed as a consequence of an orchestrated gene expression program, a mechanism known as “targeting by timing” (Borregaard, N. and Cowland, JB. 1997). The overlap between the timing of synthesis of different granular proteins gives rise to some overlap of contents among different granule subsets (Le Cabec, V. et al., 1996). However, although all granule subsets share common features, there are substantial differences 8.
(9) with respect to protein content and the extent of protein release to phagosomes and extracellular environment. Azurophil granules Despite its early recognition as specialised lysosomes, azurophil granules are nowadays probably best regarded as regulated secretory granules (Cieutat, A. et al., 1998). Like lysosomes, azurophil granules contain granulophysin (CD63) in their membrane. However, in contrast to lysosomes, they do not express the lysosomeassociated membrane proteins LAMP-1 and LAMP-2 (Cieutat, A. et al., 1998), and the sorting of proteins to azurophil granules does not involve the mannose-6phosphate receptor system essential for lysosomal enzyme targeting (Dahms, N. et al., 1989; Nauseef, W. et al., 1992). Azurophilic granules are the largest of the human neutrophilic granules, measuring 0.3 µm in diameter (Nüsse, O. and Lindau, M. et al., 1988; Lollike, K. et al., 2002). They are also referred to as primary or peroxidasepositive granules. Each human neutrophil contains 1300 azurophilic granules based on morphological data (Nüsse, O. and Lindau, M. et al., 1988). Based on their time of appearance during myelopoiesis, azurophil granules are often divided into two major subsets, namely early- and late-appearing azurophil granules, which are formed from the beginning of the promyelocytic stage and near the promyeocyte/myelocyte transition, respectively (Sengelov, H. et al., 1993; Arnljots, K. et al., 1998). Azurophil granules contain a highly packed matrix of acid mucopolysaccharide and highly cationic myeloperoxidase. These granules contain the largest number of luminal bactericidal proteins such as the α-defensins and myeloperoxidase (MPO, the iron-containing enzyme that colours pus green.), while there is a paucity of membrane, cytoskeletal, and GTP-binding proteins. Many proteins of azurophil granules are synthesized as proforms, which go through proteolytic trimming on arrival at the granule compartment. This seems to be important to prevent misfolding, autotoxicity or retention of the mature proteins during their passage through the biosynthetic machinery of the cell (Garwicz, D. et al., 1998; Liu, L. and Ganz, T. 1995). After removal of amino-terminal propeptides, the proteins are stored in their active conformations (Lindmark, A. et al., 1998; Garwicz, D. et al., 1998). Peroxidase-negative granules Historically, specific and gelatinase granules have been also designated peroxidase-negative granules (Kjeldsen, L. et al., 1992). Although widely employed, this nomenclature may be misleading since myeloperoxidase has been found in these granule subsets as well (Lominadze, G. et al., 2005). Recently, two independent approaches were used to determine MPO presence in the neutrophil granule subsets. Theilgaard-Monch et al., (2005) found that MPO expression is downregulated during transition from promyelocytes (formation of azurophil granules) to myelocytes/metamyelocytes (formation of specific granules). By peering the microarray data, one can note that MPO expression is not completely abrogated during this transition, whereas transition from myelocytes/metamyelocytes to bone marrow PMNs seems to correlate with complete abrogation of this gene. MPO protein expression in peripheral blood neutrophils has also been assessed by ELISA method (Lominadze, G. et al., 2005). This study showed that 73% of total MPO was present 9.
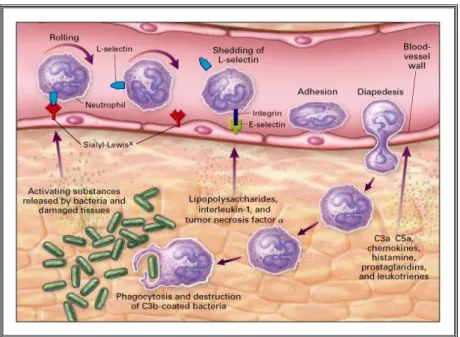
(10) in azurophil granules, 20% was in specific granules, and 7% was in gelatinase granules. Similar distribution has been also reported by Kjeldsen et al., (1994; 1999). However, these studies are not conclusive and absolute quantification has not been carried out to date. Furthermore, this supposedly MPO detection in specific and gelatinase granules may be a result of contamination during granule separation process. Gelatinase granule membranes contain a large number of membrane receptors and adhesion molecules. Therefore, the large amount of actin cytoskeleton and cytoskeletal regulatory proteins in these granules supports its role in enhancing the plasma membrane expression of molecules necessary for neutrophil adherence to and migration through inflamed vascular endothelium. Specific granules contain large amounts of moderately cationic luminal proteins. The greater complexity of the specific granule lumen and the presence of a significant number of transmembrane and membrane-associated proteins suggest that these granules represent a transitional phase that can contribute to neutrophil activation through exocytosis or provide bactericidal proteins to phagosomes. Consistent with this notion, gelatinase and specific granules contain overlapping sets of proteins, which include lactoferrin, lipocalin, lysozyme, LL37, three metalloproteases (MMP8, MMP9 and MMP25), and several other antimicrobial proteins, matrix-degrading enzymes and membrane receptors (Lominadze, G. et al., 2005). From a total of 247 proteins identified from the three granule subsets in a recent study, Lominadze et al., (2005) reported an overlap of 79 proteins between gelatinase and specific granules, but only five proteins overlap between specific and azurophil granules. Moreover, a total of 86 proteins were identified only from gelatinase granules, 28 proteins only from specific granules, and 26 proteins only from azurophil granules. In contrast to azurophil granules, specific granules store proteins as intact proforms.. [1.3] Neutrophils in Action The remarkable capacity of detecting and eradicating invading pathogenic microorganism without destroying self-tissues requires a well-orchestrated innate and adaptive immune response. Activation of immune response with subsequent eradication of microbial pathogens is a complex, multi-step process (fig. 3). As a first step, neutrophils are rapidly recruited from circulation and bone marrow reserves to sites of infection by host and pathogen-derived stimuli (chemotatic factors) such as leukotriene LTB4 (Freeland, H. et al., 1988) platelet-activating factor (PAF) (MenciaHuerta, J. et al., 1983); tumor-necrosis factor α (TNFα) (Williams, C. and Coleman, J. 1995), interleukin-8 (IL-8) (Gordon, J. et al., 1990), N-formylmethionyl-leucylphenylalanine (fMLP) (Le, Y. et al., 2002) and lipopolysaccharide (LPS) (Fessler, M et al., 2002). In addition to recruiting neutrophils, many chemotactic factors, including lipopolysaccharide (LPS), tumor necrosis factor-alpha (TNFα), and platelet-activating factor (PAF), purportedly modulate neutrophil responses to subsequent stimuli, a process known as neutrophil priming. (Brazil, T. et al., 1998) During recruitment and migration to infection focus, neutrophils produce a number of factors to orientate their migration, ensure their survival in the hostile inflammatory milieu, recruit additional neutrophils and ‘inactivate’ their own toxic products (Botha, A. et al., 1995).. 10.
(11) Fig. 3: Multi-step activation process of neutrophils The migration of neutrophils from the blood to target tissues (extravasation) involves tethering and rolling of neutrophils on the blood-vessel wall, firm adhesion and crossing through the endothelial barrier (diapedesis) (Cinamon, G et al., 2001). Adherence of circulating leukocytes to the vascular endothelium is facilitated by the expression of several membrane proteins such as CEA-related cell-adhesion molecules (CEACAMs), selectins, immunoglobulin superfamily members, and integrins. In addition to these classical interactions, other cell-surface-expressed enzymes with catalytic domains outside the plasma membrane - ectoenzymes such as CD26, CD38, and vascular adhesion protein 1 - were recently reported to take part in the different steps of the extravasation cascade (Goding, J. 2000). The adhesive interactions of neutrophils are usually dynamic and transient. In fact, a high degree of flexibility in cell adhesion and mobility should be attained to allow neutrophils to circulate in the blood without pathologically adhering to the vascular wall. Several studies have underscored the importance of a small-scale respiratory burst and granule exocytosis to release certain neutrophil proteases and adhesion molecules as a precondition to neutrophil recruitment to inflammatory loci (Nathan, C et al., 1993; Raptis, SZ et al., 2005). The neutrophil–endothelial interactions have been shown to trigger mobilization of secretory vesicles from neutrophils (Borregaard, N et al., 1994). Secretory vesicles are mobilized at the earliest phases of the neutrophil-mediated inflammatory response in response to a wide variety of inflammatory stimuli (Faurschou, M and Borregaard, N. 2003; Lominadze, G et al., 2005). These vesicles constitute a reservoir of membrane-associated receptors including the β2-integrin CD11b/CD18 (Mac-1, CR3), the complement receptor 1 (CR1), receptors for formylated bacterial peptides (formylmethionyl-leucylphenylalanine (fMLP)-receptors), the LPS/lipoteichoic acid-receptor CD14, the FcγIII receptor CD16, and the metalloprotease leukolysin, all of which are incorporated in the plasma membrane after exocytosis. The disassembly of extracellular matrix is believed to be crucial for neutrophil extravasation and migration, and to facilitate the neutrophil-bacterial contact (Borregaard, N. and Cowland, J. 1997; Owen, C. and Campbell, E. 1999; Kang, T. et 11.
(12) al., 2001). The release of reactive oxygen species such as hydrogen peroxide, hypohalites and chloramines activates matrix metalloproteinases (MMPs), and inactivates protease inhibitors (Henson, P. and Johnston, R. 1987; Weiss, S. 1989). MMPs play fundamental roles in a wide range of mammalian physiological and pathological processes by degrading major structural components of the extracellular matrix including collagens, fibronectin, proteoglycans, laminin and gelatin. Neutrophil cytotoxic arsenal Neutrophils have been long praised as a crucial line of defense against bacterial infections because of their rapid release of a potent arsenal of cytotoxic agents that can be mechanistically divided into oxygen-dependent or oxygenindependent. The latter encompasses the contents of the three neutrophil granule subsets and the secretory vesicles, whereas the former stems from the ‘oxidative burst’, which takes place after NADPH oxidase complex assembles at the phagosomal or cellular membranes. Production of reactive oxygen species (ROS) as well as proteases and its subsequent release by neutrophils are stringently controlled to protect surrounding cells and tissues. However, overwhelming and protracted neutrophil activation at sites of infection can ensue in damage to healthy tissue as well (Brown, K. et al., 2006; Nathan, C. 2006; Parsey, M. 1998; Weiss, S. 1989; Henson, P. and Johnston, R. 1987; Holman, J. and Seba, T. 1988). To optimize defense capabilities while minimizing damage to host tissues, neutrophil responses must be spatially and temporally regulated. Thus, later in the inflammatory process, neutrophils undergo to a drastic functional switch to generate signals to retard their own accumulation; to suppress their own activation; to attract and program other immune cells such as macrophages and lymphocytes; and to promote their own death. Human neutrophils contain three types of granules and the secretory vesicles that are mobilized (exocytosis) hierarchically during neutrophil extravasation from the bloodstream to the site of inflammation (Sengeløv, H. et al., 1995; Borregaard, N. and Cowland, J. 1997). The exocytosis of neutrophil granules is a meticulously orchestrated sequence of events triggered by bacterial and host molecules such as cytokines. Therefore, exocytosis gradually changes the functional state of the neutrophil, and is crucial for effective killing of invading microorganisms. The different neutrophil granules containing antimicrobial proteins can discharge their contents either into the phagosome or into the extracellular media. The secretory vesicles, the gelatinase granules (also known as tertiary granules), and the specific granules (also known as secondary granules) function as easily accessible reservoirs of various receptors, whereas azurophilic granules (also known as primary granules) are thought to primarily fuse with the phagosome (fig. 4). In neutrophils, nicotinamide adenine dinucleotide phosphate (NADPH) oxidase acts as a multicomponent enzyme complex that generates relatively large amounts of superoxide anion (~2 nmol/min per 106 neutrophils) (Babior, B. 1999; Lambeth, J. et al., 2000; Babior, B et al., 2002) and other secondarily derived ROS. Reactive oxygen species (ROS) and their derivatives products generated by neutrophils during respiratory burst include superoxide, singlet oxygen, ozone, hydrogen peroxide, hypohalous acids, chloramines and hydroxyl radicals (Klebanoff, S. 2005) (fig. 4). The role of ROS in immunity is believed to be mainly microbicidal, although. 12.
(13) controversial reports have come into light in the last years (Reeves, E. et al., 2002). In contrast to many signal transduction systems in which agonist-induced transcription of genes initiates a vigorous biochemical cellular response, the NADPH oxidase is spatially regulated, whereby the dormant oxidase is maintained in an inactive state by partitioning the components into a cytoplasmic fraction, and a membrane-bound flavocytochrome b558. The latter is a stable heterodimer composed of the p22phox and gp91phox subunits, which is localized both in the plasma membrane (around 5%) and in the membranes of mobilizable intracellular granules (around 95%) in the rest neutrophils (Borregaard, N. et al., 1983; Sengeløv, H et al., 1992). The cytoplasmic phox components exist as a complex (Mr 250kDa) stabilized through multiple SH3domain-mediated interactions of its factors, p47phox, p67phox, p40phox, the small regulatory GTPases Rac2 and Cdc42, and the newly identified p29 peroxiredoxin. Upon neutrophil stimulation, several serine residues within the polybasic region of p47phox become phosphorylated resulting in a conformational change in p47phox, unfolding the protein and exposing the now interactive SH3 domains of p47phox to eventually interact stably with proline-rich regions (PRRs) on the cytoplasmic tail of p22phox (Nagasawa, T. et al., 2003), thereby resulting in translocation to the membrane and activity of a functional oxidase (Shiose, A. and Sumimoto, H. 2000).. Fig. 4: Oxygen-dependent and oxygen-independent mechanisms of neutrophil defense. The reactivity between ROS and proteins has been investigated in the past years leading to the postulation that ROS partake in several cell signaling events (Nathan, C. 2003). Hydrogen peroxide (H2O2) was shown to convert free L-tyrosine in the human blood plasma to tyrosyl radical, which may react with tyrosine residues of target proteins to produce o,o’-dityrosine bonds (Heinecke, J. et al., 1993; Marquez, L. and Dunford, H. 1995; Jacob, J. et al., 1996). Peroxynitrite and HOCl can also give rise to the formation of chlorotyrosine and dityrosine, respectively (Hazen, S. et al., 1997; Kettle, A. 1996; Pfeiffer, S. et al., 2000). These protein modifications have been associated with organ dysfunction in several diseases (Heinecke, J. 2002). A recent study showed that human neutrophils can moduate their proteome via a tyrosine oxidation pathway induced by pro-inflammatory mediators. In addition, upon neutrophil stimulation with TNFα, IFNγ or PMA, a limited number of membrane-associated proteins became tyrosylated (Avram, D. et al., 2004). ROS. 13.
(14) has been also shown to mediate temporary inactivation of tyrosine phosphatases by reversible oxidation of their active-site cysteine sulphydryls (Tonks, N. 2005). The ability of neutrophils to ingest and kill microorganisms is crucial to innate immunity and host defense. Phagocytosis is an inherently complex process that requires phagocyte-microbe contact and is accompanied by activation of signaling pathways that orchestrate rearrangement of the actin cytoskeleton, extension of the plasma membrane, and engulfment. Neutrophil-microbe contact is initiated via a plethora of membrane receptors ‘provided’ by the aforementioned fusion of secretory vesicles, gelatinase and specific granules with the plasma membrane during the exocytosis process. Azurophilic and specific granules fuse with the phagocytic vacuole after microbe uptake (Segal, A. et al., 1980). It has been estimated that the granule protein makes up about 40% of the vacuolar volume (Hampton, M. et al., 1998), which gives a concentration of about 0.5 g ml-1 (Reeves, E. et al., 2002). The phagosome volume depends on the size of the engulfed microbe, but will also increase dramatically over time. In vitro, the phagosome volume increases about 3fold over 15 min in neutrophils (Reeves, E. et al., 2002), and this increase is mostly attributable to the addition of specific granule contents, which are already present in 50% of phagosomes within 30 seconds after ingestion of bacteria (Bainton, D. 1973), and later of azurophil granule contents. Fusion of specific granules adds 0.26 fl and azurophilic granules add another 0.92 fl to the phagosome, which together would triple its volume if it started out at 0.6 fl. These estimates are based on the dimensions and numbers of granules in neutrophils, 4600 specific granules 0.13 µm in diameter and 1300 azurophilic granules 0.3 µm in diameter (Nüsse, O. and Lindau, M. 1988), and the assumption that all granules fuse with the first 20 phagosomes, which seems a reasonable synthesis of several observations (Hampton, M. et al., 1998; Bainton, D. 1973). It is also important to note that multiple phagosomes may coalesce, forming much larger structures (Bainton, D. 1973).. [1.4] The Neutrophil Implication in Pathological Processes Overwhelming neutrophil activation has been suggested to play a major role in several inflammatory-related disease such as the pathogenesis of organ dysfunction in sepsis (Brown, K. et al., 2006). Such premise has been the subject of intense scrutiny in the last years, as researchers have sought to develop efficient therapies to control neutrophil-mediated healthy tissue damage in septic patients. Although limiting the inflammatory response attributable to neutrophils appears to represent a promising avenue for therapeutic intervention in sepsis (Abraham, E. 2003), neutrophils are essential components in the activation of innate immune response for detection and eradication of invading pathogenic microorganisms. Evidence to support a pivotal role of neutrophils in sepsis-induced organ dysfunction derives from both experimental models and clinical studies. Postmortem pathological examination of specimens from septic patients with multiple organ failure reveals neutrophil infiltrations in compromised organs (Nuytinck, H. et al., 1998; Thijs, A. and Thijs, L. 1998; Brealey, D. and Singer, M. 2000). The extent of neutrophil infiltrates correlates with impaired lung function and with high concentrations of neutrophil-derived proteolytic enzymes in the bronchoalveolar lavage from patients with acute respiratory distress syndrome (ARDS), a severe form of acute lung injury that may be associated with sepsis (Windsor, A. 1993; Ware, L. and Matthay, M. 2000; Steinberg, K. et al., 1994; Adams, J. et al., 2001). 14.
(15) Experimental interventions that deplete or inhibit the activity of neutrophils attenuated organ dysfunction and improved survival in animal models (Nathens, A. et al., 1997; Abraham, E. 2003). These findings concur with clinical observations in patients with systemic inflammatory response where removal of blood neutrophils (by leucodepletion filters) enhances respiratory and renal function (Treacher, D. et al., 2001). Moreover, neutrophils retrieved from both lungs and blood of patients with sepsis exhibit increased production of ROS (Baldwin, S. et al., 1986); delayed apoptosis (Matute-Bello, G. and Liles, W. 1997; Feterowski, C. et al., 2001); and increased predisposition to endothelial binding as evidenced by increased expression of β2 integrins (Brown, K. et al., 2001; Chollet-Martin, S. et al., 1996). Neutrophil turnover is a healthy and critical mechanism to dampen local tissue destruction, diminish further inflammation and recruitment of immune cells, and facilitate termination of the innate immune response by limiting pro-inflammatory capacity (Matute-Bello, G. and Liles, W. 1997; Feterowski, C. et al., 2001).. [1.5] Proteomics Technologies – Advances and Caveats Proteomics defined in its most broad terms is the understanding of the protein expressed from biological compartments such as cell, tissue, or organisms in term of identification, quantify, post-translational modification, protein–protein interaction, sub-cellular localization activities and their biological functions. The introduction of novel protein separation techniques (Gorg, A. et al., 2004; Washburn, M. et al., 2001), the advent of mass spectrometers with higher mass accuracy, dynamic range and resolution (Shevchenko, A. et al., 2000; Medzihradszky, K. 2000; Wilm, M. and Mann, M. 1996; Wilm, M. et al., 1996; Syka, J. et al., 2004), the improvement of computational data analysis tools (Clauser, K. et al., 1999; Creasy, D. and Cottrell, J. 2002; Mann, M. and Wilm, M. 1994) and the proliferation of genomic and proteomic databases (Henzel, W. et al., 1989; Mann, M. et al., 1994; Pappin, D. et al., 1993; Yates, J. et al., 1993; Lander, E. et al., 2001) are likely the main reasons for the increase in number and size of proteomic datasets. However, it has become evident that proteins are much more complex, diverse and dynamic than was originally anticipated (Aerbersold, R. and Mann, M. 2003); and despite the technological advances, there are important biological and technological caveats in proteomic analysis of complex material such as biological samples. Several different protein prefractionation techniques can be combined with various analytical techniques. Gel-based methods such as one-dimensional and twodimensional polyacrylamide gel electrophoresis (1D-PAGE and 2D-PAGE or 2-DE, respectively) are arguably the most popular and versatile methods of protein separation. Gel-independent approaches focus mainly on chromatographic separation techniques in combination with fast and sensitive MS. Two-dimensional polyacrylamide gel electrophoresis (2-DE) combines isoelectric focusing (IEF), which separates proteins according to their isoelectric point (pI), and sodium dodecyl sulfate-polyacrylamide gel electrophoresis (SDS-PAGE), which separates them further according to their molecular mass. In an electric field, a protein will migrate toward the pH region on the IPG strip in which the pH equals its isoelectric point. After the first dimension separation, the IPG strip is laid atop the second dimension polyacrylamide sodium dodecyl sulfate gel (SDS-PAGE), and the proteins are run in an orthogonal direction, to achieve separation by size of fully. 15.
(16) unfolded, SDS coated protein molecules. The major steps of the 2-DE-based proteomics workflow include: (i) sample preparation and protein solubilization; (ii) protein separation by 2-DE; (iii) protein detection and quantitation; (iv) computerassisted analysis of 2-DE patterns; and (v) protein identification usually by mass spectrometry (Gork, A. et al., 2004). Sample preparation for 2D gel electrophoresis can be divided into three basic steps, namely cell disruption, inactivation or removal of interfering substances, and solubilization of the proteins. Protein extraction is a crucial step in any proteomics strategy because of its influence in yield, biological activity, and the structural integrity of the specific target protein. Several techniques for cell disruption are available such as osmotic lysis, freeze- thaw cycling, detergent lysis, enzymatic lysis of the cell wall, sonication, grinding with (or without) liquid nitrogen, high pressure (e.g. French press), homogenization with glass beads and a bead beater, nitrogen cavitation, or a rotating blade homogenizer. Neutrophil cell membranes are weak and thus easily disrupted by gentle treatment with mild detergents. This is best accomplished by using lower concentrations of a nonionic detergent such as Triton X100. Detergents also prevent hydrophobic interactions between the hydrophobic protein domains; hence, avoiding loss of proteins due to aggregation and precipitation. The most common interfering compounds in sample preparation are proteolytic enzymes, salts, lipids, nucleic acids, polysaccharides, and/ or highly abundant proteins. Salt ions may interfere with electrophoretic separation and should be removed if their concentration is too high (>100 mM). Salt increases the conductivity of the IEF gel, thereby prolonging the time required to reach the steady-state. High amounts of lipids may interact with detergent and thus reduce its effectiveness. Lipids can also form complexes with proteins, reducing its solubility. The presence of polysaccharides and nucleic acids can result in poor focusing in the acidic region of the IEF gel, and obstruction of the pores of the polyacrylamide gels due to an increase in the viscosity of the solutions. To assure protein solubilization, 2D electrophoresis sample buffer usually contain reducing agents and high concentrations of chaotropes. The chaotropes urea and thiourea are often used at concentrations of 7 M and 2M, respectively. The former is quite efficient in disrupting hydrogen bonds, leading to protein unfolding and denaturation. Nevertheless, it has been shown that hydrophobic interactions are more efficiently broken by thiourea (Rabilloud, T. et al., 1997). Due to its poor solubility in water, thiourea is used in concentrated urea solutions to increase its solubility. Reducing agents are necessary for cleavage of intra- and intermolecular disulfide bonds to achieve complete protein unfolding. The most commonly used reductants are DTT or dithioerythritol (DTE) are commonly used at concentrations ranging from 20 mM to 100 mM. A disadvantage of these agents is that in a pH between 8.5 and 9, they are ionized and behave as a weak acid; and therefore, run short in the alkaline gel area due to migration to the anode during IEF. Last but not the least, many cell types, particularly the neutrophils, have a powerful arsenal of proteases stored in their organelles/granules. Hence, these proteases must be inactivated to prevent protein degradation that otherwise may result in artifactual spots and loss of high Mr proteins. To prevent proteolysis of sample proteins, protease inhibitors are usually added to lysis buffers. Two-dimensional PAGE delivers a map of intact proteins, which reflects 16.
(17) changes in protein expression level, isoforms or posttranslational modifications (PTMs). Depending on the gel size and pH gradient used, 2-DE can theoretically resolve more than 5,000 proteins simultaneously (~1,000 proteins routinely). Nonetheless, there is well-justified concern about the overall reproducibility of 2-DE when it is used as the sole method to identify qualitative and quantitative differences in protein expression in samples of interest (Horgan, G. 2007; Campostrini, N. et al., 2005). In addition, 2DE-based approaches are biased against membrane proteins, low abundance proteins, and proteins at the extremes of isoelectric point and molecular mass (Pedersen, S. 2002; Rabilloud, T. 2003; Helling, S. et al., 2006). For example, Lominadze et al., found that the presence of large amounts of basic proteins in neutrophil granules produced poor isoelectric focalization. To overcome these limitations, several strategies have been employed in the past years to increase the number and certainty of the protein identifications. One example of such proteomics platform is the multidimensional protein identification technology [MUDPIT] (Washburn, M. et al., 2001), which combines peptide separation by strong cation exchange and reverse phase two-dimensional chromatography, followed by identification by mass spectrometry. Protein Visualization on 2D gels – Staining Procedures Several detection methods are widely used for protein visualization in polyacrilamide gels that use labels that are fixed to the protein molecules. In general, visualization dyes and procedures can be divided into three major categories: (1) detection by light absorption of organinc dyes such as Coomassie Brilliant Blue; (2) detection by fluorescence of fluorescent probes such as Sypro dyes or CyDyes; and (3) metal ions permit protein visualization either by differential salt binding (e.g. reverse staining with zinc-imidazole) or by metal ion reduction such as silver stains (Simpson, R. 2003). The latter has gained wide popularity because of its excellent sensitivity (in the low nanogram range), flexibility (can be completed in a time range from 2 h to 1 d), and mass spectrometry compatibility. Silver staining was first introduced in 1979 by Switzer et al.,; however, issues related to background, dynamic range and reproducibility resulted in many improvements of the original protocol. By 1994, Rabilloud et al., (Rabilloud, T. et al., 1994) found more than 100 different silver staining protocols in the literature. The principle of silver staining is straightforward. Silver ions bind to proteins and, under appropriate conditions, are reduced to elementary Ag developing a visible image typically in brownish-grey-black color (Rabilloud, T. et al., 1994). Despite its wide use, silver staining is somewhat tricky. Unlike staining with organic dyes, silver staining goes against general thermodynamics. Proteins bind silver ions, and this binding decreases the reactivity of the ions, which leads to the formation of the commonly observed 'hollow' or 'doughnut' spots (Chevallet, M. 2006). Moreover, silver ions bind preferentially to basic amino acids of proteins; hence, it may cause a higher affinity of basic proteins for silver ions decreasing the staining linearity. Silver staining methods have been reported to be linear over a 40-fold range in protein concentration depending on certain physical-chemical properties of a given protein (Merril, C. et al., 1984). In general, depending on the silver impregnation, the silver staining methods can be divided into simple silver nitrate or silver-ammonia. The former is relatively simple and compatible with mass spectrometry; in addition, it presents good 17.
(18) consistency. Basic proteins are less efficiently stained than acidic ones with this type of stain (Rabilloud, T. 1999). Silver-ammonia stains are more sensitive than silver nitrate stains, in the range of 2-4 ng (Simpson, R. 2003). In contrast to simple silver stains, ammonical silver stains basic proteins more efficiently than acidic ones (Rabilloud, T. 1999). Differential Gel Electrophoresis (DIGE) Many of the disadvantages and shortcomings of 2D electrophoresis (2DE) have been overcome by 2D difference gel electrophoresis (DIGE) (Unlu, M. et al., 1997). This technology uses three spectrally distinct fluorescent cyanine dyes (CyDyes - Cy2, Cy3, and Cy5) that match in charge and mass (Viswanathan, S. et al., 2006). Hence, up to three samples can be differentially labeled and then run together on a single 2D polyacrylamide gel. The generated protein map of each sample labeled with different CyDye DIGE fluors can then be visualized separately by imaging (scanning) the gel at CyDye-specific excitation wavelengths. A CyDye fluor generates a digital image of the proteomic pattern in an individual sample that is then compared to the other samples (CyDye images) in the same gel by DeCyder differential analysis software (from Amersham). Each CyDye DIGE fluor minimal dye has an NHS-ester reactive group, which covalently attaches to protein amino-termini and the epsilon amino group of lysine residues in proteins via an amide linkage (Marouga, R. et al., 2005). The relatively high lysine content of most proteins makes this amino acid suitable for this labeling strategy, in which very small amounts of dye are used. In addition, it has been reported that only 3–5% of the total protein present in the sample is labeled. When bound to a lysine residue, the single positive charge on the CyDye DIGE fluor minimal dyes replaces the single positive charge present in lysine at neutral or acidic pH, thus ensuring that the pI of the protein is not significantly altered. In addition, the dyes are size-matched, adding approximately 500 Da to the labeled protein. Consequently, the same protein labeled with any of these dyes will migrate to the same position on a 2D gel. The CyDye fluor minimal dyes are highly sensitive – Cy2 = 0.075 ng, Cy3 = 0.025 ng, and Cy5 = 0.025 ng – than silver staining (~1 ng). In contrast to silver staining, CyDyes have a high dynamic range resulting in more reliable quantification of protein spots than that obtained using standard colorimetric staining methods. Overall, the use of CyDye fluor dyes has the ability to substantially reduce the effects of gel-to-gel variation on the quantification of a protein spot on a gel, increasing therefore, the confidence that a difference in fluorescence intensity between two samples is due to biological rather than experimental variation (Marouga, R. et al., 2005; Gharbi, S. et al., 2002). This greater quantitative accuracy is enabled by the ability to multiplexing, and the possibility to use an internal standard. The latter consists in pooling equal amounts of each biological sample in the experiment, and labeling it with one of the CyDye DIGE fluor dyes, usually the Cy2 for minimal labeling. The internal standard is then run on every single gel along with each individual sample labeled. The advantages of using an internal pooled standard for 2D gel electrophoresis have been described in the literature (Alban, A. et al., 2003; Friedman, D. et al., 2004; Knowles, M. et al., 2003). Most notably, every protein from all samples will be represented in the internal standard. Hence, the abundance of each protein spot on a gel can be measured relatively to its corresponding spot in the internal standard present on the same gel. In addition to accurate quantitation, this 18.
(19) strategy enables partition of experimental variation from inherent biological variation. Gleaning Biological Relevancy through Differential Statistical Analysis The aim of the differential analysis is to detect the proteins whose abundance differs according to the condition. The detection of differences in protein abundance in most cases relies on a statistical procedure that compares the differences of observed spot volumes. In statistical terms, this means to test simultaneously a large number of hypotheses – for each spot, we have to test the hypothesis that the spot volume does not differ according to the condition. In this context, the experimental design must properly estimate whether the variability in spot volume come from the biological and technical variation. Statistical analysis to detect differential expression among 2D gels usually begin with filtering out interesting protein spots whose volume difference between two conditions is significant with a type I error cutoff predefined at α = 5%. The statistical testing procedure consists of choosing a test statistic and deciding if the hypothesis is rejected or not. In general, two approaches may be employed – Spot-by-spot and Global approaches. The former approach (also referred to as Univariate analysis) is based on the data observed for the spot ‘s’ only, whereas the latter approach (also known as Multivariate analysis) is based on the results of an analysis of variance considering all the observations together. The spot by spot analysis is commonly available in several software packages used for 2D gel image analysis. Because univariate statistical analyses, such as the Student’s t-test and the analysis of variance test (ANOVA), treat each individual variable independently, they cannot easily capture information about correlated trends. In addition, a large number of replications is necessary since this type of analysis uses information coming from only one spot. In the spot by spot analysis, we assume that the volumes of the spots within an experiment are distributed as Gaussian independent variables with mean and variance. To test the variance of given spot, the mean of such spot within a given condition should be compared to the mean in other conditions. Non-parametric tests such as the Mann–Whitney (or Kolmogorov) test can be quite handy in gel analysis since it does not need to assume Gaussian distribution. The Mann–Whitney test consists in testing the degree of ‘similarity’ of the distributions function among the observations of spot ‘s’ under a given condition. This test is based on the ranks of the observations rather than on the observations. As with the aforementioned Gaussian-dependent univariate tests, the Mann–Whitney test lacks power when the number of observations is small; thus, a minimum of seven replications by condition has been recommended (Meunier, B. et al., 2005). Alternatively to the use of univariate analyses for 2DE analysis, the use of multivariate statistics and pattern recognitions techniques consider a group of variables together rather than focusing on only one variable at a time; in other words, it uses information from all the data for testing each hypothesis. The Multivariate approaches include dimension reduction methods, such as principal components analysis (PCA), partial least squares (PLS), hierarchical cluster analysis, linear discriminate analysis, multivariate analysis of variance (MANOVA), and machine learning methods, such as self-organizing maps including neural nets, genetic programming, and support vector machines. Multivariate techniques in general cope better with “ long and lean” data sets, where the number of experiments is very much. 19.
(20) smaller than the number of variables (e.g., proteins). Such multivariate approaches are also robust to random variation and experimental error in the system, multi colinearity (where variables may appear to be collinear as a result of the size of the matrix) and a degree of missing data. It is important to keep in mind that multivariate and machine learning methods can still have problems with long lean datasets, and thus any model produced must be tested by robust cross validation using a ‘train and test’ procedure. The past decade has brought stunning achievements in genome technology, and consequently data analysis; most notably, the partnership among bioinformaticians, statistician biologists to develop tools for gene expression analysis by microarrays. Although the microarray scientific community has achieved great advances in the field of differential analysis of gene regulation, proteomics researchers still struggle to analyze 2D gels. Albeit feasible, the use of statistical tools made available by the microarray community is not straightforward for 2DE analysis. One reason is that the 2DE data present a greater variability due to the complexity of the image analysis (Dowsey, A. et al., 2003). Moreover, the number of replication is generally small, while the number of missing data may be way too large, up to 50–60% (Roy, A. et al., 2003). Successful application of microarray data analysis methods in 2DE data comes from the use of false discovery rate (FDR) methods such as significance analysis of microarray (SAM) to correct the observed significance levels (Meunier, B. et al., 2005). In another application, Kim Kultima and collaborators (Kultima, K. et al., 2006) have adapted a microarray-based permutation test (Subramanian, A. et al., 2005; Tian, L. et al., 2005) to produce cut-off levels for finding differentially expressed proteins, namely DEPPS (Differential Expression in Predefined Protein Sets). Mass Spectrometry in Proteomics During the past two decades, mass spectrometry (MS) has increasingly become the method of choice for analysis of complex protein samples, particularly for protein identification, peptide sequencing, identification and location of post-translational modifications of proteins (Aerbersold, R. and Mann, M. 2003). Mass spectrometry can provide information about specific protein structural modifications without a priori knowledge of the modification. The term MS encompasses a wide range of very different methods of analysis, each with its own unique characteristics. However, all mass spectrometers have certain features (components) in common: an ionization source, a mass analyzer and a detector (Aerbersold, R. and Mann, M. 2003). The ionization source is the region of the instrument in which the sample of interest is ionized, with a positive or negative charge, and then desorbed into the gas phase. The mass analyzer is where the gas phase ions created in the source region are guided through the instrument to the detector, where their mass-to-charge (m/z) ratio is measured (Mann, M. et al., 2001). The primary function of a mass spectrometer is to separate charge-bearing molecules according to molecular mass and to measure their mass numbers. These measurements are carried out in the gas phase on ionized analytes rather than molecules because mass separation relies on the properties of charged particles moving under the influence of electric and magnetic fields, usually in high vacuum. 20.
(21) where the mean free path is sufficient to ensure that they mostly travel without collisions. Ions may be positively or negatively charged, although most mass spectrometric experiments are performed on positive ions. Positive ions can be formed either by removal of one or more electrons from each molecule or by the addition of one or more cations (Gross, J. 2004). A charged species that is formed by the removal or attachment of an electron is referred to as a molecular ion, whereas ionization that is achieved by addition or removal of a charged atom or molecule such as H+ or NH4+ gives a species that is termed a quasi-molecular ion. (Todd, J. 1991). Most often, proteins are ionized by addition of a H+ and then analyzed by mass spectrometry. As ions are actually analyzed in the vacuum of the mass spectrometer, arguably the most important reaction in MS is the one that converts analytes of interest into gas-phase ions. A fundamental problem in biological mass spectrometry was how to transfer highly polar, completely non-volatile molecules with a mass of tens of kDa into the gas phase without destroying them. This problem was solved by the advent of 'soft' ionization techniques such as matrix-assisted laser desorption/ionization (MALDI) (Karas, M. et al., 1988) and electrospray ionization (ESI) (reviewed in Fenn, J. 2003). These techniques have indeed revolutionized biological mass spectrometry and now account for virtually all applications of MS for the analysis of peptides and proteins (Yates, J. 1998), DNA and RNA (Gross, J. et al., 2000). Soft ionization methods transfer less vibrational energy and form ions having lower internal energies as compared to electron ionization. MALDI is a solid-state sputtering/desorption method that produces ions by laser bombardment of crystals containing a small amount of analyte mixed with a large excess of ultraviolet-absorbing matrix, which is normally a low-molecularweight aromatic acid (Gross, J. 2004). On irradiation with a pulsed laser beam of the appropriate wavelength, the excess matrix molecules sublime and transfer the embedded non-volatile analyte molecules into the gas phase. Most commercially available MALDI instruments employ a nitrogen laser that gives 3-ns length pulses at a frequency of 337.1 nm (Mann, M. et al., 2001). Whether the analyte is preionized in the solid state or becomes ionized in the plume, perhaps by excited state proton transfer, has not been yet established (Zenobi, R. and Knochenmuss, R. 1998). Ions formed by MALDI have higher internal energies than those from ESI, and the desorption process helps free the analyte ions from undesirable impurities, just as it frees them from the matrix. When carried out in high vacuum and at high accelerating voltage, the pulsed nature of laser radiation produces ions in pulses that are well suited to Time-of-Flight (TOF) analysis (Baldwin, M. 2005). Compared with ESI, MALDI ionization appears to be relatively inefficient since ESI adds protons to all the basic sites in the analyte molecules, whereas the ions observed from MALDI are typically only singly charged. It is reasonable to conclude that either most analyte molecules remain uncharged or the ions become neutralized in MALDI and, therefore, do not contribute to the mass spectrum. However, in most applications, MALDI ions are formed in a high vacuum and with high kinetic energies, so they are transmitted through the mass spectrometer with high efficiency, whereas ESI ions are formed at atmospheric pressure and many are lost in the transfer to the vacuum system of the mass analyzer (Gross, J. 2004). In addition, MALDI is almost always used with TOF analysis, which maximizes the sensitivity of detection (Mann, M. et al., 2001).. 21.
(22) A major advantage of MALDI is its high level of sensitivity, often providing data from sub-femtomole (< 1 x 10-15 moles) amounts of sampling loading, can be observed in the MALDI-TOF setting (Baldwin, M. 2005). Another significant advantage of using MALDI for limited quantities of sample is the ability to study the sample for as long as a sufficient portion remains on a target. Another favorable practical attribute of MALDI lies in its relatively high tolerance to salts and buffers. Unlike ESI, ions can be formed by MALDI from samples that contain physiological levels of salts (Baldwin, M. 2005). Although MALDI has significant advantages, it also has some drawbacks. The first caveat comes from the sample preparation strategies, which are quite heterogeneous. Thus, it is often necessary to identify a ‘‘sweet spot’’ among the crystals to obtain the best spectra. In addition, the presence of a matrix causes a large degree of chemical noise, which hurdles the analysis of samples with low molecular weights by MALDI (Karas, M. et al., 1988). MALDI-TOF Mass Spectrometers Conceptually, the principle of linear time-of-flight (TOF) mass spectrometer is straightforward and probably the simplest compared to other mass analyzers. In TOF analysis, ions being pulsed into a TOF drift tube by an accelerating potential (for example, 1–20 kV) results in ion velocities that are inversely proportional to the square root of m/z (Gross, J. 2004). For a nitrogen laser, the pulses have a half-width of 3 ns, so all ions are formed within this short period. As all the ions with same charge obtain the same kinetic energy after acceleration, the lower m/z ions achieve higher velocities than the higher m/z ions. After the ions are accelerated, they travel through a fixed distance (typically 0.5–2.0 meters) before striking the detector. Typical flight times are tens of microseconds, so the length of the initial pulse is relatively insignificant. Thus, by measuring the time it takes to reach the detector after the ion is formed, the m/z of the ion can be determined. In practice, TOF offers mass resolution in the thousands and mass accuracies in the tens of parts per million (ppm) (Strupat, K. 2005). A common issue frequently seen in the early MALDI-TOF instruments was the scattering and dissociation of many ions during acceleration, with consequent broadening of the mass spectral peaks, as these ions were accelerated as soon as they were desorbed by the laser pulse in the ion source. To overcome this problem, delayed ion extraction (DE) was introduced in the 1990s in order to compensate for the initial velocity distribution (Vestal, M. et al., 2000) of MALDI-produced ions (Juhasz et al.,, 1997). In delayed extraction, a grid is placed in front of the MALDI target, and by applying a high potential to both the target and the grid, an initial desorption occurs in a field-free region. In general, the ions of interest are heavy and slow-moving, whereas most of the neutrals are relatively light molecules formed by thermolysis of the matrix and can diffuse away rapidly. After a delay period of perhaps 100 ns, the grid voltage is instantaneously reduced, causing the ions to be accelerated into the drift tube of the mass spectrometer, experiencing fewer collisions (Strupat, K. 2005). In a linear TOF, ions of a single mass accelerated through the same potential should all have the same flight time and should arrive at the detector simultaneously. In practice, the kinetic energy imparted by the accelerating voltage is superimposed upon a range of energies arising from the laser desorption process (Strupat, K. 2005). To improve performance of TOF instruments, a series of electrostatic mirrors, namely 22.
(23) reflectron placed at the far end of the drift tube is commonly used (Mann, M. et al., 2001). The reflectron provides a linear potential gradient from ground to just above the accelerating voltage, which slows the ions and then reverses their direction of flight, accelerating them back toward a detector situated at a slightly offset angle. The fastest ions penetrate further into the reflectron and travel a longer distance before reaching the detector than the slowest ions. Through a suitable choice of geometry, it is possible to have all ions of each unique mass arriving at the detector simultaneously, even though they have slightly different velocities. Therefore, the purpose of the reflectron is to compensate for small differences in the velocities of ions with the same m/z. These differences in velocity are caused by a number of different factors, but are inherent in the experiment. Therefore, the reflectron increases the resolution of TOF spectrometry. The reflectron is predominantly used to analyze smaller species such as peptides, for which increased resolution and more accurate mass measurements represent a substantial advantage (Clauser, K. et al., 1999). The state-of-the-art MALDI–TOF instruments are normally equipped with both a linear and a reflector port, and with the possibility for delayed ion extraction in the MALDI source. In particular, with the combination of the DE source, calibration and the reflectron, modern high-performance MALDI-TOF instruments easily attain an resolution power of 10,000 or more for peptides in the mass range up to 5000 Da (Vestal, M. et al., 2005), and allows mass measurements to be made with an accuracy of 10 to 50 ppm (0.01 Da to 0.05 Da in 1000 Da) or better. Such a high mass accuracy dramatically increases the specificity of database interrogation, and identification of proteins can be achieved unambiguously if at least five peptide masses are determined with better than 50 ppm accuracy (Clauser, K. et al., 1999, Jensen, O. et al., 1996; Shevchenko, A. et al., 1996). In general, MALDI-TOF is used for the analysis of simple peptide mixtures, such as the peptide obtained from an interest of single spot that separated on 2DE. Mass Spectrometry Proteomics Strategies There are two main approaches to characterizing proteins by mass spectrometry: bottom up and top down (Sze, S. et al., 2002). In the former approach, proteins present in biological samples are enzymatically digested, peptide fragments are detected by MS, and information about the protein identity and modifications is assembled from the peptide data. Although peptides can be easily analyzed by MS, digested samples are quite complex making bottom-up approaches limited by this complexity. In practice, few peptides are detected per protein identification in bottomup approaches; hence, a large portion of the protein sequence remains undetected. On the other hand, the top-down approaches to protein analysis by MS assay native proteins. Although the collision‐induced dissociation (CID) techniques that readily give sequence information for peptide ions are generally not applicable to species as large as intact protein ions, the fragmentation mechanisms of electron‐capture dissociation (ECD) and electron‐transfer dissociation (ETD) make direct protein sequencing a realistic possibility (Horn, D. et al., 2000). Here, the attachment of a low thermal energy electron to one of the positive charges in a multiply charged ion with a recombination energy of about 6 eV gives a radical ion that will rapidly fragment before energy equilibration occurs. Such species are classified as distonic ions because the charge and radical sites are distinct from each other. As in the. 23.
(24) well‐known radical cation reactions of species formed by electron impact, alpha‐cleavage occurs not at the site of the charge but one bond removed, giving predominant c‐ and z‐ions for cleavage between the amide nitrogen and the α-carbon. This differs from CID techniques normally used in bottom-down approaches that predominantly produce b‐ and y‐type ions. Data Mining in Proteomics Bioinformatics tools play a fundamental role in proteomics studies enabling the analyses of complex sample and organization of the data in a useful biological context. In the past decade or so, several websites and software have been created to help the proteomics community to better interpret, automate and organize proteomics data. Two dimensional gel databases allow researchers to examine into any region of 2D gel and seek a desired pattern with the corresponding MW and pI scale. Some examples of 2D gel databases include the SWISS-2DPAGE, WORLD-2DPAGE (http://www.expasy.ch/ch2d/2d-index.html) and 2DWG Image Meta-database (http://www-lecb.ncifcrf.gov/2dwgDB). Protein identification by mass spectrometry relies very much on bioinformatics. Firstly, experimentally collected MS data must be interrogated against proteins and/or genes databases in order to generate the most likely protein identity. There are three different approaches to identify proteins using mass spectrometry data. In the first method, peptide mass fingerprint (PMF), the molecular weights of the peptides resulting from digestion of a protein by a specific enzyme are used to interrogate the database for possible matches (Wilkins, M. et al., 1998). In the second method, a sequence query is performed using MS data comprising of mass values combined with amino acid sequence. Last but not the least, MS/MS ion from one or more peptide is used to search the database and find matches (Clauser, K. et al., 1999). Some of the protein databases and existing software for protein identification by PMF, sequence query and MS/MS ions are liste on table 2. Neutrophil Proteomics – Lessons from a technical perspective As proteomics remains a rapidly developing field with many different experimental approaches and different ways of searching and interpreting the data, a large variability in protein identifications across studies is not a surprising feature given the lack of experimental reproducibility and standards in the field. Additionally, the proteomic databases mainly contain information on the most abundant, techniquebiased separable proteins, whereas low abundance, difficult-to-separate proteins such as regulatory signaling proteins, hydrophobic transmembrane receptors and basic nuclear proteins are usually under-represented in most proteomic studies. These limitations pose one of the main hurdles in proteomics, namely impractical interlaboratory data comparison. Given the enormous proteomic complexity, it is likely that no individual technology would have the capability to tackle the complexity of the human proteome single handedly. Different analytical platforms may target different protein and peptide subsets and thus integration of results from a diversity of platforms is more likely to give a full picture (Hanash, S. and Celis, J. 2002; Omenn, G. et al., 2005).. 24.
(25) Table 2: Most commonly used software for protein identification by peptide mass fingerprint (PMF), sequence query and MS/MS ions. MS data. Websites. PMF Mascot. http://www.matrixscience.com/search_form_select.html. MS-FIT prospector. http://prospector.ucsf.edu/ucsfhtml4.0/msfit.htm. PeptideSearch. http://www.mann.embl-heidelberg.de. ProFound. http://bioinformatics.genomicsolutions.com/service/prowl/ profound.html. PeptIdent. http://us.expasy.org/tools/peptident.html. ProteinLynx. http://www.waters.com. IonIQ. http://www.proteomesystems.com. Sequence query Mascot. http://www.matrixscience.com/search_form_select.html. MS-Seq prospector. http://prospector.ucsf.edu/ucsfhtml4.0/msseq.htm. Multident (TagIdent). http://www.expasy.or/tools/multildent/. PeptideSearch. http://www.mann.embl-heidelberg.de. PepSea. http://www.unb.br/cbsp/paginiciais/pepseaseqtag.htm. MS/MS ions Mascot. http://www.matrixscience.com/search_form_select.html. MS-Tag prospector. http://prospector.ucsf.edu/ucsfhtml4.0/mstagfd.htm. Omssa. http://pubchem.ncbi.nlm.nih.gov/omssa/index.htm. Phenyx. http://www.phenyx-ms.com. X!Tandem. http://thegpm.org/TANDEM/index.html. Sequest. http://www.thermo.com. PepFrag (Prowl). http://prowl.rockefeller.edu/PROWL/pepfragch.html. GutenTag. http://fields.scripps.edu/GutenTag/index.html. 25.
(26) [1.6] Proteomics Meets Cell Biology Proteomics can be applied in a hypothesis-free fashion to generate data used to elucidate protein function and regulation in the cellular context. The translation from genome to proteome is highly desirable to provide insights into the functional level of the cytome (Human Cytome Project, www.cytomics.info); that is, the study of molecular single cell phenotypes that results from the genotype and the environmental condition. The driving force for integrating cytomics into proteomics is the need to generate pure populations of cells from highly heterogeneous biological mixtures. In addition, acquiring additional layers of information from the cells being analyzed by proteomics can provide a better understanding of protein function pos-data analysis. Neutrophil Proteomics – Lessons from a biological perspective Reports on immune cell proteomics are dated as early as 1982 when Gemmell and Anderson (Gemmell, M. and Anderson, NL. 1982) separated the three major components of the leukocyte population (lymphocytes, monocytes, and granulocytes) and subjected them to 2-D gel electrophoresis. At the same time Willard et al., (Willard, K. et al., 1982) undertook one of the first attempts to find disease biomarkers in patients with rheumatoid arthritis, and carried out a 2-D PAGE analysis of leukocyte proteins. Proteomic analysis of neutrophils has been reported in human, bovine and rat. Kasper et al., used 2-D PAGE to compare the proteomic profile of neutrophils from healthy donors and patients with severe chronic neutropenia. Using analysis tools available back then, the authors were able to identify by internal sequencing one protein that was overexpressed in disease, tropomyosin (Kasper, B. et al., 1997). By combining two-dimensional gel electrophoresis (2-DE) and mass spectrometry, Boussac and Garin identified a limited number of proteins secreted by neutrophils in a calcium-dependent manner (Boussac, M. and Garin, J. 2000). Piubelli et al., took a similar 2-DE-MS approach to identify 52 major protein spots in rat neutrophils including multiple post-translational modifications of the same protein (Piubelli, C. et al., 2002). The proteome of neutrophils was also analyzed following LPS challenge and compared with unstimulated neutrophils by 2-DE and proteins identified by MS (Fessler, M. et al., 2002). This study yielded a list of up-regulated modulators of inflammation, signaling molecules, and cytoskeletal proteins. The same approach was later on used to profile proteomic changes in neutrophils of rats chronically treated with nicotine (Piubelli, C. et al., 2005). A technically different approach, one-dimensional gel electrophoresis followed by LC-MS/MS, was employed by Lippolis and Reinhardt (2005) to identify over 250 proteins from bovine neutrophils. Recently, two groups have applied a subcellular fractionation approach to identify novel granule proteins in neutrophils (Lominadze, G. et al., 2005) and to better understand the dynamics of phagosome maturation in these cells (Burlak, C. et al., 2006). The former analyzed subcellular fractions of neutrophils enriched for azurophil, specific and gelatinase granules, separated in a Percoll discontinuous gradient. Using two independent proteomic platforms (2D PAGE-MS and 2D HLPC ESI-MS/MS), these authors identified 286 proteins on the three granule subsets assigned to various functional gene categories, including kinases and phosphatases, transporters, structural proteins, signal transducers, host defense and enzymes.. 26.
(27) Burlak and coworkers purified neutrophil phagosomes containing latex beads and identified more than 198 unique proteins (excluding protein isoforms and subunits translated from the same gene) associated with the phagosome by twodimensional electrophoresis and mass spectrometry (Burlak, C. et al., 2006). This study reported the identification of many proteins not previously known to be associated with phagosomes, as well as many novel proteins. In a similar approach, macrophage phagosomes containing latex beads were purified and more than 140 proteins associated with the phagosome were identified by similar proteomic techniques (Desjardins et al., M. 2003). Tackling the Proteome Complexity One of the major hurdles associated with proteomic analysis of complex samples is the high dynamic range of proteins, which may be on the order of 106-1011 depending on the biological source (e.g., cells [Corthals, G. et al., 2000], plasma [Anderson, N.L. and Anderson, N.G. 2002], bronchoalveolar lavage fluid [Wattiez, R. and Falmagne, P. 2005] and cerebrospinal fluid [Hu, Y. et al., 2005]). These figures are at least three orders of magnitude beyond any proteomic analytical method (e.g., 2D gel, mass spectrometry, liquid chromatrography). The complexity becomes such that identification of low-abundance proteins are inevitably masked by those expressed in high abundance (Patterson, S.D. and Aebersold, R.H. 2003). Since most of the regulatory proteins such as kinases, GTPases and certain membrane receptors are present in low copy numbers, important layers of information are missing from studies of whole cell proteomics. Another important shortcoming in proteomic analysis is regarded to the size of the proteome. Despite a relatively modest number (~25,000) of putative protein-coding genes (Lander, E. et al., 2001) and the total number of gene products present in any given cell to be estimated around 10,000, the effective number is likely to be several fold higher owing to splice variants and the wide variety of possible post-translational modifications (Huber, L. 2003). The combination of large-scale proteomics studies with traditional cellbiology techniques, a strategy known as Subcellular Fractionation (or Organelle Proteomics, or Subcellular Proteomics), has provided an interesting means to reduce complexity of cellular proteome and partially overcome the abovementioned resolution limitation of proteomic separation technologies (Wu, C. et al., 2004; Blonder, J. et al., 2002; Brunet, S. et al., 2003; Yates, J. et al., 2005). The underlying purpose of subcellular prefractionation is to isolate cellular compartments into distinguishable fractions to further analysis. After plasma membrane disruption, subcellular compartments can be fractionated using a variety of approaches including differential or gradient centrifugation, immunodepletion and free-flow electrophoresis methods. The total protein content of cells or biofluids can also be simplified by fractionation methods based on affinity procedures to isolate groups of proteins displaying similar features (thiol-based isolation of cysteinyl proteins, hydrazidebased isolation of glycoproteins, metal chelating solid phases or specific antibodies to isolate phosphoproteins, etc.). This strategy is commonly known as Subproteomic Enrichment (or Subproteomic Fractionation). Although information on protein localization is lost with this strategy, complexity can be greatly reduced at the protein or peptide level and number of identifications increased substantially including lowabundance proteins (Liu, T et al., 2006). In addition to reducing sample complexity, 27.
Imagem


+7


Documentos relacionados
The side-chains of residues that build up the FOC are showed as sticks (His38, Aps 65 and Glu29). A) Representation of two FOCs located between two symmetry- related monomers.
To further promote proteomics studies in Leishmania, we used high-resolution 2-DE to compare the steady-state protein expression of two Leishmania species, L.. major, for the purpose
To date there has been no report of the recombinant production of smallest isoform of IL-24.This study is the first report of the recombinant expression and purification of the
O presente trabalho apresenta um caso prático de criação de um modelo 3D do interior da gruta Algar do Penico (Algarve, Portugal) a partir de um levantamento por laser
In this study, we investigate the role of balancing selection in human evolution using available exomes from modern (Homo sapiens) and archaic humans (H. neanderthalensis and
When a subject yawned (the trigger), we recorded 1) time; 2) the encoded identity of the yawner (hereafter, the ‘‘trigger’’) and of each potential responder (hereafter,
On the light of the present results, we provided a set of predicted protein-protein interactions between viral and human proteins that can be used in functional genomics studies
A crescente inovação deste tipo de medicamentos e produtos obriga a uma contínua atualização do farmacêutico no que diz respeito não só à seleção tendo em conta
