Procedia Environmental Sciences 27 ( 2015 ) 83 – 88
1878-0296 © 2015 The Authors. Published by Elsevier B.V. This is an open access article under the CC BY-NC-ND license (http://creativecommons.org/licenses/by-nc-nd/4.0/).
Peer-review under responsibility of Spatial Statistics 2015: Emerging Patterns committee doi: 10.1016/j.proenv.2015.07.115
ScienceDirect
Spatial Statistics 2015: Emerging Patterns
Establishment of detection and correction parameters for a
geostatistical homogenisation approach
S. Ribeiro
a*, J. Caineta
b, A. C. Costa
a, A. Soares
baNOVA IMS, Universidade Nova de Lisboa, Campus de Campolide, 1070-312 Lisboa, Portugal
b CERENA – Centro de Recursos Naturais e Ambiente, Instituto Superior Técnico, Av. Rovisco Pais, 1, 1049-001 Lisboa, Portugal
Abstract
Non-natural irregularities are an inevitable part of long-time climate records. They are originated during the process of measuring and collecting data from weather stations. In order to use those records as an input for environmental projects or climate studies, it is essential to detect and correct the irregularities through the process of homogenisation. The use of geostatistical approaches as homogenisation techniques has already been proven to be successful. The gsimcli homogenisation process is based on a geostatistical simulation method, the direct sequential simulation. This method generates a set of equally probable and independent realisations, and calculates a probability distribution function at the candidate station’s location. This probability distribution function is then used in the identification and correction of irregularities. Currently, gsimcli is being developed into an open source software package. During the homogenisation process, gsimcli requires the selection of several parameters in the detection and correction of irregularities. The candidate stations’ order to be homogenised, the value of the probability used in the detection of irregularities, and the statistic value to be used in the correction of the irregularity or in the replacement of missing data, are examples of parameters to be chosen for the homogenisation with gsimcli. This work presents a sensitivity analysis of those parameters, in order to find the most suitable set of values for the homogenisation of monthly precipitation data. A benchmark data set, comprising climate records from an Austrian precipitation network, will be used in this analysis. Performance metrics are calculated to evaluate the efficiency of the homogenisation process. The set of parameters providing the best values of performance metrics will be defined as the default set of homogenisation parameters for precipitation data. © 2015 The Authors. Published by Elsevier B.V.
Peer-review under responsibility of Spatial Statistics 2015: Emerging Patterns committee.
Keywords: sensitivity analysis, benchmark, precipitation, homogenization.
* Corresponding author. Tel.: +351-213-828-610; fax: +351-213-828-611. E-mail address: [email protected]
© 2015 The Authors. Published by Elsevier B.V This is an open access article under the CC BY-NC-ND license (http://creativecommons.org/licenses/by-nc-nd/4.0/).
1. Introduction
Homogenisation is the process of detecting and correcting non-natural irregularities (or inhomogeneities) included in climate time series1. This process is of paramount importance since inhomogeneities are often of the same magnitude as the climatic signal, and therefore an analysis of the original climate data series can lead to wrong conclusions about the climate evolution2. Due to the climate change issue, the investigation of the water cycle modification has reached high priority. Precipitation became one of the most studied climate variables, not only for scientific reasons but also because precipitation is one of the most important climate elements directly affecting human society, economic activities, and natural systems3.
Inhomogeneities may be derived from abrupt or gradual changes in the instrumentation or in the neighbourhood of a weather station. Abrupt changes are due to changes in the instrumentation, method of measurement and in the process of collecting and storing climate series. Gradual changes are related with variations in the environment, such as the urban development surrounding a weather station4.
Several homogenisation methods have been developed in the last decades1. Those techniques depend on the type of climate variable to be analysed, the temporal resolution of the observations, the availability of metadata, and the density of the network of neighbouring stations5.
Venema et al.6 described a European initiative where some of the homogenisation methods were assessed for efficiency using a benchmark data set, named COST Action ES0601 “HOME” (Advances in Homogenisation Methods of Climate Series: an Integrated Approach, 2008-2011). The known location of the inhomogeneities allows the evaluation of the homogenisation methods, through the calculation of performance metrics. This benchmark data set comprises data series of temperature and precipitation, from networks of weather stations located in Europe with 5, 9 or 15 stations. Three types of data are present in the benchmark data set: original, surrogated and synthetic data. The precipitation surrogated data sets come from Austria and France weather stations networks.
Costa et al.7 proposed a homogenisation method based on a geostatistical simulation approach which was recently developed in a software package8. The direct sequential simulation (DSS) is a geostatistical simulation process9, used in several contexts (oil and gas resources, air and water pollutants). Its main advantage is not requiring the transformation of the original variable, while honouring both the variable’s covariance model and histogram. The DSS-based homogenisation method calculates the local probability density functions (pdf) at candidate stations (stations to be homogenised), using spatial and temporal observations from neighbouring stations (reference stations). Those local pdfs are used for the detection and correction of the inhomogeneities.
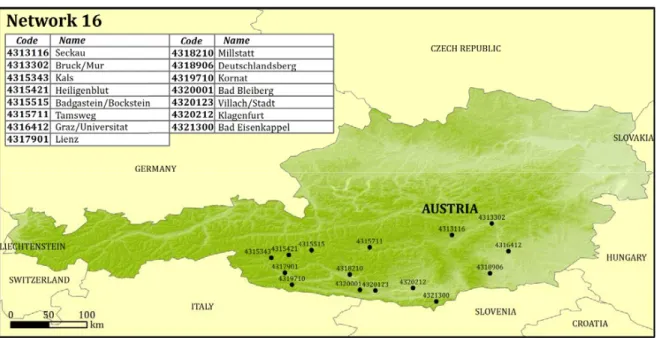
This work presents an analysis of the parameters for the gsimcli homogenisation software package. We use the benchmark data set from COST Action ES0601 “HOME” to perform the analysis, namely the network 16 from the surrogated precipitation data set, located in Austria and comprising 15 weather stations. The analysed parameters are the cell size of the simulation grid, the number of nodes used for the calculation of the local pdf, and the correction parameter. The selection of a number of nodes in the calculation of the local pdf constitutes an innovative procedure for homogenisation: the local pdf of a candidate station will be calculated with the simulated values of the node from its exact location plus additional simulated values from its neighbouring nodes. The objective of this procedure is to provide more local information to the calculation of the local pdf in order to reproduce the climatic signal of that location more realistically.
Section 2 presents the study area and data, Section 3 depicts the methodological framework. Section 4 discusses the achieved results. Finally, conclusions and future work are presented in Section 5.
Nomenclature
DSS Direct Sequential Simulation pdf probability density functions CRMSE Centred Root Mean Squared Error
2. Study area and data
The analysis uses the surrogated precipitation data prepared by COST Action “HOME”10, namely the network 16, located in Austria (Fig.1). This network is composed of 15 weather stations, containing monthly values for a period of 100 years (1900 – 1999). The data set contains missing data in some of the stations. The presence of missing data intends to mimic the absence of weather stations in the beginning of the 20th century (between 1900 and 1924), since the intensification of the weather network was only consolidated later, and also the destruction of some of the existing weather stations and absence of data collection during the period of the Second World War (between 1941 and 1945). Network 16 covers a rectangular area of approximately 24640 km2 (220 km x 112 km).
3. Methodological framework
3.1. Geostatistical homogenisation
The homogenisation method is based on the Direct Sequential Simulation (DSS) algorithm9. In DSS, the local probability density functions are calculated at the location of the candidate station, using temporal and spatial observations, only from nearby reference stations. The local pdf from each instant in time (e.g, month) is used to verify the existence of inhomogeneities. A breakpoint is identified whenever the interval of a specified probability p, centred in the local pdf, does not contain the observed (real) value of the candidate station. In that case, the time series is corrected by replacing the inhomogeneous record(s) with a statistic value of the pdf previously calculated for the inhomogeneous period(s) (e.g, mean, median or a given percentile).
3.2. Gsimcli software
The gsimcli software package allows the performance of the homogenisation in a seamless and practical manner. After the provision of the required parameters, the homogenisation process is easy and straightforward. There are two sets of parameters in gsimcli: the subset of simulation parameters and the subset related to the homogenisation itself. The subset of simulation parameters consists of the following parameters8:
x Number of simulations: the number of simulated images per candidate station. x Kriging type: the kriging estimator used while simulating each node.
x Maximum number of nodes to be found: defines the upper limit of data points that should be looked up for and used in the kriging system.
x Number of CPU cores: the application enables to run more than one simulation at the same time.
x Simulation grid: these specifications determine the dimension of each grid, the cells size, and the coordinates of the origin point. The required computational time increases with the number of grid cells.
x Semivariogram: climate data is correlated in space and time, and the semivariogram is the tool used to build the continuity structural model.
The following parameters are part of the homogenisation procedure8:
x Candidates order: the order by which the candidate stations will be homogenised.
x Detection probability: the probability value to build the detection interval centred in the local pdf.
x Tolerance radius: the detection interval, by default, is built using the simulated values located on the nodes corresponding to the candidate station's coordinates. There is also the option to consider all the nodes located in a radius around the candidate station’s location.
x Correction method: sets the statistic used for the inhomogeneities correction; the detected irregularities (inhomogeneities, outliers or missing values) can be replaced by the mean, median, skewness and percentile values of the local pdf.
3.3. Variography
The study of variography has revealed to be a very challenging task due to the variability of precipitation monthly data and the number of available stations. The correlation between stations is lost at very short distances. In some of the studied periods, the range is lower than the distance between some of the stations of the network. This fact will affect the continuity of the simulated grid values. A way to overcome this drawback is the use of additional stations, from the surrounding study area. In this case, this solution is not possible, since only the provided data sets by “HOME” can be used.
Due to the absence of data, a unique semivariogram was modelled for the first three decades (1900 – 1929). Data from the fourth and fifth decades (1940-1959) were included in another single data set. Seven semivariogram were modelled for each monthly series, in a total of 84.
3.4. Parameters’ sensitivity analysis
The homogenisation of precipitation data is carried out by decade and month. Precipitation time series are divided into 10 decades, by month, totalising 120 precipitation data sets. For each month, input data corresponds to a folder that is prepared including a subfolder with 10 files: each file with data from a decade, a file containing the grid settings and another file including the parameters of variography. gsimcli parameters are set with the following values:
x Number of simulations: 500. x Kriging type: ordinary kriging.
x Maximum number of nodes to be found: 16. x Number of CPU cores: 4.
x Simulation grid: different values of cell size were tested: 1000 m and 5000 m, corresponding to grids of 27709 cells (229 x 121 cells) and 2088 cells (58 x 36 cells), respectively. The parameters defining the grids’ structure are described in a file, included in the input data folder for each month.
x Semivariogram: parameters defining the different semivariograms are described in a file, included in the input data folder, for each month and decade (seven semivariograms per month).
x Candidates order: descending order of variance. x Detection probability: 0.95.
x Tolerance radius: 0 (no tolerance radius) and 1 node.
x Correction method: percentile values of 0.95 and 0.975 are tested.
Simulation grid, tolerance radius and correction parameters are changed in the performed tests (Table 1). Table 1. Parameters of the sensitivity analysis tests.
Tests Cell size (m) # of nodes Correction parameter
Test 1 1000 0 Percentile 0.975
Test 2 1000 0 Percentile 0.95
Test 3 5000 0 Percentile 0.975
Test 4 5000 1 Percentile 0.975
3.5. Performance metrics
For each of the four homogenisation tests with different parameters, performance metrics are calculated. Those metrics are the Station CRMSE (Centred Root Mean Square Error), the Network CRMSE, the Station Improvement and the Network Improvement, as defined by Venema et al.6. The Station CRMSE quantifies the homogenisation efficiency for each station individually and it is obtained by the mean CRMSE, by station. The Network CRMSE measures the efficiency of the homogenisation of the network, as a whole. It is calculated using the mean CRMSE, by network. The Improvement metrics assess the enhancement over the inhomogeneous data and are computed as the ratio of the Station (Network) CRMSE of the homogenised networks and the Station (Network) CRMSE of the same inhomogeneous networks. Station CRMSE and Network CRMSE metrics are calculated using the homogenised and the original precipitation time series. The Improvement metrics are calculated with the homogenised, original and inhomogeneous time series. Those metrics are all computed by the gsimcli software package.
4. Results
Tests with the lowest values of performance metrics correspond to tests with the best set of parameters (Table 2). It is important to note the difference between Tests 1 and 2, which is related to the correction parameter. The usage of a lower value of percentile does not contribute to the efficiency of the homogenisation. Comparing the results of Tests 1 and 3, it can be observed that the increase of the cell size does not significantly decrease the quality of homogenisation, while reducing the CPU processing time. The inclusion of surrounding nodes of the candidate station in the calculation of its local pdf (comparison between Tests 3 and 4) seems to reduce the value of performance metrics, hence improving the quality of the homogenised series.
Table 2. Performance metrics of the sensitivity analysis tests.
Tests Station CRMSE Network CRMSE Station Improvement Network Improvement
Test 1 13.106 5.114 1.096 1.172
Test 2 13.556 5.957 1.133 1.365
Test 3 13.087 5.204 1.094 1.192
Test 4 13.009 5.126 1.088 1.175
5. Conclusions
The homogenisation of monthly precipitation time series from Austria was performed through a set of four sensitivity analysis tests using the gsimcli software package, and data from the benchmark data set disclosed by the
COST Action ES0601 “HOME”. Those four tests were conducted with different sets of parameters. After the completion of homogenisation, performance metrics were calculated. The results showed a high influence of the correction parameter in the efficiency of the homogenisation. It can also be concluded that increasing the size of the grid cell accelerates the simulation process, without decreasing the quality of homogenisation significantly. The inclusion of neighbouring nodes of the candidate station in the calculation of the local pdf enhances the quality of homogenisation. As future work, it is advisable to perform further tests with additional networks in order to confirm these results.
Acknowledgements
The authors gratefully acknowledge the financial support of “Fundação para a Ciência e Tecnologia” (FCT), Portugal, through the research project PTDC/GEO-MET/4026/2012 (“GSIMCLI - Geostatistical simulation with local distributions for the homogenization and interpolation of climate data”).
References
1. Aguilar E, Auer I, Brunet M, Peterson TC, Wieringa J. Guidelines on climate metadata and homogenization. In Llansó P, editors. World Meteorological Organization, (WMO/TD No. 1186), 2003.
2. Mamara A, Argiriou AA, Anadranistakis M. Detection and correction of inhomogeneities in Greek climate temperature series. Int J Climatol 2014; 34, 3024–3043. doi:10.1002/joc.3888
3. Climate change 2007 - The physical science basis, Working Group I contribution to the Fourth Assessment Report of the Intergovernmental Panel on Climate Change, Vol. 4. In Solomon S, editors. Cambridge University Press: Cambridge and New York, 2007.
4. Brunet M, Jones P. Data rescue initiatives: bringing historical climate data into the 21st century. Clim Res 2011; 47(1), 29–40. doi:10.3354/cr00960
5. Costa AC, Soares A. Homogenization of climate data: review and new perspectives using geostatistics. Math Geosci 2009; 41(3), 291–305. doi:10.1007/s11004-008-9203-3
6. Venema V, Mestre O, Aguilar E, Auer I, Guijarro J, Domonkos P, Vertacnik G, Szentimrey T, ŠtČpanek P, Zahradniþek P, Viarre J, Muller-Westermeier G, Lakatos M, Williams C, Menne M, Lindau R, Rasol D, Rustemeier E, Kolokythas K, Marinova T, Andresen L, Acquaotta F, Fratianni S, Cheval S, Klancar M, Brunetti M, Gruber C, Prohom Duran M, Likso T, Esteban P, Brandsma T. Benchmarking homogenization algorithms for monthly data. Clim Past 2012; 8(1), 89–115.
7. Costa ACM, Negreiros J, Soares A. Identification of inhomogeneities in precipitation time series using stochastic simulation. In Soares A, Pereira MJ, Dimitrakopoulos R, editors. geoENV VI–Geostatistics for Environmental Applications, Springer; 2008. p. 275–282.
8. Caineta J, Ribeiro S, Henriques R, Costa AC. A package for the homogenisation of climate data using geostatistical simulation. In GEOProcessing 2015: The Seventh International Conference on Advanced Geographic Information Systems, Applications, and Services, Lisbon, Portugal, 2015. IARIA.
9. Soares A. Direct sequential simulation and cosimulation, Math Geol 2001; 33(8), 911-926. 10. Venema V, Mestre O. The file format for COST-HOME. 2010, p. 1-4.