Improving Emergency Department Through Business
Process Redesign: An empirical study
Ruben Pereira
Instituto Universitário de Lisboa (ISCTE-IUL) Portugal
Luís Velez Lapão
Instituto de Higiene e Medicina Tropical, Universidade Nova de Lisboa Portugal
Isaias Scalabrin Bianchi
Federal University of Santa Catarina Brazil
Daniel Amaral
Instituto Universitário de Lisboa (ISCTE-IUL) Portugal
Abstract
The Emergency Departments (ED) of hospitals are poised for continuous improvement due to increasing demand. The ED are places where the efficiency of the services provided can save lives and therefore it should be seen as an area of maximum interest for process optimisation. This research aims at verifying if the application of Business Process Management (BPM) heuristics positively impacts the length of stay (LoS), without deteriorating the quality of the service provided. The methodology that underlies this research is a case study carried out in the ED of a public hospital. The data was gathered from individual interviews, focus groups, direct observation and document analysis. The BPM life cycle stages were followed. In addition, a simulation tool was used, and heuristics were chosen based on Devil’s Quadrangle theory. Three scenarios of the ED were considered. Additionally, three heuristics and any combination of them were also considered. Results show that heuristics positively impact the time variable without affecting the quality of the service, resulting in value gains for the patient. In terms of time consumption, the average LoS in the process was reduced by 22.5%, 15.9%, and 20.9% for each of the considered scenarios, while the maximum LoS was reduced by 29.2%, 36.2% % and 37.4%. Implications from these results were analysed. The novelty of this research is supported by the absence of studies applying BPM heuristics to ED. This research is a step forward to ally BPM heuristics and ED processes.
Keywords Emergency Departments, Business Process Management, Redesign Heuristics,
Process Redesign and Simulation, Quality, Time.
1 Introduction
Health care systems around the world are increasingly struggling to implement changes in their process aiming to reduce costs, improve the operational efficiency and deliver better services for the patients (Feibert, Andersen, & Jacobsen, 2019; Feibert & Jacobsen, 2019; Hassan, 2017). Health services have two major management challenges: the use of management evidence and management innovation (Hassan, 2017; Lapão, 2016; Pestana,
Pereira, & Moro, 2020). This research focuses on the first management challenge mentioned by Lapão (2016), Hassan(2017), Garmann-Johnsen and Eikebrokk (2017), the use of management evidence – more precisely, on the optimisation of healthcare work processes.
The healthcare industry often presents a poor design, high fragmentation and stunning inefficiency (Dickman, Tong, & Davis, 2012). Individual achievements are no longer sustainable to reach the excellence of an overall functional healthcare system. For instance, Emergency Departments (ED) are facing many problems today (De Ramón Fernández, Ruiz Fernández, & Sabuco García, 2019; Feibert et al., 2019; Hassan, 2017; Hoot & Aronsky, 2008; Leva, Sulis, & Vinai, 2017), like: P1- Shortage of resources that often leads to work overload; P2- Long waiting times for patients make the process of ED even longer; P3- Excessive use of ED, often not fulfilling the criteria for emergency. These problems can lead to well-known situations of inefficiency, medical risk and financial losses. In addition, in the Portuguese Healthcare system, the ED works as a buffer to respond to the most serious cases effectively and promptly. Thus, it should have the required conditions to cope with the critical care demand. These problems remain a case of general concern to all. It is recognized as a value-added topic to investigate. Grounded on the critical importance of ED aforementioned, “Redesign Heuristics” play a crucial role when improvement needs come up (Dumas, La Rosa, Mendling, & Reijers, 2018). Therefore, this research aims at investigating the application of business process management (BPM) and redesign heuristics to improve ED services.
To pursue our goal, a case study (CS) was performed in an ED of a Portuguese Hospital located in the Lisbon region. This is a critical issue for Portugal since citizens’ average life expectancy increased from 63 years in 1961 to 81 years in 2011, and births are decreasing significantly, in 1960 the birth rate was 16.2% and in 2011 it was only 7.9% (PORDATA, 2018). In addition, at the end of 2014/early 2015, a major flu epidemic emerged, creating chaos in the Portuguese ED Services. Long waiting times for patients to be attended due to lack of beds to accommodate patients was the most relevant factor. Additionally, Portugal is one of the countries with higher rate of ED visits per one hundred thousand inhabitants. Therefore, Portugal is a suitable place to explore new ways to improve ED.
Moreover, the hospital under study defined wasted time as the critical point to improve assuming that service quality would not decrease. Bearing this in mind and taking into account both problems and research objectives, the research question (RQ) this research intends to answer is: Which Business Process Redesign heuristics can help optimise time response in an ED without deteriorating the quality of the service provided?
2 Theoretical Background
2.1 Business Process Management and Care Process Management
Seen as a set of activities that together may accomplish a business objective (Davenport, 1993; Ko, Zhai, & Rodriguez-Zas, 2009), business processes are a key instrument to keep enterprises organized (van der Aalst, ter Hofstede, & Weske, 2003).
BPM has a settled arrangement of standards Wüllenweber et al.(2008), techniques and instruments that consolidate learning from information technology, management sciences and industrial engineering with the purpose of improving business processes (Dumas et al., 2018; van der Aalst, 2013; van der Aalst et al., 2003). In accordance with Vom Brocke et al. (2014), BPM focuses on improving corporate performance by managing business processes. In this
case, it will focus on the optimisation of the ED, improving the overall services provided by a healthcare institution.
Although, it is regular to allude to Care Process Management (CPM) in the healthcare sector while discussing BPM. CPM is the use of business process automation and optimisation techniques in clinical care processes in the healthcare environment. It additionally utilizes the best practices for BPM to enhance clinical results without changing health processes or dislodging the job of health stakeholders (Dickman et al., 2012).
CPM offers a guide that helps the healthcare sector to change delivery processes. Without changing what human services specialists do best, it tends to the inalienable wasteful aspects of the care delivery process. Numerous parts of care delivery can be enhanced utilizing BPM to automatize the coordination of care delivery and to empower suppliers to team up more adequately (Dickman et al., 2012).
2.2 Redesign Heuristics
Heuristics are strategies derived from previous experiences with similar problems. These strategies rely on using readily accessible, though loosely applicable, information to control problem-solving in human beings, machines, and abstract issues (Ippoliti, 2015; Şahin, Duran, Yakıcı, & Şahin, 2018; Testa, Cinque, Coronato, De Pietro, & Augusto, 2015). In BPM, redesign heuristics exist as a method that builds upon an extensive set of redesign options (Reijers & Liman Mansar, 2005). During the redesign process organizations’ goals compliance must be assured and therefore it is advisable to use the Devil’s Quadrangle framework (Dumas et al., 2018). Organizations’ goals and strategy determine which dimension should be maximized and what consequences these decisions have on the other dimensions.
Heuristics in Business Process Redesign (BPR) have been proposed in the last years and are synthesized by Dumas et al. (2018). These heuristics can be divided in six categories: Customers, Products, Business Process (operation view & behavioural view), Organisation (structure & population), Information and finally, Technology. Due to space limitations the authors do not list all the heuristics. Although a redesign heuristic is not a model of a business process, it represents a set of ideas that help one think about the business process in the context of process redesign. In this case, redesign heuristics are applied in order to measure the impact on the process and then evaluate if that impact is positive or negative.
2.3 Previous Work
Following the concept-centric approach (Webster & Watson, 2002), this section lists the studies applying BPR in healthcare using BPM heuristics. Several scientific databases were consulted, namely, IEEE Explore, Google Scholar and ABI/INFORM Collection. Furthermore, the following keywords were used in the search: “Process Optimisation”, “Business Process Management”, “Process Redesign” and “Redesign Heuristics”.
Overall, some researchers have investigated how to improve healthcare services including ED. Most of the studies are not focused on ED but this is not completely new in the body of knowledge.
Some studies present improvements of healthcare services resulting from the implementation of healthcare reforms using BPM as a tool. For example, in Italy, a Hospital used a BPM system to improve service quality and efficiency. As a result, it was able to identify areas for
improvement such as reducing the number of operating sessions, preparation of the operating rooms for each operation, availability of specific surgical instruments and so on.
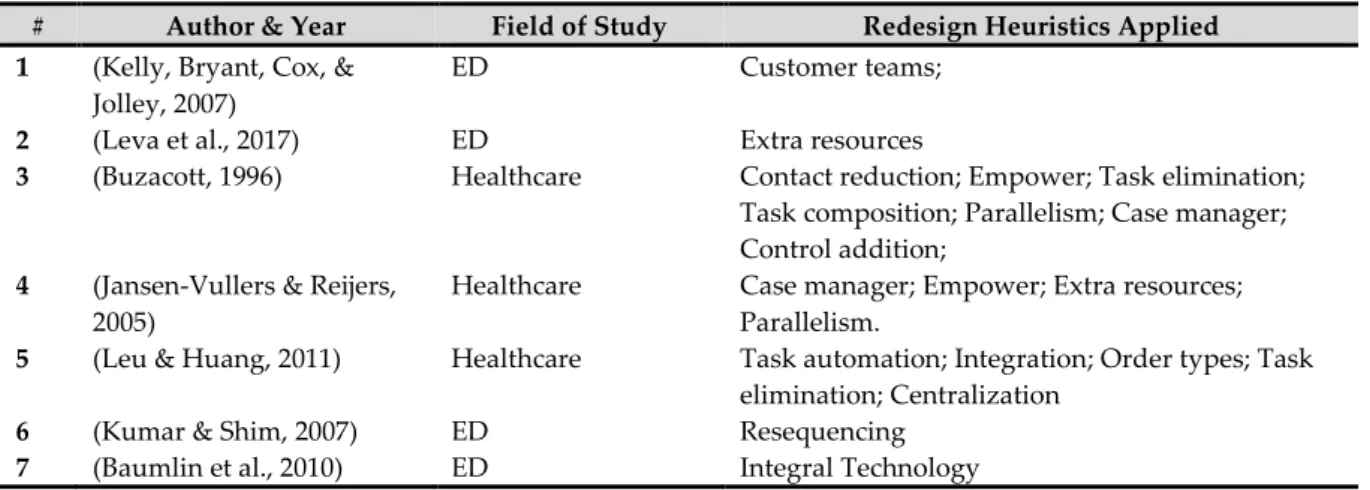
However, the list of studies found highlights that the application of BPM theory in ED is far less when compared with other areas and techniques in healthcare (Leggat, Bartram, Stanton, Bamber, & Sohal, 2015). Lean for example is commonly applied in healthcare literature and some studies exist in ED (Holden, 2011). Therefore, further research in this area is required. After an in-depth inquiry on the topic, seven studies were found (Table 1). This research focused on redesign of organisational (healthcare) processes, supported by heuristics and having the BPM tool as an ally in order to obtain the best results.
Despite being identified as applying heuristics in an ED, studies 1,2,6 and 7 were not developed as officially adopting Heuristics from the lens of BPM. Only after a deep analysis of the studies, the authors were able to understand that a heuristic was in fact being applied to improve the ED.
# Author & Year Field of Study Redesign Heuristics Applied 1 (Kelly, Bryant, Cox, &
Jolley, 2007)
ED Customer teams;
2 (Leva et al., 2017) ED Extra resources
3 (Buzacott, 1996) Healthcare Contact reduction; Empower; Task elimination;
Task composition; Parallelism; Case manager; Control addition;
4 (Jansen-Vullers & Reijers, 2005)
Healthcare Case manager; Empower; Extra resources;
Parallelism.
5 (Leu & Huang, 2011) Healthcare Task automation; Integration; Order types; Task
elimination; Centralization
6 (Kumar & Shim, 2007) ED Resequencing
7 (Baumlin et al., 2010) ED Integral Technology
Table 1. Redesign Heuristics Application in the Healthcare Sector
3 Methods
The research methodology adopted in this investigation was the case study (CS). The CS approach may be used to observe phenomenon in real events (Yin, 2009). According to Zucker (2009) and Bromley (1990) it is a systematic inquiry into an event or a set of related events which aims to describe and explain the phenomenon of interest. The CS method is particularly appropriate for these types of studies and well-suited to capture knowledge and develop theories (Benbasat, Goldstein, & Mead, 1987). Consequently, since this research focuses on contemporary events within the real-life context (an ED of a real healthcare institution), the CS method was selected by its ability to look at the world around us and also its importance in the IT area (Pereira, Almeida, & Mira da Silva, 2013).
Moreover, a CS is suitable to answer research questions of the type “how” or “why”, which is also aligned with the RQ listed in Section 1. Additionally, to support the use of the CS method and as advised by some authors (Yin, 2009; Zucker, 2009), complementary methods will be used, such as direct observation, document analysis, interviews and focus groups with stakeholders. Despite adopting CS methodology (Yin, 2009), since this study also follows BPM lifecycle phases, the authors decided to organize Section 4 based on BPM phases instead of Yin’s steps. Nevertheless, Yin’s steps as well as used techniques and methods are easily
identifiable throughout the following sections. Following Gary (Gary, 2016) theory, our CS is a single and local CS. Since we intended to explore the applicability of certain heuristics in an ED one may argue that this CS follows the testing theory approach.
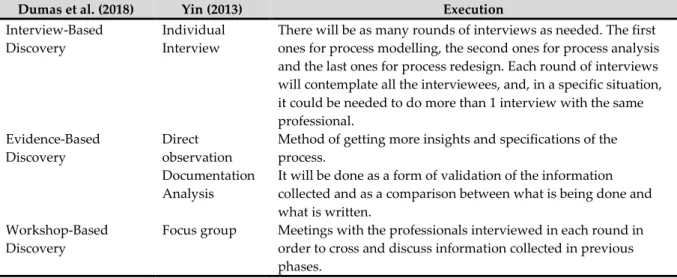
This study adopted mixed methods (Dumas et al., 2018; Yin, 2009) detailed in Table 2. The considered stakeholders were: nursing manager, nursing supervisor, medical manager and an administrator. These stakeholders are able to represent the most regular concerns of all the physicians, nurses and top management. Firstly, a meeting with all stakeholders was held to define the scope of the research and limits of the process to be studied. Additionally, individual interviews were used to collected different inputs from different stakeholders. Along the investigation, when needed, observation and document analysis were also performed. At the end, a focus group with all the stakeholders involved was formed to reach consensus. Moreover, along the CS, Bizagi software (Bizagi, 2018) was used to model and simulate the ED process.
It should be noted that process mining was excluded based on the limitations of the IS used that will be further detailed throughout the document.
4 Business Process Redesign of the Emergency Department
4.1 Process Identification, Discovery and Modelling
In these phases of the BPM lifecycle, the authors followed Dumas et al. (Dumas et al., 2018) presenting a description of the most relevant processes. The unit of analysis is the ED of a Portuguese public hospital (located in the Lisbon region). It plays a pivotal role in responding to urgent cases given its geographic location. The hospital has three emergency departments: obstetric, paediatric and general. In this research, only the General ED was considered.
Dumas et al. (2018) Yin (2013) Execution
Interview-Based Discovery
Individual Interview
There will be as many rounds of interviews as needed. The first ones for process modelling, the second ones for process analysis and the last ones for process redesign. Each round of interviews will contemplate all the interviewees, and, in a specific situation, it could be needed to do more than 1 interview with the same professional.
Evidence-Based Discovery
Direct observation
Method of getting more insights and specifications of the process.
Documentation Analysis
It will be done as a form of validation of the information collected and as a comparison between what is being done and what is written.
Workshop-Based Discovery
Focus group Meetings with the professionals interviewed in each round in order to cross and discuss information collected in previous phases.
Table 2. Yin and Dumas perspectives of data collection. Source: Own Source
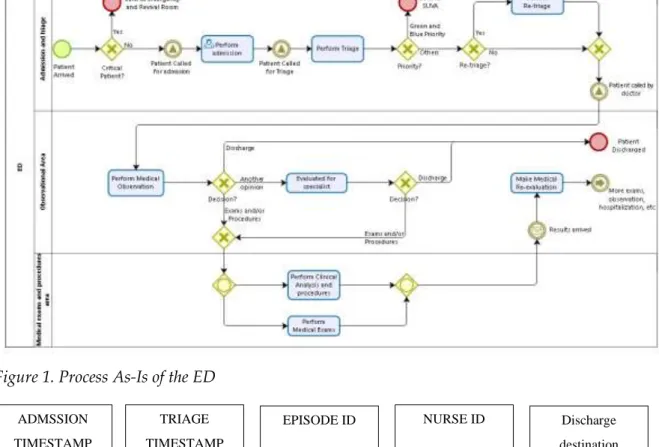
Only part of the ED process is considered in this research (see Figure 1). The scope of the process under study, begins with the entry of the patient in the ED and ends with the re-evaluation of the patients. The ED is organized in three observation areas: Emergency Services of Greens and Blues (ESGB), Ambulatory and Clinical Observation. After the triage, the patient receives a priority (colour), which dictates the waiting room where the patient should wait. There is another designated area for red priority patients called the Revival Room. However,
both Revival Room and ESGB are outside the scope of this research since they have less patients. There is a high variety of human resources (HR) working in the ED. This research focuses on the HR directly related with the patient flow at the ED (Table 3).
Type of Resource Quantity
Doctors (general medicine) 11
Doctors–Specialist* 3
Nurses–T 2
Nurses–CAP 8
Desk supporters 2
Technicians 3
* The specialist (many specialities) is not 100% allocated to the ED, but he/she provides her/his services every time they are required.
Table 3. Resources available per shift
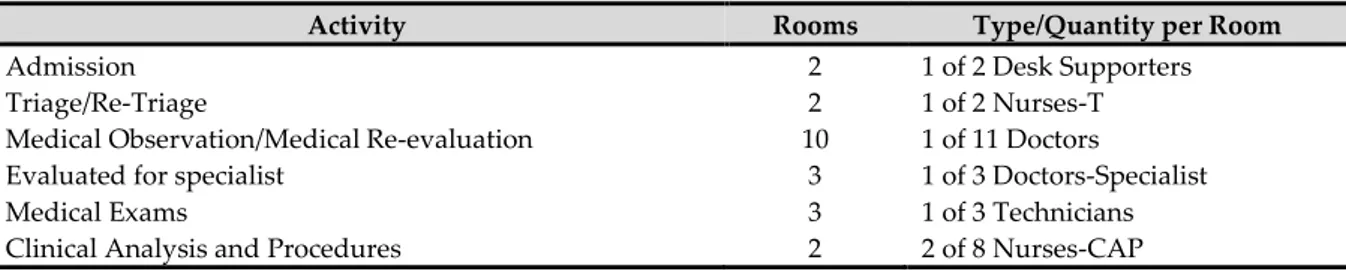
Nurses-T operate in the triage while Nurses-CAP operate in the Clinical Analysis and Procedures. Activities like triage and re-triage are done by the same resources as medical observation and medical re-evaluation. Table 4 lists the main activities, rooms available for each activity and the type and quantity of resources needed are introduced.
Activity Rooms Type/Quantity per Room
Admission 2 1 of 2 Desk Supporters
Triage/Re-Triage 2 1 of 2 Nurses-T
Medical Observation/Medical Re-evaluation 10 1 of 11 Doctors
Evaluated for specialist 3 1 of 3 Doctors-Specialist
Medical Exams 3 1 of 3 Technicians
Clinical Analysis and Procedures 2 2 of 8 Nurses-CAP
Table 4. Resources needed per activity
Five priority categories exist to decide the maximum advisable waiting time for each patient (Table 5). Additionally, according to the ED administrator, there are also satisfactory times to perform the medical observation activity (Table 5). Since red priority is seen as the most urgent situation, there is no specified time.
Priority Waiting Time (min.) Observation Time (min.)
Red 0 No time defined
Orange 10 45
Yellow 60 30
Green 120 15
Blue 240 10
Table 5. Satisfactory waiting times and Medical Observation time. Source: provided by the ED under study
4.2 Process As-Is
4.2.1 Inputs for Process Simulation
Several sources were used. The authors had access to a dataset provided by the hospital. The data collection occurred between January 1st, 2015 and December 31st, 2017 (a total of 1096 days). In total there were 305,636 records, with each record representing the interaction of a patient with the ED, containing a total of 15 attributes per record (Figure 2).
Whenever a patient visits the ED, a sequence of activities is followed - the ED flow. This ED flow has five main activities. It starts with the patient admission, followed by the triage where the patient will be assessed and classified with a colour according to the Manchester Triage Protocol. After the triage, the patient waits to be observed by a doctor (Observation). Then, after getting observed and getting treatment from a clinician, the patient is discharged (Discharge), and later on formally allowed to leave the hospital (Administrative Discharge).
Figure 1. Process As-Is of the ED
Figure 2. Original dataset attributes list
ADMSSION TIMESTAMP (T1) TRIAGE TIMESTAMP (T2)
EPISODE ID NURSE ID Discharge
destination OBSERVATION TIMESTAMP (T3) DISCHARGE TIMESTAMP (T4)
Patient ID Doctor ID Readmission
flag ADMINISTRATIVE DISCHARGE TIMESTAMP (T5) DISEASE CODE (CODE_ICD) ED sub deparment
Discharge status Triage Color (MTProtocol)
As previously stated, this research does not address the entire process. The first three activities are the ones that will be further investigated. The data provided by the IS was not totally feasible. Unfortunately, the ED IS did not contemplate all the possible process exceptions (paths) and some information could be manually inserted after the events. In some cases, this resulted in incongruent timestamps. Therefore, the authors decided to cross-examine the data from the dataset with information gathered from interviews and direct observation.
The period used to simulate the models was previously defined with the stakeholders. The time of day chosen was from 9 a.m. to 12 a.m. (the daily period with a higher flow of patients to the ED) for a total of 15 hours. Furthermore, three distinct scenarios were considered. Each scenario has a different ratio of patient per hour. For a proper simulation, all the required information was collected (Table 6).
Required Information Description
Resources available per shift Table 3.
Type of resource needed for each activity and rooms available for each activity
Each activity needs a physical space and HR (Table 4). Work Time per activity (minimum,
maximum and average)
The working times were gathered both from the IS of the ED and individual interviews with stakeholders. Regarding data extracted from the IS of the ED, unfortunately, it was inaccurate and incomplete. Thus, the times presented in Table 7 are as close as possible based on both sources.
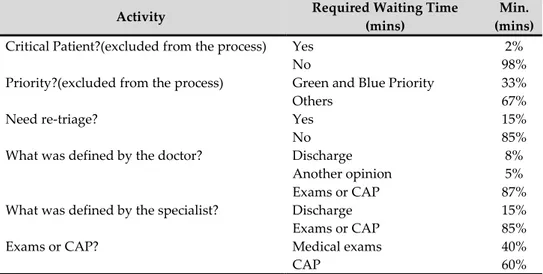
Percentage to be defined in the gateways This information is useful to decide the weight of each process path in the simulator (Table 8).
Patient’s flow – three scenarios (S1, S2, and S3)
All days in the ED are not equal. There are some tendencies depending on the day of the week. According to the Medical Manager, Mondays are the most complicated days due to the high flow of patients (corroborated by the dataset we had access to). To fulfil the variety of each day during a work week, three scenarios were created based on the information collected from the IS but also considering the information provided by the Medical Manager (Table 9).
From the data gathered from the IS of the ED, it was possible to verify that, on average, 85% of the patients go to the ED between 9 a.m. and 12 p.m.
Statistical distributions were chosen Triangular Distribution was used to simulate the work time of all activities. It is used when the information about the real time of the activity is scarce. Some activities have a required waiting time. This time is set on average time basis only
Table 6. Required information for simulation
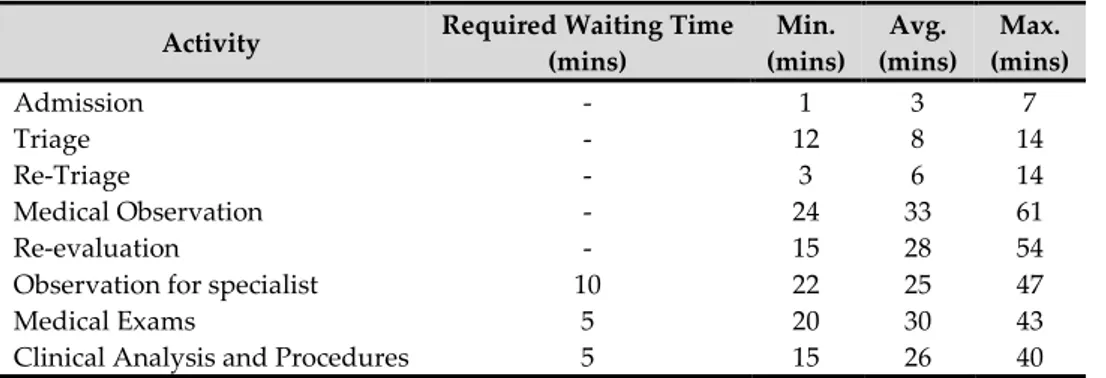
Activity Required Waiting Time (mins) Min. (mins) Avg. (mins) Max. (mins) Admission - 1 3 7 Triage - 12 8 14 Re-Triage - 3 6 14 Medical Observation - 24 33 61 Re-evaluation - 15 28 54
Observation for specialist 10 22 25 47
Medical Exams 5 20 30 43
Clinical Analysis and Procedures 5 15 26 40
Activity Required Waiting Time (mins)
Min. (mins)
Critical Patient?(excluded from the process) Yes 2%
No 98%
Priority?(excluded from the process) Green and Blue Priority 33%
Others 67%
Need re-triage? Yes 15%
No 85%
What was defined by the doctor? Discharge 8%
Another opinion 5%
Exams or CAP 87%
What was defined by the specialist? Discharge 15%
Exams or CAP 85%
Exams or CAP? Medical exams 40%
CAP 60%
Table 8. Gateways percentages
Scenario Patient Ratio/Working Hour
Total Patients/day
Working Time
Total Patients/Working Time (85% of total)
As-Is S1 13 patients 230 15h (9-24) 196
As-Is S2 16 patients 280 15h (9-24) 238
As-Is S3 19 patients 350 15h (9-24) 298
Table 9. Patients entry rate (three scenarios)
4.2.2 Results of Process Simulation (Process As-Is)
In the process simulation, What-if analysis was performed based on three scenarios (Table 9) with the same resources for each. The difference between the three scenarios is the patient ratio. ED_S3 is the scenario with a higher rate of patients per hour. In 15 hours of the working day under study, 280 patients entered the ED_S3. The rate of patients in the ED_S3 is 20.2% higher than ED_S2 and 48.9% higher than ED_S1.
The results of the simulation only refer to the scope of the process under study, from the moment the patient enters in the ED, to the moment the patient is re-evaluated. The average time that a single patient is within the process is 2 hours and 9 minutes in the ED_S3, taking at the maximum 6 hours and 37 minutes.
Comparing the maximum and the average time between the scenarios, one can sustain that the higher the rate of patients per hour, the higher the maximum and average time that patients stay in ED. The maximum and average time that a patient stays within the ED_S3 are 15.6% and 20.9% higher than in ED_S1, and 11.5% and 11.8% higher than in ED_S2.
Name Scenario Type Instances completed
Instances
started Max. time (hrs) Avg. time (hrs)
ED_S1 As-Is S1 Process 161 188 5h43m 1h47m
ED_S2 As-Is S2 Process 202 233 5h56m 1h55m
ED_S3 As-Is S3 Process 212 280 6h37m 2h09m
Table 10. Scenarios of Process As-Is
Considering the results present in Table 10, we decided to select only one scenario to compare in the process redesign phase. The chosen scenario is the ED_S3 since it presents a higher
margin of improvements and represents more problems for the ED. However, the results for the other two scenarios are detailed ahead in the document.
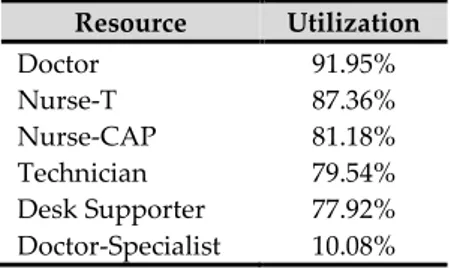
Table 11 introduces the HR utilization in the chosen process (ED_S3). Doctors and both types of Nurses are the most used. On the other hand, the Doctor–Specialist has the lowest utilization since he/she is not fully allocated to the ED and only works in the ED when called for specific cases. Resource Utilization Doctor 91.95% Nurse-T 87.36% Nurse-CAP 81.18% Technician 79.54% Desk Supporter 77.92% Doctor-Specialist 10.08%
Table 11. Utilization of resources
4.3 Process Analysis
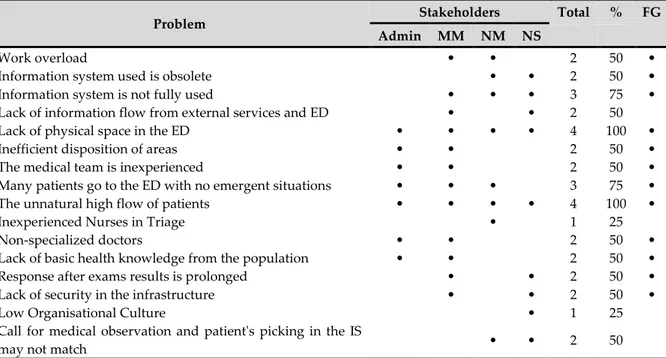
At this stage, the issues associated with the process As-Is are identified, documented and, where possible, quantified using performance measures (Dumas et al., 2018). In this way, it will be possible to understand the position of the process regarding the objectives established by the organisation. The aim is to prioritize the problems given their impact on ED and effort required to be solved. To elicit the problems of the ED, a round of interviews with all the stakeholders involved was performed followed by a focus group session aiming to: identify consensual problems (Table 12), merge similar problems and rename problems if needed (Table 13). All the interviewees had more than 20 years of experience in healthcare industry. The nursing manager is male, and the remaining stakeholders are females. Table 12 presents which stakeholder pointed each problem (and respective percentage overall) and identifies the ones stated as consensual at the end of the focus group. No problem categories were pre-defined. The interviewees were free to identify any problem.
Additionally, some evidence was taken from the simulated model of the As-Is. The final list of problems is the input to identify the possible improvements, which will, therefore, be aligned with the redesign heuristics.
4.4 Process Redesign
The Table 12 presents the wide list of problems. BPR seeks to create new ways of organising tasks, people and redesigning information systems so that processes are improved in critical and contemporary performance measures such as cost, quality, service and speed (Hammer & Champy, 1993; Sherwood-Smith, 1994).
Problem Stakeholders Total % FG Admin MM NM NS
Work overload • • 2 50 •
Information system used is obsolete • • 2 50 •
Information system is not fully used • • • 3 75 •
Lack of information flow from external services and ED • • 2 50
Lack of physical space in the ED • • • • 4 100 •
Inefficient disposition of areas • • 2 50 •
The medical team is inexperienced • • 2 50 •
Many patients go to the ED with no emergent situations • • • 3 75 •
The unnatural high flow of patients • • • • 4 100 •
Inexperienced Nurses in Triage • 1 25
Non-specialized doctors • • 2 50 •
Lack of basic health knowledge from the population • • 2 50 •
Response after exams results is prolonged • • 2 50 •
Lack of security in the infrastructure • • 2 50 •
Low Organisational Culture • 1 25
Call for medical observation and patient's picking in the IS
may not match • • 2 50
Admin:Administrator; MM:Medical Manager; NM:Nursing Manager; NS:Nursing Supervisor; FG:consensus
reached during Focus Group.
Table 12. Wide list of problems
Moreover, BPR supports organisational restructuring, focusing on business objectives. For this, business processes are analysed, non-essential or redundant tasks are eliminated, and IT is used to redesign and simplify organisational processes. The organizations redesigning the processes have several advantages such as decreasing the time required to execute it, reducing its cost, improving the quality of the output, and improving the process's ability to react to variation.
Main Problems Problems (Table 12)
P1 Work overload Work overload
P2 The medical team is inexperienced The medical team is inexperienced
Non-specialized doctors P3 Information system is not adjusted to the
needs of ED
Information system used is obsolete Information system is not fully used P4 The patients wait too much time for
re-evaluation
Response after exams results is prolonged P5 The physical space of ED is fully used Lack of physical space in the ED
Inefficient disposition of areas P6 The population is not well informed about
basic health knowledge
Many patients go to the ED with no emergent situations
Lack of basic health knowledge from the population P7 The unnatural high flow of patients The unnatural high flow of patients
P8 Lack of security in the infrastructure Lack of security in the infrastructure
Table 13. Main list of problems
In this study, the authors followed the recommendations suggested by Dumas et al. (2018) (redesign heuristics) to redesign the ED process. The data to support the process redesign was gathered through another round of interviews, followed by a focus group session and then
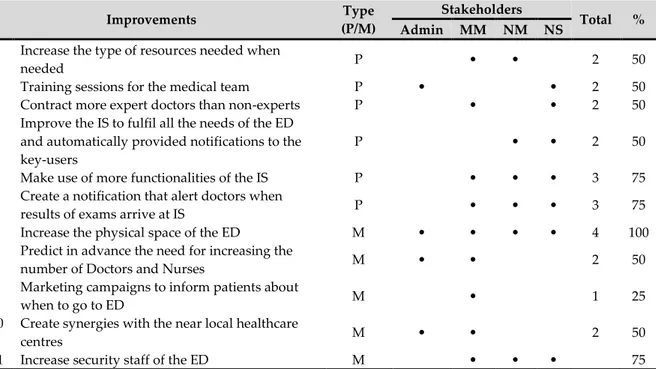
enhanced with the aforementioned results of process simulation. The improvements mentioned by each stakeholder during the interviews are listed in Table 14.
Improvements Type
(P/M)
Stakeholders
Total % Admin MM NM NS
I1 Increase the type of resources needed when
needed P • • 2 50
I2 Training sessions for the medical team P • • 2 50
I3 Contract more expert doctors than non-experts P • • 2 50
I4 Improve the IS to fulfil all the needs of the ED and automatically provided notifications to the key-users
P • • 2 50
I5 Make use of more functionalities of the IS P • • • 3 75
I6 Create a notification that alert doctors when
results of exams arrive at IS P • • • 3 75
I7 Increase the physical space of the ED M • • • • 4 100
I8 Predict in advance the need for increasing the
number of Doctors and Nurses M • • 2 50
I9 Marketing campaigns to inform patients about
when to go to ED M • 1 25
I10 Create synergies with the near local healthcare
centres M • • 2 50
I11 Increase security staff of the ED M • • • 75
P/M:Processual/Managerial; Admin:Administrator; MM:Medical Manager; NM:Nursing Manager; NS:Nursing
Supervisor; M:Managerial; P:processual
Table 14. Results of interviews (Process Redesign)
The redesign heuristics was chosen considering both the hospital objectives and the processual improvements. In addition, they were approved by stakeholders during the focus group. The final list of problems, improvements and heuristics can be seen in Table 15 and all the simulated scenarios in Table 16.
Problem Improvement Redesign Heuristic
P1 Work overload I1 Increase the type of resources needed when
needed
H1 Extra
Resources P2 The medical team is
inexperienced
I2 Training session for the medical team H2 Specialist I3 Invest in more expert doctors that will make
work faster and keeping the degree of quality, adjusting the ratio of specialist/non-specialist
P3 Information system is not adjusted to the needs of ED
I4 Improve the IS to fulfil all the needs of the ED and automatically provided notifications to the key-users
H3 Integral Technology I5 Make use of more functionalities of the IS
P4 The patients wait too much time for re-evaluation
I6 Create a notification that alert doctors when results of exams arrive at IS
Redesign Heuristic Devil’s Quadrangle H1 H2 H3 C1 C2 C3 C4 Time Quality
Extra Resources - . • • • •
Specialist - + • • • •
Integral Technology - + • • • •
H1,H2,H3=Heuristic 1,2,3; C1,C2,C3,C4=Combination of Heuristics
Table 16. Combinations of redesign heuristics
4.4.1 Process Simulation (H1) – “Extra Resources”
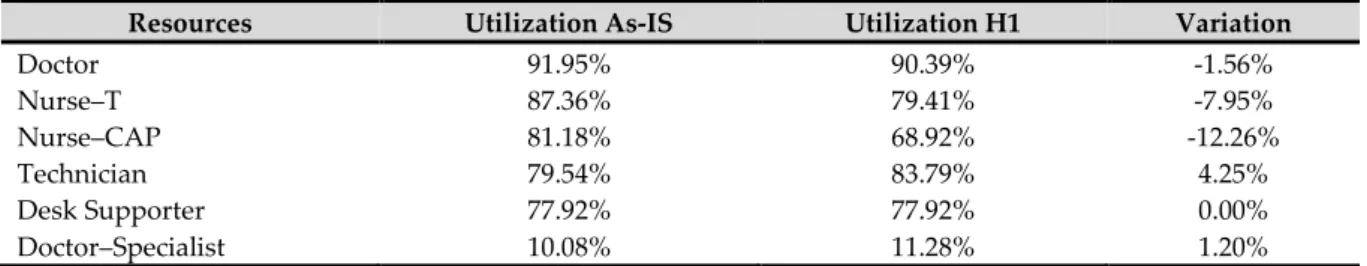
To simulate the “Extra Resources” heuristics the authors increased the number of most used resources by one (Table 17) and results are listed in Table 18. Resources utilization was measured based on information gathered from interviews and on the simulation of the As-Is. According to the Medical Manager, there is a shortage of doctors to respond to the high flow of patients, and the Nursing Manager stated the same regarding nurses.
Results of the simulation are presented in Table 17 and Table 18 details the comparison of those results. It should be noted that the overall maximum and average times of the process decreased 7.3% (6h37m to 6h08min (-29min)) and 7.0% (2h09m to 2h00 (-9min)) respectively.
Process As-Is Process H1
Doctors=11 Doctors=12(+1)
Nurses–CAP=8 Nurses–CAP=9(+1)
Nurses–T=2 Nurses–T=3(+1)
Table 17. Extra Resources
Resources Utilization As-IS Utilization H1 Variation
Doctor 91.95% 90.39% -1.56% Nurse–T 87.36% 79.41% -7.95% Nurse–CAP 81.18% 68.92% -12.26% Technician 79.54% 83.79% 4.25% Desk Supporter 77.92% 77.92% 0.00% Doctor–Specialist 10.08% 11.28% 1.20%
Table 18. Comparison of resources utilization (H1) 4.4.2 Process Simulation (H2) – “Specialist”
Specialist resources can build up routines more quickly and may have more profound knowledge in an area than generalists. As a result, they work more quickly and deliver higher quality. On the other hand, the availability of generalists adds more flexibility to the business process and can lead to better utilization of resources. In this case, the balance should tend towards the specialist. Thus, two options come up: contract more expert doctors than non-experts or provide specific training to non-non-experts in order to specialize them. For simulation, we assumed that the specialisation of doctors could decrease the time of the activities “Medical Observation” and “Re-evaluation” by 10%, as presented in Table 19.
As can be seen in Table 20, the number of patients attended increased by 10 in the overall process. Regarding the whole process, the maximum time increased by 5 minutes (+1.3%) while the average time decreased by 11 minutes (-8.5%). Moreover, Table 21 indicates a
reduction of only 10% of the working time of the “Medical Observation” activity, a 57.6% decrease of the maximum time and a 31.4% decrease of the average time of such activity. On the other hand, the “Re-evaluation” activity has a similar impact regarding times.
Scenario Activity Required Waiting Time (mins) Min. (mins) Avg. (mins) Máx. (mins)
As-Is Medical Observation
- 24 33 61 H2 21.6 29.7 54.9 As-Is Re-evaluation - 15 28 54 H2 13.5 25.2 48.6 Table 19. Scenario H2 Scenario Instances completed Instances started Max. time (h) Avg. time (h) Process As-Is 212 280 6h37m 2h09m H2–Specialist 222 280 6h42m 1h58m Table 20. H2 Simulation
Name Scenario Instances completed Instances started Min. time(m) Max. time(m) Avg. time(m) Medical Observation Process As-Is 146 154 29m 2h12m 1h10m H2-Specialist 158 167 25m 1h16m 48m Variation +12 +13 -4m -56m -22m
Re-evaluation Process As-Is 101 104 20m 1h59m 1h08m
H2-Specialist 111 113 15m 1h07m 42m
Variation +10 +9 -5m -52m -26m
Table 21. H2 Simulation - activities detail
4.4.3 Process Simulation (H3) – “Integral Technology”
The application of this redesign heuristic arises to answer three improvements identified to mitigate specific elicited problems (Table 15). The use of “Integral Technology” redesign heuristic changes the way results of exams are treated. Previously, no one knew when the exam results came to the IS. The doctors had to sporadically go into the patient's record to find out if the exams results were already available there. With the application of this heuristic, it is intended that an alert is created in the IS that notifies the doctor that the results of the exams of a given patient are already available for consultation. Thus, the estimated time between the moment the results of the exams arrive at the IS and the moment the doctor observes the results is reduced by 75%, from 40 minutes to 10 minutes.
Looking at Table 22, the number of patients attended increased by 3. Additionally, the maximum and average times of the whole process decreased by 33 minutes (8.3%) and 5 minutes (3.9%), respectively. There is no significant variance between the activities. Even though positive, the variance of the average time of the whole process is minimal.
5 Results
Overall, the three chosen redesign heuristics decreased both maximum and average process time durations, except for H2 that increased the maximum time by 1.3%. Curiously, H2 is the redesign heuristic with the best impact on average time, applied individually. Thus, one can sustain that these three redesign heuristics, applied individually, provided a positive impact on process durations. The results of all combinations are presented in Table 23. Regarding average times of the whole process, it is possible to see that C4 is the combination of redesign heuristics that better improves the process As-Is. C4 increased the number of patients attended by 28 while the maximum and average times decreased by 29.2% and 22.5% respectively. As can be seen in Table 23, the effect on time is improved when redesign heuristics are combined.
Name Scenario IC IS Min. Max. Avg.
#0 ED (whole process) As-Is 212 280 - 6h37m 2h09m
#0 ED (whole process) H3 215 280 - 6h04m 2h04m
#1 Make admission on ED As-Is 266 268 4m 15m 6m
#1 Make admission on ED H3 266 268 4m 15m 6m
#2 Initiate Triage As-Is 263 266 8m 31m 13m
#2 Initiate Triage H3 263 266 8m 29m 14m
#3 Perform Re-triage As-Is 15 15 4m 18m 9m
#3 Perform Re-triage H3 15 15 4m 18m 8m
#4 Do Medical Observation As-Is 146 154 29m 2h12m 1h10m
#4 Do Medical Observation H3 146 153 31m 2h23m 1h14m
#5 Evaluated for specialist As-Is 6 7 36m 48m 42m
#5 Evaluated for specialist H3 6 7 36m 48m 42m
#6 Do Clinical Analysis and procedures As-Is 70 73 20m 1h21m 44m
#6 Do Clinical Analysis and procedures H3 70 73 20m 1h14m 44m
#7 Do Medical Exams As-Is 58 61 27m 1h32m 56m
#7 Do Medical Exams H3 58 61 27m 1h35m 53m
#8 Make Medical Re-evaluation As-Is 101 104 20m 1h59m 1h08m
#8 Make Medical Re-evaluation H3 104 108 23m 2h15m 1h12m
IC='Instances Completed'; IS='Instances Started' Table 22. H3 Simulation
Scenario
S3 IC IS
Overall times of the process
Variation on overall times of process regarding As-Is Max. time
(h)
Avg. time
(h) Max. Time Avg. Time
As-Is 212 280 6h37m 2h9m - - H1 221 280 6h8m 2h0m -7.3% -7.0% H2 222 280 6h42m 1h58m +1.3% -8.5% H3 215 280 6h4m 2h4m -8.3% -3.9% C1 235 280 5h42m 1h52m -13.9% -13.2% C2 229 280 5h19m 1h53m -19.6% -12.4% C3 229 280 4h55m 1h50m -25.7% -14.7% C4 240 280 4h41m 1h40m -29.2% -22.5%
IC='Instances Completed'; IS='Instances Started.
In Table 24 and Table 25 the results of the simulation of the same combinations of redesign heuristics mentioned in Table 15 are presented for the other two scenarios mentioned in Table 10. The results of these two scenarios are similar to those presented in Table 24. Regarding average time durations, the application of C4 provided a better impact on the main process studied (Scenario S3 in Table 10) by improving the average total time of the process by 22.5%.
Scenario
S1 IC IS
Overall times of the process Variation on overall times of process regarding As-Is
Max. time(h) Avg. time(h) Max. Time Avg. Time
As-Is 161 188 5h43m 1h47m - - H1 162 188 5h31m 1h47m -3.5% 0,0% H2 164 188 5h29m 1h44m -4.1% -2.8% H3 167 188 3h46m 1h36m -34.1% -10.3% C1 165 188 5h24m 1h44m -5.5% -2.8% C2 167 188 3h46m 1h35m -34.1% -11.2% C3 169 188 3h39m 1h31m -36.2% -15.0% C4 169 188 3h39m 1h30m -36.2% -15.9%
IC='Instances Completed'; IS='Instances Started'
Table 24. Final results of all combinations for Scenario S1
On the other hand, regarding maximum time durations, the same combination of heuristics, C4, provided a better impact on Scenario S2 (Table 25) by improving the maximum total time of the process by 37.4%. In terms of patients attended, considering combination C4 as the reference, on scenario S3, 85.7% of patients that entered in the ED were successfully attended. Alternatively, on scenarios S1 and S2, the percentage of patients attended was 89.9% and 90.6%.
Scenario
S2 IC IS
Overall times of the process Variation on overall times of process regarding As-Is
Max. time(h) Avg. time(h) Max. Time Avg. Time
As-Is 202 233 5h56m 1h55m - - H1 203 233 5h16m 1h48m -11.2% -6.1% H2 206 233 5h38m 1h48m -5.1% -6.1% H3 206 233 4h10m 1h40m -29.8% -13.0% C1 206 233 5h15m 1h44m -11.5% -9.6% C2 209 233 4h1m 1h36m -32.3% -16.5% C3 209 233 3h56m 1h32m -33.7% -20.0% C4 211 233 3h43m 1h31m -37.4% -20.9%
IC='Instances Completed'; IS='Instances Started'
Table 25. Final results of all combinations for Scenario S2
Given the simulation data, one can see that the best combination on all scenarios is the C4, which is the combination of the three redesign heuristics. Thus, one can claim that regarding
the problems identified and the improvements proposed, the C4 can be considered as the Process To-Be.
6 Conclusion
Three scenarios were simulated in this research taking in consideration the ED context of a public hospital. Each considering a higher rate of patients per hour than the previous one. S1 has a lower rate and S3 the highest rate. Each of the three heuristics were tested as well as all the possible combinations of them (Table 16).
Conclusions vary regarding the scenario and the combination of heuristics tested. Main conclusions are:
• H1 has a major impact on the maximum LoS of S2 and on the average LoS of S3. Overall, H1 seems to have better results with higher demand of the ED.
• Similarly, H2 also has a major impact on the maximum LoS of S2 and on the average LoS of S3. However, it appears to negatively impact the maximum LoS of S3. • H3 has a considerably positive impact on both the maximum LoS and average LoS
in S1, S2 and S3 (but in this one considerably less than the others). S2 seems to be the scenario that benefits the most from the implementation of this heuristic. • When analysed alone, H3 seems to be the most beneficial heuristic to implement. • As well as all the heuristics alone, C1 gives more benefits with higher demand and
less benefits with lower demand. Therefore, S1 is the worst scenario and S3 the most beneficial.
• On the contrary, C2 and C3 work better with lower demand and benefits decrease as demand increases.
• C4 inverts again and seems to be better for higher demand.
• H3, which is present in C2, C3 and C4, seems to be the most beneficial heuristic for ED. It is curious given the nature of the heuristic (integral technology). This demonstrates the importance of technology in ED.
• Nevertheless, the combination of heuristics points to be more effective instead of implementing heuristics alone.
• BPMN proved to be a very useful tool for modelling and simulating the ED process under study.
On process redesign, the redesign heuristics were properly chosen based on the objectives of the research and the processual improvements and problems pinpointed. The results of the application of each redesign heuristic were analysed and compared with results of process simulation of the process As-Is. The combination of redesign heuristics that better improves the process, in terms of time (and without deteriorating the quality), was selected to be implemented and the process To-Be was defined.
The analysed process proved to be optimised in terms of time duration after the application of the chosen redesign heuristics. The quality, at least, remained the same. On the other hand, the process of data gathering was not easy. The data gathered was not as lean as desired and
it was not possible to get all the information that we were looking for. The data obtained was incomplete.
This investigation also has some limitations. First one may bear in mind that cost was not one of the devil’s quadrangle vectors chosen by the stakeholders and the simulated heuristics are aligned with the chosen vectors. Regarding H1 and H2, increasing the Resources may increase costs with salaries and require more physical space. Another limitation is the counterpart that some heuristics would require to be implemented. Finding more medical staff would not be a problem. Indeed, Portugal has been hiring medical staff from other countries to fulfil internal demand with less investment. While cost may not truly be a problem in this scenario, the physical space is one of the problems pointed by the stakeholders (P5 in Table 15) that can actually be a barrier for the implementation of these heuristics, as many hospitals are aged and do not easily cope with modern demands.
This research represents an important tool to assist any ED with a similar context of the one explored. Professional may use as a decision support tool while academics may see it as a former deep approach of BPM theory in healthcare industry and use it as motivation for further research.
In this way, the findings of the present research are only applicable to the specific ED process studied in the context of a specific public hospital. But further investigation on this topic should be incentivised to generalise and complement the findings as far as possible, as well as to other ED components. The ED presents many areas that could benefit from improving heuristics, and less dependable of human resources: The improvement of triage processes with a larger focus on prioritization; to improve quick response to well-known emergency situations, like stroke or SEPSIS; and to improve operating room usage and quality standards, by addressing operating processes to allow for more efficient use of resources and reducing error. Another interesting possibility is to compare between ED. Additionally, we propose a deepened research on an ED taking into consideration the four constraints of Devil’s Quadrangle.
The paper’s findings, though not being generalised so far, may still offer astute insights to practitioners or researchers who wish to consider more information regarding the importance of improvement of ED through the application of business process redesign heuristics.
References
Baumlin, K. M., Shapiro, J. S., Weiner, C., Gottlieb, B., Chawla, N., & Richardson, L. D. (2010). Clinical Information System and Process Redesign Improves Emergency Department Efficiency. The Joint Commission Journal on Quality and Patient Safety, 36(4), 179-AP1. https://doi.org/https://doi.org/10.1016/S1553-7250(10)36030-2
Benbasat, I., Goldstein, D. K., & Mead, M. (1987). The Case Research Strategy in Studies of Information Systems. MIS Quarterly, 11(3), 369. https://doi.org/10.2307/248684
Bizagi. (2018). Bizagi. Retrieved from www.bizagi.com
Bromley, P. D. B. (1990). Academic contributions to psychological counselling. 1. A philosophy of science for the study of individual cases. Counselling Psychology Quarterly, 3(3), 299– 307. https://doi.org/10.1080/09515079008254261
Buzacott, J. A. (1996). Commonalities in Reengineered Business Processes: Models and Issues.
Davenport, T. H. (1993). Process Innovation: Reengineering Work Through Information Technology.
Harvard Business School Press. Retrieved from
https://books.google.com.br/books?id=9QAHngEACAAJ
De Ramón Fernández, A., Ruiz Fernández, D., & Sabuco García, Y. (2019). Business Process Management for optimizing clinical processes: A systematic literature review. Health
Informatics Journal. https://doi.org/10.1177/1460458219877092
Dickman, D. K., Tong, A., & Davis, G. W. (2012). Snapin is Critical for Presynaptic Homeostatic
Plasticity. Journal of Neuroscience, 32(25), 8716–8724.
https://doi.org/10.1523/JNEUROSCI.5465-11.2012
Dumas, M., La Rosa, M., Mendling, J., & Reijers, H. A. (2018). Fundamentals of Business Process
Management. Berlin, Heidelberg: Springer Berlin Heidelberg.
https://doi.org/10.1007/978-3-662-56509-4
Feibert, D. C., Andersen, B., & Jacobsen, P. (2019). Benchmarking healthcare logistics processes – a comparative case study of Danish and US hospitals. Total Quality Management &
Business Excellence, 30(1–2), 108–134. https://doi.org/10.1080/14783363.2017.1299570
Feibert, D. C., & Jacobsen, P. (2019). Factors impacting technology adoption in hospital bed logistics. The International Journal of Logistics Management, 30(1), 195–230. https://doi.org/10.1108/IJLM-02-2017-0043
Garmann-Johnsen, N. F., & Eikebrokk, T. R. (2017). Dynamic capabilities in e-health innovation: Implications for policies. Health Policy and Technology, 6(3), 292–301. https://doi.org/10.1016/J.HLPT.2017.02.003
Gary, T. (2016). How to do Your Case Study (2nd ed.). Singapore: Sage Publications.
Hammer, M., & Champy, J. (1993). Reengineering the Corporation: A Manifesto for Business
Revolution (Vol. 10). https://doi.org/10.1002/qre.4680100613
Hassan, M. M. D. (2017). An Application of Business Process Management to Health Care
Facilities. The Health Care Manager, 36(2), 147–163.
https://doi.org/10.1097/HCM.0000000000000149
Holden, R. J. (2011). Lean Thinking in Emergency Departments: A Critical Review. Annals of
Emergency Medicine, 57(3), 265–278.
https://doi.org/https://doi.org/10.1016/j.annemergmed.2010.08.001
Hoot, N. R., & Aronsky, D. (2008). Systematic Review of Emergency Department Crowding: Causes, Effects, and Solutions. Annals of Emergency Medicine, 52(2), 126-136.e1. https://doi.org/10.1016/j.annemergmed.2008.03.014
Ippoliti, E. (2015). Heuristic reasoning. (E. Ippoliti, Ed.). Springer International Publishing. https://doi.org/10.1007/978-3-319-09159-4
Jansen-Vullers, M., & Reijers, H. (2005). Business Process Redesign in Healthcare: Towards a Structured Approach. INFOR: Information Systems and Operational Research, 43(4), 321– 339. https://doi.org/10.1080/03155986.2005.11732733
Kelly, A.-M., Bryant, M., Cox, L., & Jolley, D. (2007). Improving emergency department efficiency by patient streaming to outcomes-based teams. Australian Health Review : A
Publication of the Australian Hospital Association, 31(1), 16–21. Retrieved from
http://www.ncbi.nlm.nih.gov/pubmed/17266484
Ko, Y., Zhai, C., & Rodriguez-Zas, S. (2009). Inference of gene pathways using mixture Bayesian networks. BMC Systems Biology, 3(1), 54. https://doi.org/10.1186/1752-0509-3-54 Kumar, A., & Shim, S. J. (2007). Eliminating emergency department wait by BPR implementation. In 2007 IEEE International Conference on Industrial Engineering and
Engineering Management (pp. 1679–1683). IEEE.
https://doi.org/10.1109/IEEM.2007.4419478
Lapão, L. V. (2016). Lean in the Health Management: An opportunity to improve focus on the patient, respect for professionals and quality in the health services. Acta Médica
Portuguesa, 29(4), 237. https://doi.org/10.20344/amp.6615
Leggat, S. G., Bartram, T., Stanton, P., Bamber, G. J., & Sohal, A. S. (2015). Have process redesign methods, such as Lean, been successful in changing care delivery in hospitals? A systematic review. Public Money & Management, 35(2), 161–168. https://doi.org/10.1080/09540962.2015.1007714
Leu, J.-D., & Huang, Y.-T. (2011). An Application of Business Process Method to the Clinical Efficiency of Hospital. Journal of Medical Systems, 35(3), 409–421. https://doi.org/10.1007/s10916-009-9376-4
Leva, A. Di, Sulis, E., & Vinai, M. (2017). Business Process Analysis and Simulation: The Contact Center of a Public Health and Social Information Office. Intelligent Information
Management, 09(05), 189–205. https://doi.org/10.4236/iim.2017.95010
Pereira, R., Almeida, R., & Mira da Silva, M. (2013). How to Generalize an Information Technology Case Study. In 8th Design Science Research in Information Systems and
Technology (DESRIST) (Vol. 7939 LNCS). https://doi.org/10.1007/978-3-642-38827-9_11
Pestana, M., Pereira, R., & Moro, S. (2020). Improving Health Care Management in Hospitals Through a Productivity Dashboard. Journal of Medical Systems, 44(4), 87. https://doi.org/10.1007/s10916-020-01546-1
PORDATA. (2018). PORDATA - Esperança de vida à nascença: total e por sexo. Retrieved
September 17, 2018, from
https://www.pordata.pt/Europa/Esperança+de+vida+à+nascença+total+e+por+sexo-1260
Reijers, H. A., & Liman Mansar, S. (2005). Best practices in business process redesign: an overview and qualitative evaluation of successful redesign heuristics. Omega, 33(4), 283– 306. https://doi.org/10.1016/J.OMEGA.2004.04.012
Şahin, H., Duran, S., Yakıcı, E., & Şahin, M. (2018). Patient classification considering the risk of restenosis after coronary stent placement. Journal of Heuristics.
https://doi.org/10.1007/s10732-018-9394-9
Sherwood-Smith, M. (1994). People Centred Process Re-engineering: An Evaluation Prespective to Office Systems to Re-design. In Proceedings of the IFIP TC8 Open Conference
on Business Process Re-engineering: Information Systems Opportunities and Challenges (pp.
535–544). New York, NY, USA: Elsevier Science Inc. Retrieved from http://dl.acm.org/citation.cfm?id=646303.686970
Testa, A., Cinque, M., Coronato, A., De Pietro, G., & Augusto, J. C. (2015). Heuristic strategies for assessing wireless sensor network resiliency: an event-based formal approach.
Journal of Heuristics, 21(2), 145–175. https://doi.org/10.1007/s10732-014-9258-x
van der Aalst, W. M. P. (2013). Business Process Management: A Comprehensive Survey. ISRN
Software Engineering, 2013, 1–37. https://doi.org/10.1155/2013/507984
van der Aalst, W. M. P., ter Hofstede, A. H. M., & Weske, M. (2003). Business Process
Management: A Survey (pp. 1–12). https://doi.org/10.1007/3-540-44895-0_1
vom Brocke, J., Schmiedel, T., Recker, J., Trkman, P., Mertens, W., & Viaene, S. (2014). Ten principles of good business process management. Business Process Management Journal,
20(4), 530–548. https://doi.org/10.1108/BPMJ-06-2013-0074
Webster, J., & Watson, R. T. (2002). Analyzing the Past to Prepare for the Future: Writing a Literature Review. MIS Quarterly, 26(2), xiii–xxiii. https://doi.org/10.1.1.104.6570
Wüllenweber, K., Beimborn, D., Weitzel, T., & König, W. (2008). The impact of process standardization on business process outsourcing success. Information Systems Frontiers,
10(2), 211–224. https://doi.org/10.1007/s10796-008-9063-x
Yin, R. K. (2009). Case study research and applications: design and methods (5th ed.). Thousand Oaks, CA, USA: SAGE Publications.
Yin, R. K. (2013). Case study research: Design and methods. Sage publications.
Zucker, D. (2009). How to Do Case Study Research. Teaching Research Methods in the Social
Sciences. Retrieved from https://scholarworks.umass.edu/nursing_faculty_pubs/2
Copyright: © 2020 Pereira, Lapão, Bianchi & Amaral. This is an open-access article distributed
under the terms of the Creative Commons Attribution-NonCommercial 3.0 Australia License, which permits non-commercial use, distribution, and reproduction in any medium, provided the original author and AJIS are credited.