F
ACULDADE DEE
NGENHARIA DAU
NIVERSIDADE DOP
ORTOAn Empirical Investigation of Source
Code Metrics and FindBugs Warnings
André Amarante dos Santos Cunha
Master in Informatics and Computing Engineering Supervisor: Rui Maranhão (PhD)
Second Supervisor: Martin Pinzger (PhD)
An Empirical Investigation of Source Code Metrics and
FindBugs Warnings
André Amarante dos Santos Cunha
Master in Informatics and Computing Engineering
Approved in oral examination by the committee:
Chair: Pedro Souto (PhD)
External Examiner: João Saraiva (PhD) Supervisor: Rui Maranhão (PhD)
Abstract
Static software checking tools are useful as an additional automated software inspection step that can easily be integrated in the development cycle and assist in creating secure, reliable and high quality code.
However, an often quoted disadvantage of these tools is that they generate an overly large number of warnings, including many false positives (warnings that do not indicate real bugs) due to the approximate analysis techniques. Therefore, programmers have to spend a considerable amount of time on screening out real bugs from a large number of re-ported warnings, which is time-consuming and inefficient. This information overload can easily hinder the potential benefits of such tools. The tools’ warning prioritization is little help in focusing on important warnings: the maximum possible precision by selecting high priority warning instances.
In this thesis project, we conducted an empirical investigation on the issues detected by a popular bug-finding tool, FindBugs, on 2 open-source Java projects, Tomcat and Axis. We investigate the correlation between source code metrics and warning categories as used by the Java FindBugs tool. This lays the basics for developing a more advanced model for ranking warnings to aid developers in identifying and fixing most severe warn-ings first.
Resumo
As ferramentas de verificação estática de software são úteis como um passo complemen-tar à inspecção automática de software que pode ser facilmente integrado no ciclo de desenvolvimento e ajudar a produzir código seguro, fidedigno e de alta qualidade.
No entanto, uma desvantagem frequentemente mencionada destas ferramentas é que geram uma grande quantidade de warnings, incluindo vários falsos positivos (warnings que não indicam bugs reais) devido à imprecisão das técnicas de análise. Acontece, por-tanto, que os programadores terão de perder muito tempo a identificar quais são os bugs reais a partir de um longo relatório de warnings. Esta informação excessiva pode difi-cultar os potenciais benefícios deste tipo de ferramentas. O seu sistema de prioridades é uma pequena ajuda para os programadores se focarem nos warnings mais importantes: a máxima precisão, ao seleccionar os warnings de maior prioridade.
Nesta tese, conduzimos uma investigação empírica sobre os warnings detectados por uma ferramenta de localização de bugs popular, FindBugs, em 2 projectos Java open-source, Tomcat e Axis. Investigamos as correlações entre métricas do código fonte e categorias dos warnings como usadas pela ferramenta Java FindBugs. Isto estabelece uma base para desenvolver um modelo mais avançado para priorizar warnings de forma a ajudar os programadores a identificar e corrigir os warnings mais importantes em primeiro lugar.
Acknowledgements
I would like to take this opportunity to thank my supervisors Rui and Martin for helping and guiding me during this process.
I would also like to say thanks to all of the friends I have met in here and i hope they will always remain like that.
One special thanks to my parents, Isabel and José, for providing me this chance which was probably the best experience of my life. I am also grateful of my aunt Teresa and my grandparents Fernado and Celina for all of their concern relating my well being.
Finally, my best regards to my brother Rui Pedro who has always supported me and to all of my friends in Portugal, specially to my friend Marta for motivating and helping me in every way as possible.
André Amarante dos Santos Cunha Delft, the Netherlands
Contents
1 Introduction 1
1.1 Context . . . 1
1.2 Motivation and goals . . . 1
1.3 Coding standards . . . 2
1.4 Automated inspection tools . . . 3
1.4.1 FindBugs . . . 3
1.5 Source code metrics . . . 4
1.5.1 State Of Flow Eclipse Metrics . . . 5
1.6 Contributions . . . 6
1.7 Thesis outline . . . 7
2 Related Work 9 2.1 Issues of MISRA Standard . . . 9
2.2 Automated inspection tools . . . 9
2.3 Static profiling . . . 10
2.4 Prioritizing results statically . . . 10
2.5 Bug-fixes approach . . . 11
2.5.1 Software Configuration Management . . . 11
2.5.2 Revision Control Systems . . . 12
2.5.3 Defect Tracking Systems . . . 13
2.5.4 Bug-introducing changes . . . 13
2.5.5 History-Based Rule Selection . . . 14
2.6 Summary . . . 15
3 Research questions and approach 17 3.1 Purpose and Problem . . . 17
3.2 Research Question . . . 17
3.3 Approach . . . 18
3.4 Summary . . . 19
4 Implementation 21 4.1 Findbugs . . . 21
4.2 State of Flow Eclipse Metrics . . . 22
4.3 Merging algorithm . . . 22
4.4 Statistical Analysis . . . 28
4.5 Workflow of experiments . . . 30
CONTENTS
5 Empirical Evaluation 33
5.1 Experiment setup . . . 33
5.2 Description of the subject systems . . . 34
5.3 Results . . . 34
5.3.1 Tomcat . . . 36
5.3.2 Axis . . . 47
5.4 Answers to research questions . . . 57
5.5 Threats to Validity . . . 58
5.6 Summary . . . 58
6 Conclusions and Future Work 61 6.1 Conclusions . . . 61
6.2 Future Work . . . 62
References 63 A Tools instalation 69 A.1 FindBugs . . . 69
A.2 State of Flow Eclipse Metrics . . . 70
B Merging Algorithm 71 B.1 script.py . . . 71
List of Figures
3.1 Approach workflow . . . 19
4.1 Script’s Class declaration - ClassMetrics . . . 23
4.2 Script’s Class declaration - Method . . . 24
4.3 Script’s Class declaration - Warning . . . 24
4.4 Script’s Body - methods.csv parsing . . . 25
4.5 Script’s Body - types.csv parsing . . . 26
4.6 Script’s Body - warnings matching . . . 26
4.7 Script - Maximum value of each methods’ metrics calculation . . . 27
4.8 Script - Header computation . . . 27
4.9 Script - Print the results into metrics+warnings.csv file . . . 28
4.10 Implementation workflow . . . 30
5.1 Histograms of Number of Parameters, Levels, and Locals in Scope met-rics (Tomcat) . . . 37
5.2 Histograms of Cyclomatic Complexity, Number of Statements and Lines of Code metrics (Tomcat) . . . 38
5.3 Histogram of Feature Envy metric (Tomcat) . . . 38
5.4 Histograms of Lack of Cohesion in Methods (PFI, HS, TC) metric (Tomcat) 39 5.5 Histograms of Lack of Cohesion in methods (CK), Efferent Couplings and Number of Levels metrics (Tomcat) . . . 40
5.6 Histogram of Weighted Methods Per Class metric (Tomcat) . . . 40
5.7 Histograms of Performance and Malicious Code warnings’ categories (Tom-cat) . . . 41
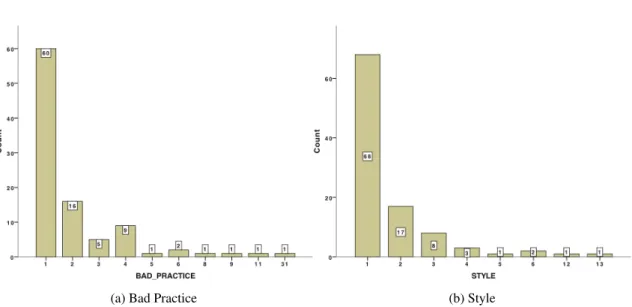
5.8 Histograms of Bad Practice and Style warnings’ categories (Tomcat) . . . 42
5.9 Histograms of MT Correctness and Correctness warnings’ categories (Tom-cat) . . . 43
5.10 Histograms of Experimental and Security warnings’ categories (Tomcat) . 43 5.11 Histograms of Number of Parameters, Levels, and Locals in Scope met-rics (Axis) . . . 48
5.12 Histograms of Cyclomatic Complexity, Number of Statements and Lines of Code metrics (Axis) . . . 49
5.13 Histogram of Feature Envy metric (Axis) . . . 49
5.14 Histograms of Lack of Cohesion in Methods (PFI, HS, TC) metric (Axis) 50 5.15 Histograms of Lack of Cohesion in methods (CK), Efferent Couplings and Number of Levels metrics (Axis) . . . 51
LIST OF FIGURES
5.17 Histograms of Performance and Malicious Code warnings’ categories (Axis) 52
5.18 Histograms of Bad Practice and Style warnings’ categories (Axis) . . . . 53
5.19 Histograms of MT Correctness and Correctness warnings’ categories (Axis) 54
List of Tables
5.1 Case studies inspection results . . . 34
5.2 Median and maximum values of methods’ source code metrics for Tomcat 36
5.3 Median and maximum values of types’ source code metrics for Tomcat . . 39
5.4 Median, maximum, total and rate values of warnings’ categories (Tomcat) 41
5.5 Spearman correlation between methods’ metrics and warnings’ categories
(Tomcat) . . . 44
5.6 Spearman correlation between types’ metrics and warnings’ categories
(Tomcat) . . . 44
5.7 Median and maximum values of methods’ source code metrics for Axis . 47
5.8 Median and maximum values of types’ source code metrics for Axis . . . 50
5.9 Median, maximum, total and rate values of warnings’ categories (Axis) . 52
5.10 Spearman Correlation between methods’ metrics and warnings’ categories (Axis) . . . 55
5.11 Spearman Correlation between types’ metrics and warnings’ categories (Axis) . . . 55
Abbreviations
CSV Comma-separated values
IDE Integrated development environment
JRE Java Runtime Environment
JDK Java Development Kit
OO Object-oriented
PASW Predictive Analytics SoftWare
SCM Software configuration management
SOAP Simple Object Access Protocol
SVN Subversion
W3C World Wide Web Consortium
WWW World Wide Web
Chapter 1
Introduction
This chapter introduces all aspects that form the context, motivations and goals of this thesis project. We also describe the main terms and the background used throughout this dissertation. We present the problem statements as well as an overview of contributions. Finally, it is presented the outline used in this document.
1.1
Context
This thesis research is inserted in Software Engineering group, more properly, the Soft-ware Testing and Quality area. This work is a contribution to the field of automated inspection tools warning’s prioritizing. The full process of researching, results analysis and report writing was carried out in the Department of Software Technology - Soft-ware Engineering Research Group of the Faculty Electrical Engineering, Mathematics and Computer Science on Delft University of Technology in Delft, the Netherlands1.
1.2
Motivation and goals
Software inspection [Fag76] is widely recognized as an effective technique to assess and
improve software quality and reduce the number of defects [Rus91, WBM96,PSMV98,
WAP+02]. Software inspection involves carefully examining the code, design, and doc-umentation of software and checking them for aspects that are known to be potentially problematic based on past experience.
It is generally accepted that the cost of repairing a defect is much lower when that de-fect is found early in the development cycle. One of the advantages of software inspection
Introduction
is that the software can be analyzed even before it is tested. Therefore, potential problems are identified and can be solved early, when it is still cheap to fix them.
In this thesis, we focus on tools that perform automatic code inspection. Such tools allow early (and repeated) detection of defects and anomalies which helps to ensure soft-ware quality, security and reliability. Most defect detection techniques are built around static analysis of the code. In addition, various dedicated static program analysis tools are available that assist in defect detection and writing reliable and secure code.
However, such static analyses come with a price: in the case that the algorithm cannot ascertain whether the source code at a given location obeys a desired property or not, it will make the safest approximation and issue a warning, regardless of the correctness. This conservative behavior can therefore lead to false positives, incorrectly signaling a
problem with the code. Kremenek and Engler [KE03] observed that program analysis
tools typically have false positive rates ranging between 30–100%. In addition, the in-creased scrutiny with which the code is examined can lead to an explosion in the number of warnings generated, especially when the tool is introduced later in the development process or during maintenance, when a significant code base already exists.
To cope with the large number of warnings, users resort to all kinds of (manual) filter-ing processes, often based on the perceived impact of the underlyfilter-ing fault. Even worse, this information overload often results in complete rejection of the tool, especially in cases where the first defects reported by the tool turn out to be false positives.
In this thesis, we aim at helping user of automated code inspection tools to deal with this information overload. We investigate the correlation between source code metrics and warning categories as used by the Java FindBugs [cit10f] tool. This lays the basics for developing a more advanced model for ranking warnings to aid developers in identifying and fixing the most severe warnings first .
1.3
Coding standards
Coding standards [cit10d] are a set of guidelines for a specific programming language that recommend a programming style, practices and methods for each aspect of a piece pro-gram written in this language. These conventions usually cover file organization, indenta-tion, comments, declarations, statements, white space, naming conventions, programming practices and etc. These are not enforced by compilers. As a result, not following some or all the rules has no impact on the executable programs created from the source code.
These standards are becoming more popular because it makes sure that the software quality is secured, enhancing its maintainability, portability and reliability. The rules within these standards are, usually, based on the experts’ opinions, which have years of experience relating a certain language in different contexts. MISRA C:2004 [cit04] is one of the most used software development standard for the C programming language.
Introduction
1.4
Automated inspection tools
Coding standards have become increasingly popular as a mean to ensure software quality throughout the development process. Different tools have appeared, along the years, with the intent of automating the checking of rules in a standard in order to help developers locating potentially difficult or problematic areas in the source code using techniques such as syntactic pattern matching, data flow analyses, type systems, model checking and theorem proving. Many of these tools check for the same kinds of programming mistakes. There are commercial and academic tools which generally come with their own sets of rules, but can often be adapted allowing that custom standards can be also checked automatically. Two examples of these kind of tools for Java programming language are FindBugs and PMD2[cit10g].
1.4.1 FindBugs
Next, we briefly introduce the background of FindBugs and the structure of error reports. FindBugs, one of the most popular static analysis tools, is becoming widely used in Java
community3. FindBugs implements a set of bug detectors for a variety of common bug
patterns (code idioms that are likely to be errors), and uses them to find a significant number of bugs in real-world applications and libraries. For instance, FindBugs plays an essential role in the development of Java programs in Google.
Bug patterns in FindBugs are mainly divided into eight categories, that is Bad Prac-tice, Correctness, Experimental, Malicious code vulnerability, Multithreaded correctness, Performance, Security, and Style. For those experienced users, they can define new bug patterns according to their needs. According to the report structure of FindBugs, each bug category includes many bug kinds and each bug kind consists of several bug pat-terns. Then, we present a brief category description relating the ones which meaning is not evident:
Correctness bug Probable bug - an apparent coding mistake resulting in code that was probably not what the developer intended. It strives for a low false positive rate. Bad Practice Violations of recommended and essential coding practice. Examples
in-clude hash code and equals problems, cloneable idiom, dropped exceptions, serial-izable problems, and misuse of finalize. It strives to make this analysis accurate, although some groups may not care about some of the bad practices.
Style Code that is confusing, anomalous, or written in a way that leads itself to errors. Examples include dead local stores, switch fall through, unconfirmed casts, and 2PMD developers don’t know the meaning of the letters. They just think the letters sound good together.
Introduction
redundant null check of value known to be null. There are more false positives accepted.
Experimental These results are from running FindBugs 1.2.0 at standard effort level. These do not include any low priority warnings or any warnings about vulnerabili-ties to malicious code. Although FindBugs developers have (repeatedly) manually audited the results, they haven’t manually filtered out false positives from these warnings, so that we can get a feeling for the quality of the warnings generated by FindBugs.
1.5
Source code metrics
We best manage what we can measure. A source code metric is a measure of some property of a piece of software source code. It is very difficult to satisfactorily define or measure "how much" software there is in a program. The practical utility of software measurements has thus been limited to narrow domains where they include:
• Size
• Complexity • Quality
Measurement enables the organization to improve the software process; assists in planning, tracking and controlling the software project and assess the quality of the soft-ware thus produced. It is the measure of such specific attributes of the process, project and product that are used to compute the software metrics. Metrics are analyzed and they provide a dashboard to the management on the overall health of the process, project and product. Generally, the validation of the metrics is a continuous process spanning mul-tiple projects. The kind of metrics employed generally account for whether the quality requirements have been achieved or are likely to be achieved during the software develop-ment process. As a quality assurance process, a metric is needed to be revalidated every time it is used. In general, for most software quality assurance systems the common soft-ware metrics that are checked for improvement are the Source lines of code, cyclomatic complexity of the code, number of classes and interfaces, cohesion and coupling between the modules etc.
Software Quality Metrics focus on the process, project and product. By analyzing the metrics the organization can take corrective action to fix those areas in the process, project or product which are the cause of the software defects.
Introduction
1.5.1 State Of Flow Eclipse Metrics
This Eclipse [cith] plugin calculates various metrics for source code during build cycles and warns, via the Problems view, of ’range violations’ for each metric. This allows to stay continuously aware of the health of the code base. We may also export the metrics to HTML for public display or to CSV or XML format for further analysis. This export can be performed from within Eclipse or using an Ant task.
The method’s metrics addressed in this thesis are the following:
Cyclomatic Complexity This metric is an indication of the number of ’linear’ segments in a method (i.e. sections of code with no branches). It can also be used to indicate the psychological complexity of a method [citp].
Feature Envy Feature Envy occurs when a method is more interested in the features (methods and fields) of other classes than its own [citj].
Lines of Code in Method This measure indicates the number of lines a method occu-pies. A line is determined by the presence of a newline character. It is a very basic measure of size and is susceptible to variation purely on the basis of different for-matting styles [citn].
Number of Locals in Scope This metric is an indication of the maximum number of lo-cal variables in scope at any point in a method. The idea of the metric is that a large Number Of Locals In Scope increases complexity and reduces comprehensi-bility [citu].
Number of Levels This metric is an indication of the maximum number of levels of nest-ing in a method. The idea of the metric is that a large Number Of Levels increases complexity and reduces comprehensibility. All methods that have a large Number Of Levels can be simplified by extracting private methods or by creating a Method Object, raising the level of abstraction [citt].
Number of Parameters This metric is a count of the number of parameters to a method. Methods with a large Number Of Parameters often indicate that classes are missing from the model. Most methods that have a large Number Of Parameters can be simplified by grouping parameters into a number of related sets and making classes from those sets. This leads to an increase in maintainability [citv].
Number of Statements This metric represents the number of statements in a method. A large number of statements is not in itself a bad thing, it does suggest the possibility
Introduction
of extracting methods which gives related groups of statements a name and there-fore increases the level of abstraction and deepens semantics [citw].
The type’s metrics addressed in this thesis are the following:
Efferent Couplings This metric is a measure of the number of types the class being mea-sured ’knows’ about. In short, all types referred to anywhere within the source of the measured class. A large efferent coupling can indicate that a class is unfocussed and also may indicate brittleness, since it depends on the stability of all the types to which it is coupled. Efferent coupling can be reduced by extracing classes from the original class (i.e. decomposing the class into smaller classes) [citi].
Lack of Cohesion in Methods Cohesion is an important concept in OO programming. It indicates whether a class represents a single abstraction or multiple abstractions. The idea is that if a class represents more than one abstraction, it should be refac-tored into more than one class, each of which represents a single abstraction. We have selected four definitions of lack of cohesion. That of Chidamber and Kemerer, that of Henderson and Sellers, Total Correlation and Pairwise field irrelation [citm]. Number of Fields This metric represents the number of fields in a class. Although a large number of fields is not necessarily an indication of bad code, it does suggest the possibility of grouping fields together and extracting classes, taking appropriate methods as well [cits].
Weighted Methods Per Class This metric is the sum of cyclomatic complexities of meth-ods defined in a class. It therefore represents the cyclomatic complexity of a class as a whole and this measure can be used to indicate the development and mainte-nance effort for the class. Classes with a large Weighted Methods Per Class value can often be refactored into two or more classes [web].
1.6
Contributions
The main propose of this study is to answer the following research questions:
• Is there any correlation between source code metrics and FindBugs warnings’ cat-egories?
Introduction
This thesis makes the following contributions:
• A correlation between source code metrics and warning categories approach for de-veloping a more advanced model for ranking warnings. This includes an approach to observe the warnings output by one bug-finding tool for two subject programs, collecting its source code metrics, and a study of statistics analysis (Section3.3). • Analysis of empirical data. The results are presented in Section 5.3: it contains
two parts: (1) analysis of Tomcat system, in Section 5.3.1; (2) analysis of Axis system in Section5.3.2; further empirical data includes histograms and descriptive statistics of source code metrics for both projects in Subections5.3.1.1and5.3.2.1
respectively. We will also present histograms and descriptive statistics for FindBugs warnings’ categories for the projects in Subsections5.3.1.2and 5.3.2.2respectively. Ultimetaly, in the Subsections 5.3.1.3and5.3.2.3, we have studied the relationship between the source code metrics and warnings’ categories for Tomcat and Axis.
1.7
Thesis outline
This thesis is organized as follows. Besides the introduction, it has more 5 chapters. The
Chapter2 is dedicated to present some other research teams who have worked in areas
related to our research. Our work is partially based on some of their contributions.
In the Chapter 3, we describe the purpose and introduce the problem. Next, we
de-scribe the approach used to investigate the research questions.
Implementation is described in Chapter 4. We explain how to use and setup Eclipse, FindBugs and State of Flow Eclipse metrics to collect all the information needed. Next, we explain the algorithm used to merge all that data. Finally we go into detail of statistical analysis of source-code metrics and warnings’ categories.
In the Chapter5, we report on the experiments to provide the answers to our research questions. It is presented the experimental setup and a short description of the projects that we choose to perform the experiments. Ultimately, we discuss the threats to validity of the experimental results.
Finally, in chapter6, we present the final conclusions of the research, along the main contributions of this project and future lines of work.
Chapter 2
Related Work
The main focus of this chapter is to present the actual literature about this thesis’ subject. We present a summary that includes the most relevant researches done about this matter. We also make brief references to prior work whenever that is in order.
2.1
Issues of MISRA Standard
The idea of a safer subset of a language, the precept on which the MISRA coding stan-dard is based, was promoted by Hatton [Hat95]. In [Hat03], he assesses a number of coding standards, introducing the signal to noise ratio for coding standards, based on the difference between measured violation rates and known average fault rates. He assessed
MISRA C 2004 in [Hat07], arguing that the update was no real improvement over the
original standard, and “both versions of the MISRA C standard are too noisy to be of any real use”.
2.2
Automated inspection tools
Software inspection tools have been studied widely. Zitser et al. evaluated several open source static analyzers with respect to their ability to find known exploitable buffer over-flows in open source code [ZLL04]. Engler et al. evaluate the warnings of their defect detection technique in [ECC01].
In [RAF04], it was examined the results of applying five tools, specifically Bandera, ESC/Java 2, FindBugs, JLint and PMT, to a variety of Java programs over different check-ing tasks. Thereby it was possible to cross-check their bug reports and warncheck-ings. In ex-perimental results it was showed that none of the tools can fully replace one-another, and indeed the tools often find non-overlapping bugs (mostly warnings are distinct). There is
Related Work
also no correlation of warning counts between pairs of tools. Therefore, it was proposed a meta-tool which combines the output of the tools together, looking for particular lines of code, methods, and classes that many tools warn about. Thus it enables to precisely identify false positives and false negatives. Summarizing, this meta-tool automatically combine and correlate their output. It was concluded that the main difficulty in using the tools is simply the quantity of output (mostly because of false positives).
Wagner et al. compared results of defect detection tools with those of code reviews and software testing [WJK+05]. Their main finding was that bug detection tools mostly find different types of defects than testing, but find a subset of the types found by code reviews. Warning types detected by a tool are analyzed more thoroughly than in code reviews.
Heckman et al. proposed a benchmark and procedures for the evaluation of software inspection prioritization and classification techniques, focused at Java programs [HW08].
2.3
Static profiling
Static profiling is used in a number of compiler optimizations or worst-case execution time (WCET) analyses. By analyzing program structure, a prediction is made as to which portions of the program will be most frequently visited during execution. Since this heav-ily depends upon branching behavior, some means of branch prediction is needed. This can range from simple and computationally cheap heuristics to expensive data flow based analyses such as constant propagation [KR00] [SRH95] [Bin94] or symbolic range prop-agation [VCH96] [BE96] [Pat95]. However, only [WL94] [WMGH94] compute a com-plete static profile.
2.4
Prioritizing results statically
In recent years, many solutions have been proposed to reduce the number of inspected violations and, instead, emphasis on the most relevant ones, according to some criterion.
The classical approach most automated inspection tools use for prioritizing and filter-ing results is to classify the results based on several levels (statically). Such levels are associated with the type of defects detected; they are obvious of the actual code that is being analyzed and of the location or frequency of a given defect. Therefore, the ordering and filtering that can be achieved while using this technique is rather crude.
Kremenek and Engler [KE03], proposed Z-ranking, a statistical approach to reduce
the number of false positives due to inaccurate static analysis. With that technique it is possible to rank the output of static analyses tools so that more important warnings will tend to be ranked more highly. Z-Ranking is intended to rank the output of a particular bug checker. They prioritize checks (warning categories) using the frequency of check results.
Related Work
Software checkers output success (indicating a successful check of an invariant) or failure (the invariant did not hold). If the ratio of successes to failures is high, the failures are assumed to be real bugs. If we apply this idea to warning categories, a warning category that has fewer warning instances is important.
In [BM06], Boogerd and Moonen presented ELAN, a technique that helps the user
to prioritize the information generated by a software inspection tool. It is based on a demand-driven computation of the likelihood that execution reaches the locations for which warnings are reported using static profiling. Their goal was to help the user of automated inspection tools to deal with the information overload. Instead of focusing on improving a particular defect detection technique in order to reduce false positives, they strive for a generic prioritization approach that can apply the results of any software inspection tool and assists the user in selecting the most relevant warnings. However, a location which has low execution likelihood or warnings at the location could be impor-tant. In fact, severe bugs in lines with low chance of execution are more difficult to detect. Summarizing they use execution likelihood analysis to prioritize warning instances. For each warning location, they compute the execution likelihood of the location. If the loca-tion is very likely to be executed, the warning gets a high priority. If the localoca-tion is less likely to be executed, the warning gets a low priority.
2.5
Bug-fixes approach
2.5.1 Software Configuration Management
Software configuration management (SCM) [cit10h] is the task of tracking and controlling changes in the software. It is responsible for the management of changes to documents, programs, and other information stored as computer files. It is most commonly used in software development. Configuration management practices include revision control and the establishment of baselines.
In recent years, many approaches have been proposed that benefit from the combi-nation of data present in SCM systems and issue databases. Applications range from an examination of bug characteristics [LTW+06], techniques for automatic identification of bug- introducing changes [SZZ05,KZPW06], bug-solving effort estimation [WPZZ07], prioritizing software inspection warnings [KE07] prediction of fault-prone locations in the source [KE07].
Williams and Hollingsworth [WH05] use software change histories to improve exist-ing bug-findexist-ing tools. When a function returns a value, usexist-ing the value without checkexist-ing it may be a potential bug. The problem is that there are too many false positives if a bug-finding tool warns all source code that uses unchecked return values. To remove the false positives, Williams and Hollingsworth use the software histories and find what kinds of
Related Work
function return values must be checked. They leverage the software history to remove false positives. However, they only focus on the small sets bug patterns such as return value checking and it is not generic to all warnings.
Li et al. analyze and classify fault characteristics in two large, representative open-source projects based on the data in their SCM systems [LTW+06]. Rather than using software inspection results they interpret log messages in the SCM.
2.5.2 Revision Control Systems
Revision control system [citx] is an important component of Software Configuration man-agement. This system can record the history of sources files and documents keeping track of all work and all changes in a set of files. Changes are usually identified by a number or letter code, termed the "revision number", "revision level", or simply "revision". Each revision is associated with a timestamp and the person making the change. Revisions can be compared, restored, and with some types of files, merged. This way, it allows sev-eral developers (potentially widely separated in space and/or time) to collaborate. One of the most currently used RVS is SVN (Subversion) [cit10i] which is a mostly-compatible successor of the widely used CVS (Concurrent Versions System) [cit10e].
Fischer et al. [FPG03] introduced an approach in order to populate a release history database that combines version data with bug tracking data and adds missing data not cov-ered by version control systems such as merge points. Then simple queries can be applied to the structured data to obtain meaningful views showing the evolution of a software project. Such views enable more accurate reasoning of evolutionary aspects and facilitate the anticipation of software evolution. They demonstrate their approach on a large Open Source project Mozilla that offers great opportunities to compare results and validate their approach.
Spacco et al. [SHP06] observed FindBugs warning categories across software
ver-sions measuring lifetimes of warning categories, warning number rates and the degree if decay using warning numbers. They said it is important to be able to track the occurrence of each potential defect over multiple versions of a software artifact under study to deter-mine when warnings reported in multiple versions of the software all correspond the same underlying issue. One motivation for this capability is to remember decisions about code that has been reviewed and found to be safe despite the occurrence of a warning. Another motivation is constructing warning deltas between versions, showing which warnings are new, which have persisted, and which have disappeared. This allows reviewers to focus their efforts on inspecting new warnings. Finally, tracking warnings through a series of software versions reveals where potential defects are introduced and fixed, and how long they persist, exposing interesting trends and patterns. They discussed two different tech-niques they have implemented in FindBugs for tracking defects across versions, discussed
Related Work
their relative merits and how they can be incorporated into the software development pro-cess, and discuss the results of tracking defect warnings across Sun’s Java runtime library.
Kim et al. [KPW06] presented a bug finding algorithm using bug fix memories: a
project-specific bug and fix knowledge base developed by analyzing the history of bug fixes. A bug finding tool, BugMem, implements the algorithm. Bug fix memories use a learning process, so the bug patterns are project-specific and these can be detected. The algorithm and tool are assessed by evaluating if real bugs and fixes in project histories can be found in the bug fix memories. Source code repositories such as CVS and Subversion are contains knowledge that can be used to discriminate between good and bad source code.
Basalaj takes an alternative viewpoint and studies single versions from 18 different projects Basalaj [Bas05]. These are used to compute two rankings, one based on ings generated by QA C++, and one based on known fault data. For 12 out of 900 warn-ing types, a positive rank correlation between the two can be observed . Wagner et al. [WDA+08] evaluated two Java defect detection tools on two different software projects. They investigated whether inspection tools were able to detect defects occurring in the field. Their study could not confirm this possibility for their two projects.
2.5.3 Defect Tracking Systems
Defect Tracking System [cit10a] is a software application designed to help quality as-surance allowing individual or groups of developers to keep track of outstanding bugs in their product effectively. A major component of a bug tracking system is a database that records facts about known bugs. Facts may include the time that a bug was reported, its severity, the erroneous program behavior, and details on how to reproduce the bug; as well as the identity of the person who reported it and any programmers who may be working on fixing it . Typical bug tracking systems support the concept of the life cycle for a bug which is tracked through status assigned to the bug. A bug tracking system should allow administrators to configure permissions based on status, move the bug to another status, or delete the bug. The system should also allow administrators to configure the bug statuses and to what status a bug in a particular status can be moved. Some systems will e-mail interested parties, such as the submitter and assigned programmers, when new records are added or the status changes [cit10b]. Bugzilla [cit10c] is one of the most favorite system between hundreds of organizations across the globe.
2.5.4 Bug-introducing changes
A bug-introducing change is the modification in which bug was injected into the software. Subsequently, a bug-fix change exists when a developer modifies the project’s source code and repairs the bug.
Related Work
Software evolution research leverages the history of changes and bug reports that ac-cretes over tine in SCM systems and bug tracking systems to improve the understanding of how a project has grown. It offers the possibility that by examining the history of changes made to a software project, we might better understand patterns of bug introducing, and raise developer awareness that they are working on risky sections of a project.
Kim et al. [KZPW06] presented algorithms to automatically and accurately identify bug-introducing changes. Bug-introducing changes are important information for under-standing properties of bugs, mining bug prone change patterns, and predicting future bugs. They remove false positives and false negatives by using annotation graphs, by ignoring non-semantic source code changes and outlier fixes.
2.5.5 History-Based Rule Selection
This approach has the purpose to use software and issue archives to link standard viola-tions to known bugs. That information can then be used to address two practical issues in using a coding standard: which rules to adhere to and how to rank violations of those rules focusing on the historical fault likelihood to prioritize violations.
In [KE07], Kim and Ernst discovered that using a historical fault likelihood to pri-oritize warnings improved accuracy on fault detection. Their goal is to propose a new, program-specific prioritization that more effectively directs developers to errors. The new history-based warning prioritization (HWP) is obtained by mining the software change history for removed warnings during bug fixes. A version control system indicates when each file is changed. A software change can be classified as a fix-change or a non-fix change. A fix-change is a change that fixes a bug or other problem. A non-fix change is a change that does not fix a bug, such as a feature addition or refactoring. The underlying intuition is that if warnings from a category are eliminated by fix-changes, the warnings are important. Suppose that during development, a bug-finding tool would issue a warn-ing instance from the Overflow category. If a developer finds the underlywarn-ing problem and fixes it, the warning is probably important. They do not assume the software developer is necessarily using the bug-finding tool. On the other hand, if a warning instance is not removed for a long time, then warnings of that category may be neglectable, since the problem was not noticed or was not considered worth fixing. Using this intuition, they set a weight for each warning category to represent its importance. The weight of a category is proportional to the number of warning instances from that category that are eliminated by a change, with fix-changes contributing more to the weight than non-fix changes. The weight of each category determines its priority.
Related Work
2.6
Summary
Coding standards and automated inspection tools help to prevent the introduction of faults in software. However, one of the main issues with these tools is that they are notorious for producing an overload of non-conformace warnings revealing about 30% of false pos-itives [KAYE04]. Manual inspection of these violations adds a significant overhead for developers. Therefore, it is needed a trade-off algorithm which identifies the warnings to resolve. The algorithm should identify the "critical" violations that will most likely lead to an error hence need to be addressed first.
There are several approaches that may be used in order to resolve two practical issues related to the use of coding standards: which rules should be accepted and how to rank these rules’ violations.
Chapter 3
Research questions and approach
In Section3.1, we describe the thesis problem in more detail. In Section5.3it is presented the research questions. Finally, in Section3.3, we expose an abstract explanation of the approach adopted.
3.1
Purpose and Problem
Current bug-finding tools report a high number of false positives warnings: most warnings do not indicate real bugs. Usually bug-finding tools assign important warnings high prior-ity. However, the prioritization of warnings tends to be ineffective leaving it to developers to select the warnings to be addressed first.
In this thesis project, we investigate the correlation between source code metrics and warning categories used by one Java bug-finding tool. Therefore, we observe the warnings output by one bug-finding tool for two subject programs. We also collect source code metrics from these systems. Ultimately, we study the statistics analysis.
This lays the basics for developing a more advanced model for ranking warnings to aid developers in identifying and fixing the most severe warning first.
3.2
Research Question
The main propose of this study is to answer the following research questions:
• Is there any correlation between source code metrics and FindBugs warnings’ cat-egories?
More specifically, we wanted to know if a type (class) with a certain metric, for instance, high cyclomatic complexity, can lead to warnings of a particular category, for example performance.
Research questions and approach
• Are the same correlations significant across projects?
Although we chose two cases, their results may be different. Answering this ques-tion this will tell us whether we can select a generic set of correlaques-tions, important for either all projects or a certain type of project.
The approach used to address this problem can be found in section3.3.
3.3
Approach
In order to provide the answers to the research questions, we have used two open-source Java applications as case studies, Tomcat and Axis.
We have started by running the Eclipse IDE to import the projects. We choose Eclipse because it is one of the most used IDE for Java language and has an extensible plugin system.
We have used FindBugs as bug-finding tool to compute the warnings. It is one of the most used bug-finding tool in software engineering community and it has a great plugin for Eclipse. It has also a standard version with command line, ant, and Swing interfaces but it is harder to setup.
State Of Flow Eclipse Metrics is the metric collector we have chosen. As we prefer to work with eclipse plugins due its simplicity we have not so many options. However, this one gives the most important metrics of a project in a very useful way.
We have also developed a script which filters and merges all the desired data (source code metrics and warnings) by class.
Finally, we use that data as input to PASW Statistics tool. We present histograms and descriptive statistics for source code metrics and warnings’ categories. It is also studied the relationship between the source code metrics and warnings’ categories.
Research questions and approach
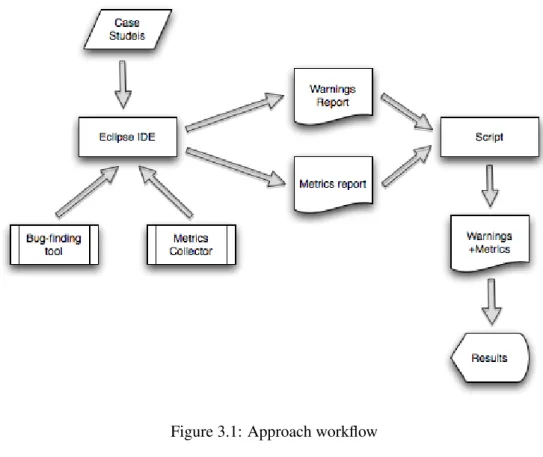
Figure 3.1: Approach workflow
3.4
Summary
Current tools to check coding standards report a high number of false positives warnings. The warnings’ prioritization also tends to be ineffective leaving it to developers to select the warnings to be addressed first. In this thesis project, we investigate the correlation between source code metrics and warning categories used by one Java bug-finding tool. This lays the basics for developing a more advanced model for ranking warnings to aid developers in identifying and fixing the most severe warning first.
The main propose of this study is to answer the following research questions:
• Is there any correlation between source code metrics and FindBugs warnings’ cat-egories?
• Are the same correlations significant across projects?
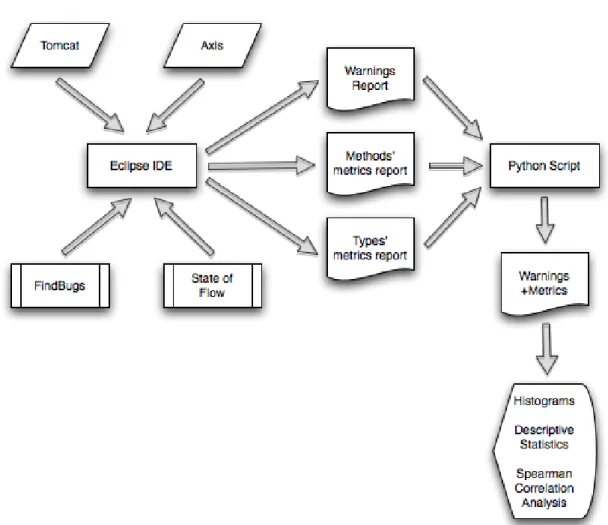
The Figure3.1shows the experimental flow adopted in our study. We use two
open-source Java applications as case studies, Tomcat, and Axis. We adopt Eclipse IDE to import the projects. We use the eclipse plugin of the FindBugs tool to compute the warn-ings. We also use a eclipse plugin to collect the source code metrics (State Of Flow Eclipse Metrics). We develop a script which merges all the source code metrics’ and warnings’ data by class. Finally, we use that data as input to the statistics tool.
Chapter 4
Implementation
This chapter is dedicated to the method’s presentation used in the implementation of the approach explained in Section3.3.
We have used two open-source Java applications as case studies. So, we start by downloading the source code distributions of each system, Tomcat [citb], and Axis[citd]. The next step is to run Eclipse IDE[citf] and create a new Java project from existing source using the previous download.
4.1
Findbugs
The FindBugs[cit10f] Eclipse plugin allows FindBugs to be used within the Eclipse IDE. To use the FindBugs Plugin for Eclipse, it is needed Eclipse 3.3 or later, and JRE/JDK [citl] 1.5 or later.
To get started, right click on a Java project in Package Explorer, and select the option labeled "Find Bugs". FindBugs will run, and problem markers (displayed in source win-dows, and also in the Eclipse Problems view) will point to locations in code which have been identified as potential instances of bug patterns.
We can also run FindBugs on existing java archives (jar, ear, zip, war etc). Simply cre-ate an empty Java project and attach archives to the project classpath. Having that, we can now right click the archive node in Package Explorer and select the option labeled "Find Bugs". If we additionally configure the source code locations for the binaries, FindBugs will also link the generated warnings to the right source files.
In our study, we need the warnings report in XML format:
1. In Eclipse IDE, go to Project Explorer View, right click over the project. 2. Click on Find Bugs, and then Click on Save XML.
Implementation
3. Select the export directory and save the file with the name: warnings.xml.
It creates one file named warnings.xml with all the warnings data. This file is used as input for the script which filters and merges the desired data.
4.2
State of Flow Eclipse Metrics
This Eclipse plugin calculates various metrics for the code during build cycles and warns us, via the Problems view, of ’range violations’ for each metric. This allows us to stay continuously aware of the health of the code base. We may also export the metrics to HTML for public display or to CSV or XML format for further analysis. This export can be performed from within Eclipse or using an Ant task.
In our study we need to export the source code metrics to a CSV file:
1. In Eclipse IDE, go to Project Explorer View and right click over the project. 2. Click on Export.
3. Click on Other, Click on metrics, and then click Next.
4. Check only the box Export CSV, select the export directory, and then click on Finish.
It creates 2 CSV files with source code metrics, one containing the methods’ metrics (methods.csv), and the other one with types metrics (types.csv). These files are also used as input for the script which filters and merges the desired data.
4.3
Merging algorithm
We have developed a python script which filters and merges the methods’ metrics (meth-ods.csv), types’ metrics (types.csv), and warnings’ data (warnings.xml) by class into one CSV file. It stores all classes’ names, methods’ metrics, classes’ metrics, number of oc-currences of each warning type, and number of ococ-currences of each warning category.
The script defines 3 classes:
ClassMetrics This is the master class which stores the data relative to each class. Each of this classes’ objects store the required data by project’s classes (methods’ metrics, types’ metrics, number of occurrences of warnings’ types and categories). Fig-ure4.1presents a source code snippet of this class declaration.
Implementation
class ClassMetrics:
def __init__(self, package, name, method, line, m1,...,m14:
self.package = package
self.name = name
self.methods = [Method(method, line, m1,..., m7)]
self.warnings = [] self.warningTypes = [] self.warningCategories = [] self.m8 = m8 ... self.m14= m14 def attributes(self): if self.package == ’’: stringPackageAndType = self.name else: stringPackageAndType = self.package + ’.’ + self.name ... stringClassMetrics =’,’ + str(max_m1) + ’,’ +... + str(max_m7) ... stringTypeMetrics = ’,’ + self.m8 + ’,’ +...+ ’,’ + self.m14 for i, nw in enumerate(self.warningTypes): stringWarningTypesCount = stringWarningTypesCount + ’,’ + str(nw) for i, nw in enumerate(self.warningCategories): stringWarningCategoriesCount = stringWarningCategoriesCount + ’,’ + str(nw) for i, w in enumerate(self.warnings):
stringWarnings = stringWarnings + w.attributes()
return stringPackageAndType +...+ stringWarningCategoriesCount + ’\n’
Implementation
Method This class stores the data about each method. It has the attributes name, line, m1, m2, m3, m4, m5, m6, m7. The attribute name is the method’s name, the line attribute is the line of code where the method begin and from attributes m1 to m7 are the methods’ metrics. It is presented in Figure4.2a source code snippet of this class declaration.
Warning This class stores the warnings’ data. It has the attributes type, priority, abrev, and category. The type attribute stores the type of warning, the priority stores the warning priority, the abrev stores the abbreviature and finally, the category attribute stores the category of the warning. We present in Figure4.3 a source code snippet of this class declaration.
class Method:
def __init__(self, name, line, m1,...,m7): self.name = name self.line = line self.m1 = int(m1) ... self.m7 = int(m7) def attributes(self):
return self.name + ’,’ +...+ str(self.m7)
Figure 4.2: Script’s Class declaration - Method
class Warning:
def __init__(self, type, priority, abrev, category):
self.type = type
self.priority = priority
self.abrev = abrev
self.category = category
def attributes(self):
return self.type + ’,’ +...+ self.category + ’\n’
Implementation
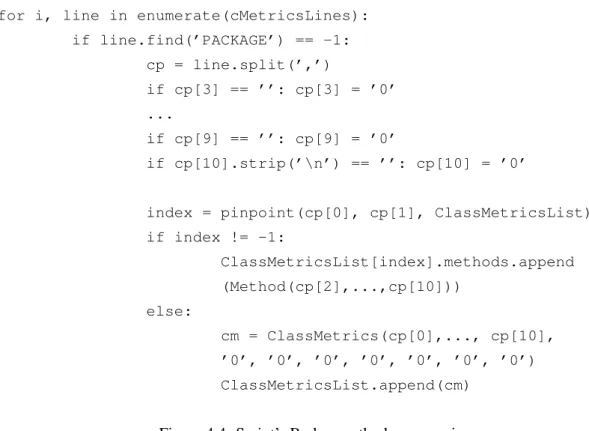
The script body starts by reading the file methods.csv line by line in which each line has the method’s data. So, we extract the class information contained in that file and we identify all the classes. If the class already exists in array, we add the method and its metrics. Otherwise, if the class does not exist in array, we add the class. In Figure4.4, we present a source code snippet which does the parsing of the methods.csv file.
Next, we read the file types.csv line by line in which each line has the types’ (classes’) data. So, we extract the class information contained in that file and we identify all the classes. It searches for the corresponding class. If the class already exists in, we add the metrics. Otherwise, if the class does not exist, we create a new class and add the metrics. Figure4.5presents a source code fragment which does the parsing of the types.csv file.
Afterwards, we read the file warnings.xml line by line. We extract the class informa-tion contained in that file and we identify all the classes. We search for the corresponding class and create a new warning object type. If there is not any warning of that type, we add this warning to the warning type list. We do the same procedure for the warning categories. Therefore, for each project’s class, we count the number of occurrences of each warning type and each warning category. It is presented in Figure4.6a source code fragment which does the matching between warning’s data and respective class.
for i, line in enumerate(cMetricsLines): if line.find(’PACKAGE’) == -1: cp = line.split(’,’) if cp[3] == ’’: cp[3] = ’0’ ... if cp[9] == ’’: cp[9] = ’0’ if cp[10].strip(’\n’) == ’’: cp[10] = ’0’
index = pinpoint(cp[0], cp[1], ClassMetricsList) if index != -1: ClassMetricsList[index].methods.append (Method(cp[2],...,cp[10])) else: cm = ClassMetrics(cp[0],..., cp[10], ’0’, ’0’, ’0’, ’0’, ’0’, ’0’, ’0’) ClassMetricsList.append(cm)
Implementation
for i, line in enumerate(typesMetricsLines): if line.find(’PACKAGE’) == -1: cp = line.split(’,’) if cp[3] == ’’: cp[3] = ’0’ ... if cp[8] == ’’: cp[8] = ’0’ if cp[9].strip(’\n’) == ’’: cp[9] = ’0’ if cp[1].find(’$’): cp[1] = cp[1].replace(’$’, ’.’)
index = pinpoint(cp[0], cp[1], ClassMetricsList) if index != -1: if int(cp[3]) > int(ClassMetricsList[index].m8): ClassMetricsList[index].m8 = cp[3] ... if int(cp[9]) > int(ClassMetricsList[index].m14): ClassMetricsList[index].m14 = cp[9] else: cm = ClassMetrics(cp[0], cp[1], ’’, ’0’,..., cp[3],..., cp[9]) if cm.name.find(’$’): cm.name = cm.name.replace(’$’, ’.’) ClassMetricsList.append(cm)
index= pinpoint(cm.package, cm.name, ClassMetricsList)
Figure 4.5: Script’s Body - types.csv parsing
index = pinpoint(cpackage, cname, ClassMetricsList)
if index != -1 and ClassMetricsList[index].package == cpackage: w = Warning(cp[3].split(’=’)[1].strip(’\"’), cp[4].split(’=’)[1].strip(’\"’), cp[5].split(’=’) [1].strip(’\"’), cp[6].split(’=’)[1].strip(’\"’)) ... else: for j, wt in enumerate(WarningTypesList): if cp[3].split(’=’)[1].strip(’\"’) == wt: break
Implementation
We calculate the maximum value of each method’s metrics. We store these maximum values in variables from max_m1 to max_m7. We compute the maximum values of each
methods’ metric. We present in Figure4.7 a source code fragment of how the maximum
value of each method’s metrics is calculated.
for i, m in enumerate(self.methods):
stringMethodsMetrics = stringMethodsMetrics + m.attributes()
if m.m1 > max_m1: max_m1 = m.m1 ...
if m.m7 > max_m7: max_m7 = m.m7
Figure 4.7: Script - Maximum value of each methods’ metrics calculation
We compute the header of the output file (metrics+warnings.csv) dynamically, de-pending on metrics order, warning types, and warning categories in which execution time. Layout of the header: package.class,methods’ metrics,types’ metrics,warnings’ types, warnings’ categories. Figure 4.8 presents a source code fragment of the header’s computation.
methods_header = line.replace(’METHOD,LINE,’, ’’)
methods_header = methods_header.replace(’PACKAGE,’, ’’).strip(’\n’)
types_header = line.replace(’PACKAGE,TYPE,LINE’, ’’).strip(’\n’)
for i, wt in enumerate(WarningTypesList):
warningTypesHeader = warningTypesHeader + ’,’ + wt
for i, wt in enumerate(WarningCategoriesList):
warningCategoriesHeader = warningCategoriesHeader + ’,’ + wt
open(’metrics+warnings.csv’, ’a’).write(’\%s\%s\%s\%s\n’ \%
(methods_header, types_header, warningTypesHeader, warningCategoriesHeader))
Implementation
Finally we print to metrics+warnings.csv file the data collected. In Figure 4.9, we present a source code fragment of how the results’ output is printed to a file.
for i, cm in enumerate(ClassMetricsList):
while len(cm.warningTypes) < len(WarningTypesList): cm.warningTypes.append(0)
while len(cm.warningCategories) < len(WarningCategoriesList): cm.warningCategories.append(0)
open(’metrics+warnings.csv’, ’a’).write(cm.attributes())
Figure 4.9: Script - Print the results into metrics+warnings.csv file
4.4
Statistical Analysis
We start by running PASW Statistics tool [citk]. Next, we explain step by step how to import the CSV file generated by the previous script to the Statistics tool:
1. We begin by opening the CSV data file generated by the previous script (File, Open, Data, and select the file metrics+warnings.csv).
2. It opens the text import wizard. We choose that the text file does not match a predefined format and select Continue.
3. In the next screen we select that variables are delimited by a specific character, the variable names are included at the top of file, and select Continue.
4. Now, just press Continue.
5. We select Comma as the only delimiter between variables and none text quali-fier, then just click Continue.
6. Now, we have to define the data format of the variables: The first one (Type) is a String with 128 characters, all the remaining variables are Numeric, and click Done.
7. Finally, just press Done again.
In PASW Statistics Data Editor, we select Variable View and we have to change the Measure parameters of the variables. While the Type is a Nominal one, the source code metrics and Warning Categories are Scale [citr]. At this moment, the statistics tool has all the required data for the analysis.
Implementation
We have done charts (histograms) for all the source code metrics: 1. Click on Graphs Menu, and then Chart Builder.
2. We select Histogram and drag it to the preview area. We drag the desired metric variable to the XX axis.
We have performed this procedure for all source code metrics.
We have also studied the descriptive statistics for source code metrics:
• In PASW, we go to Analyze menu, Descriptive Statistics, and then Frequencies. • We select the metrics variables to be analyzed. We also sign the checkbox to
display frequency tables and then click in Statistics button. • In the new dialog window, we select Median, Maximum.
Considering the descriptive statistics for the warning categories, the procedure is the same as the previous for source code metrics except that after click on statistics button we select Median, Maximum and Sum.
Most classes do not have warnings from any category resulting in too much zero-values. Hence, for each warning category, we filter the cases with 0 occurrences:
1. Go to Data Menu and then Select Cases. In the new dialog window, we select "If condition is satisfied" and next click the If button. Now we select one warning category and write "WC > 0", where WC is the desired warning category.
2. Now, we do the warning category histogram as already described for source code metrics.
We repeat this procedure for all warning categories.
Finally we have studied the correlation between source code metrics and warning categories using Spearman correlation analysis:
1. We go to Analyze menu, then correlate, and finally bivariate.
2. In the next screen, we select all the source code metrics and one warning cate-gory; We use Spearman correlation coefficients and Two-tailed test of signifi-cance. We also check the item "Flag significant correlations.
Implementation
4.5
Workflow of experiments
Our approach to provide the answer to the research questions comprises 5 stages:
1. Import the case studies to Eclipse IDE
2. Warnings’ computation
3. Metrics’ computation
4. Merging all desired data
5. Statistics analysis
Implementation
4.6
Summary
We have used two open-source Java applications as case studies, Tomcat, and Axis. We have started by downloading the source code distribution and running the Eclipse IDE to import the project.
We have used the eclipse plugin of the FindBugs to compute the warnings. We export the warnings report into a XML file.
State of Flow Eclipse metrics plugin is used to compute the source code metrics. These metrics were exported into 2 CSV files - one containing all the methods’ metrics and the other one, the types’ (classes’) metrics. In our study we focus on class metrics. Therefore, we have selected the value of each class’s metric by choosing the maximum occurrence of it throughout all methods of the class.
We have also developed a python script which filters and merges all the desired data by class into one CSV file. It stores all classes’ names, methods’ metrics, classes’ metrics, number of occurrences of each warning type, and number of occurrences of each warning category.
Finally, we use the last CSV file as input to the PASW Statistics tool. We present histograms and descriptive statistics for source code metrics and warnings’ categories. It is also studied the relationship between the source code metrics and warnings’ categories using Spearman correlation analysis.
Chapter 5
Empirical Evaluation
This is the core chapter of this thesis in which we report on the experiments to provide the answers to our research questions. It is divided into 5 sections. In section5.1, we present the experimental setup. In section 5.2, we do a short description of the projects that we have chosen to perform our experiments. Results are analyzed in section5.3, and the answers to the research questions are outlined in section5.4. In the last section 5.5, we discuss the threats to validity of the experimental results.
5.1
Experiment setup
The goal of the evaluation is to provide the answers to the following two research ques-tions:
• Is there any correlation between source code metrics and FindBugs [cit10f] warn-ings’ categories?
• Are the same correlations significant across projects?
For this we have used two open-source Java applications, Tomcat [cita] and Axis [citz]. While Tomcat is a widely used web application server, Axis is an implementation of the
SOAP1submission to W3C.
We have adopted Eclipse IDE [cith] to import these projects. We have computed the set of warnings using the eclipse plugin of the FindBugs tool and this warnings’ data has been exported into a XML file. We have also computed the source code metrics using the State Of Flow Eclipse Metrics (plugin) [citg].
1SOAP is a lightweight protocol for exchanging structured information in a decentralized, distributed environment.
It is an XML based protocol that consists of three parts: an envelope that defines a framework for describing what is in a message and how to process it, a set of encoding rules for expressing instances of application-defined datatypes, and a convention for representing remote procedure calls and responses.
Empirical Evaluation
These metrics were exported into 2 CSV files - one containing all the methods’ metrics and the other one, the types’ (classes’) metrics. In our study we focus on class metrics. Therefore, we have selected the value of each class’s metric by choosing the maximum value of it throughout all methods of the class.
We have also developed a python script which filters and merges all the desired data by class into one CSV file. It stores all class’s names, methods’ metrics, classes’ metrics, number of occurrences of each warning type, and number of occurrences of each warning category.
Finally, we have used the last CSV file as input to the PASW (former SPSS) Statistics tool. We present histograms and descriptive statistics for source code metrics and warn-ings’ categories. We have also studied the relationship between the source code metrics and warnings’ categories using Spearman correlation analysis.
5.2
Description of the subject systems
In our experiment, we have worked with two open-source Java applications as our subject systems. Apache Tomcat (version 6.0.26) is a widely used web application server. It is an implementation of the Java Servlet and JavaServer Pages technologies. Axis (version 1.4) is an implementation of the SOAP (Simple Object Access Protocol) submission to W3C. We have selected different types of projects as subject systems to cover a broader range of bug patterns2and types of bugs.
The Table5.1 shows the subject project’s name (Project), number of lines of code in total (LoC), and total number of warnings (# Warnings). Both projects are large in size but only have rather few warnings. This might stem from the fact both projects have many users and therefore are well maintained.
Project LoC # Classes # Warnings Tomcat 215045 1687 1584
Axis 104925 840 891 Table 5.1: Case studies inspection results
5.3
Results
This section presents the results computed with the PASW statistics tool on the merged Tomcat and Axis data set.
2Bug patterns are code idioms that often result in errors. In other words, they are error-prone coding practices
that arise from the use of erroneous design patterns, misunderstanding of language semantics, or simple and common mistakes.
Empirical Evaluation
It contains two different parts. First, we take a more detailed look at the Tomcat sys-tem in section5.3.1, and then at the Axis in section5.3.2.
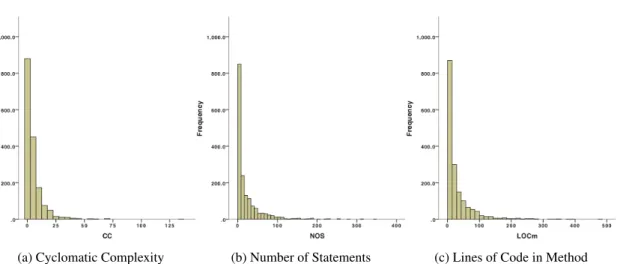
In the subsections 5.3.1.1 and 5.3.2.1, we present the study of source code metrics’ distribution for Tomcat and Axis respectively. We show histograms and descriptive statis-tics.
Methods’ Metrics In our study we focus on class metrics. Therefore, we have selected the value of each class’s metric by choosing the maximum value of it throughout all methods of the class. We study the following metrics:
• NOL - Number of Levels • NOP - Number of Parameters • FE - Feature Envy
• NOS - Number of Statements • CC - Cyclomatic Complexity • LOCm - Lines of Code in method • NLS - Number of Locals In Scope
Types’ Metrics We study the following metrics: • NOF - Number of Fields
• LCPFI - Lack of Cohesion in Methods (Pairwise Field Irrelation) • LCTC - Lack of Cohesion in Methods (Total Correlation
• LCHS - Lack of Cohesion in Methods (Henderson-Sellers) • LCCK - Lack of Cohesion in Methods (Chidamber & Kemerer) • WMC - Weighted methods per class
• Ce - Efferent Couplings
In the subsections 5.3.1.2 and 5.3.2.2, we present the study of FindBugs warnings’ distribution for Tomcat and Axis systems respectively. We show histograms and descrip-tive statistics.