Received 26 Feb 2010 | Accepted 22 sep 2010 | Published 19 oct 2010 DOI: 10.1038/ncomms1095
Biodiversity is of crucial importance for ecosystem functioning, sustainability and resilience, but the magnitude and organization of marine diversity at a range of spatial and taxonomic scales are undefined. In this paper, we use second-generation sequencing to unmask putatively diverse marine metazoan biodiversity in a scottish temperate benthic ecosystem. We show that remarkable differences in diversity occurred at microgeographical scales and refute currently accepted ecological and taxonomic paradigms of meiofaunal identity, rank abundance and concomitant understanding of trophic dynamics. Richness estimates from the current benchmarked operational Clustering of Taxonomic units from Parallel ultrasequencing analyses are broadly aligned with those derived from morphological assessments. However, the slope of taxon rarefaction curves for many phyla remains incomplete, suggesting that the true alpha diversity is likely to exceed current perceptions. The approaches provide a rapid, objective and cost-effective taxonomic framework for exploring links between ecosystem structure and function of all hitherto intractable, but ecologically important, communities.
1 Molecular Ecology and Fisheries Genetics Laboratory, School of Biological Sciences, Environment Centre Wales, Bangor University, Deiniol Road, Gwynedd LL57 2UW, UK. 2 Hubbard Center for Genome Studies, University of New Hampshire, 35 Colovos Road, Durham, New Hampshire 03824, USA. 3 CCMAR-CIMAR Associate Laboratory, Centre of Marine Sciences, University of Algarve, Gambelas, Faro 8005-139, Portugal. 4 School of Ocean Sciences, Bangor University, Menai Bridge, Anglesey LL59 5AB, UK. 5 Department of Zoology, The Natural History Museum, Cromwell Road, London SW7 5BD, UK. 6 Ashworth Laboratories, Institute of Evolutionary Biology, University of Edinburgh, King’s Buildings, West Mains Road, Edinburgh EH9 3JT, UK.
7 National Oceanography Centre, School of Ocean and Earth Science, European Way, Southampton SO14 3ZH, UK. Correspondence and requests for materials should be addressed to S.C. (email: s.creer@bangor.ac.uk).
second-generation environmental sequencing
unmasks marine metazoan biodiversity
Vera G. Fonseca
1, Gary R. Carvalho
1, Way sung
2, Harriet F. Johnson
1, Deborah m. Power
3, simon P. neill
4,
B
iodiversity is the product of millions of years of evolution and forms the basis of the earth’s life support system, but the mag-nitude and relative diversity of global species richness remain unknown. On earth, there may be over 100 million species1 butfewer than two million have been formally described2. There is also
a pronounced bias towards the study of larger organisms, leaving the most speciose communities that are dominated by microscopic organisms understudied. To study diverse environments domi-nated by small taxa, second-generation sequencing has been used for the quantification of bacteria, archaea3,4 and viruses5,6, but large
knowledge gaps still exist regarding the organization of diversity within several eukaryotic kingdoms, including the Metazoa7. The
Kingdom Metazoa, also known as Animalia, consists of multicel-lular heterotrophic organisms ranging from Porifera to Chordata. Contemporary phylogenetic studies routinely recover a mono-phyletic Bilateria—Triploblasta clade (including deep-branching Ecdysozoa, Lophotrochozoa and Deuterostomia)8,9, but no
consen-sus view exists of the precise relationships between Bilateria, and the basal groups of Porifera, Ctenophora, Placozoa, Cnidaria and Coe-lenterata8,9. Marine benthic metazoan communities display some of
the highest α-diversity on the planet and occupy one of the larg-est ecosystems on earth, where only 1% of species are larg-estimated to be known10. Benthic meiofauna (small metazoans between 45 and
500 µm in size) comprises members encompassing 60% of animal phyla and represents a major part of marine biodiversity10.
Domi-nated by nematodes and characterized by high abundances (up to 108 individuals per 1 m2) and diversity11, meiofaunal assemblages
perform essential roles in marine ecosystem processes, namely, nutrient cycling, secondary production, sediment transport and mineralization12.
In this paper, we apply a metagenetic approach (that is, the large-scale analysis of taxon richness through the analysis of homologous genes7) using second-generation sequencing of the 18S nuclear
small subunit (nSSU) ribosomal RNA (rRNA) gene to assess simul-taneously the relative levels of richness and patterns of diversity of multiple metazoan phyla across an ecological gradient in a temper-ate benthic ecosystem. The heterogeneous levels of accumulating taxon richness derived from the benchmarked analyses were broadly congruent with those derived from intensive morphological assess-ments, but MEGABLAST annotation revealed a previously uniden-tified phylogenetic breadth of microbial metazoan life. Moreover, the finding that the largely predacious turbellarian Platyhelminthes represent a substantial proportion of benthic diversity quantifies their hitherto unrecognized ecological importance in benthic food chains. Annotated metagenetic analyses enable the objective assess-ment of microbial biodiversity throughout all ecosystems, facilitat-ing understandfacilitat-ing of linkages between microbial biodiversity and ecosystem processes.
Results
Taxon richness estimates. nSSU rRNA amplicons were generated from eight benthic samples from the low-tide zone of an estuarine beach near Prestwick on the West coast of Scotland, and from one sample from a beach in Littlehampton in the South of England.
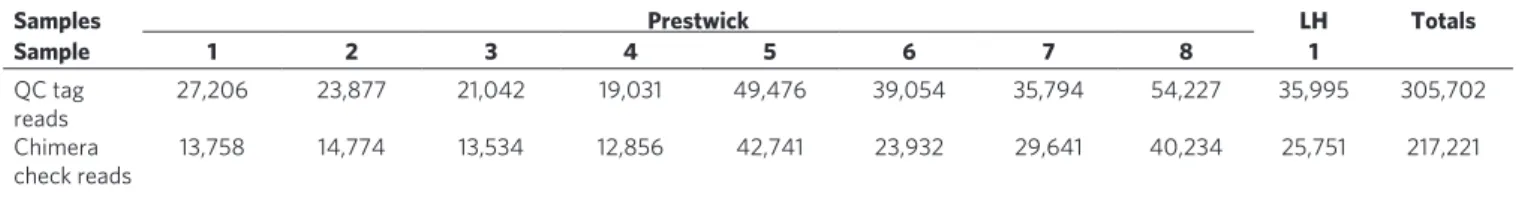
The amplicons were processed for sequencing on a Roche 454 FLX platform generating a total of 353,896 sequences that were quality filtered to 305,702 for downstream analysis (Table 1). When performing metagenetic assessments of taxon richness, it is important to cluster taxonomic units in a biologically meaningful manner, as even slight differences in similarity cut-offs and using different algorithms can result in significantly different estimates of richness. The taxon clustering comparisons between ESPRIT13
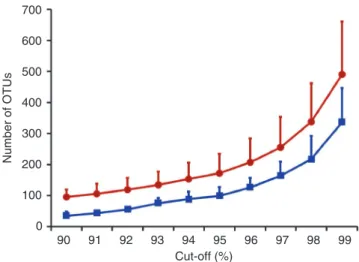
and OCTUPUS (the Operational Clustering of Taxonomic Units from Parallel UltraSequencing, supplementary software available at http://octupus.sourceforge.net/) (Fig. 1) on the subsampled beach pyrosequencing data show that ESPRIT overestimates Operational Taxonomic Units (OTUs) richness compared with OCTUPUS (between 1.1x–4.4x, over the 90–99% cut-off range). Phylogenetic14 and barcoding15 studies based on the analysis of
chain-termination nSSU gene sequences suggest that intraspecific divergence at least in nematode species is low (1–2%). However, the true level of intragenomic and intraspecific variation among rRNA gene repeats is largely unknown, and genome-wide analyses reveal a dominant set of conserved sequences accompanied by rare variant sequences16. Our benchmarking exercise, performed against a
reference control data set comprising 41 species17, revealed that the
96% similarity OCTUPUS clustering algorithm with accompanying chimera screening estimated taxon richness that was most closely aligned with species richness. At 96% similarity, OCTUPUS resulted in 37 operational clustered taxonomic units (OCTUs), whereas at 97%, OCTUPUS resulted in 51 OCTUs from the control metagenetic analysis17. Thus, although we may be underestimating
richness by at least 10%, we have opted for a more conservative approach of setting a 96% identity OCTU cut-off for all subsequent numerical comparisons. At this cut-off, an OCTU is likely to (at worst) correspond to a group of related species. Following the 96% similarity OCTUPUS clustering strategy, the total number of putatively non-chimeric tag reads and OCTUs was 217,221 and 428, respectively. Before chimera screening, 1013 OCTUs were clustered from the initial quality-screened 305,702 reads.
Community richness is closely linked to the environment. The peak of standardized OCTU richness for all phyla was within sam-ples 6, 7 and 8 from Prestwick, and cluster analyses indicated clear and fine-scale hierarchical distinctions in OCTU composition within and between the two sites, with clear divergence of samples from Littlehampton (Fig. 2). OCTU richness and sediment grain size were clearly correlated (Spearman’s correlation coefficient,
n = 9, ρ = − 0.82, P = 0.0108).
Dominance of the Nematoda and rise of the Platyhelminthes. Plotting phylum richness rank for all nine independent samples (Fig. 3) shows that Nematoda are the most OCTU-rich in all nine samples, with Platyhelminthes and Arthropoda ranking second and third in all, respectively.
Annotated metagenetic analyses can yield robust relative rich-ness estimates and here it was possible to assign 374 OCTUs to phylum (Fig. 4a). The PCR primers used are not fully specific to Table 1 | Total number of pyrosequencing sequences after quality control and chimera screening.
Samples Prestwick LH Totals
Sample 1 2 3 4 5 6 7 8 1 QC tag reads 27,206 23,877 21,042 19,031 49,476 39,054 35,794 54,227 35,995 305,702 Chimera check reads 13,758 14,774 13,534 12,856 42,741 23,932 29,641 40,234 25,751 217,221
Data are shown for reads passing the initial quality trimming, tag matching and size culling steps (QC tag reads) and reads underpinning oCTus that were estimated to be non-chimeric (Chimera check reads) from the Prestwick and Littlehampton (LH) sample sites.
Metazoa, and thus we also sequenced nSSU genes from protist taxa from the Alveolata (2 distinct OCTUs), Cercozoa (3 OCTUs) and Stramenopiles (15 OCTUs). Of the metazoan OCTUs, 182 were from Nematoda, at least three times more than from any other
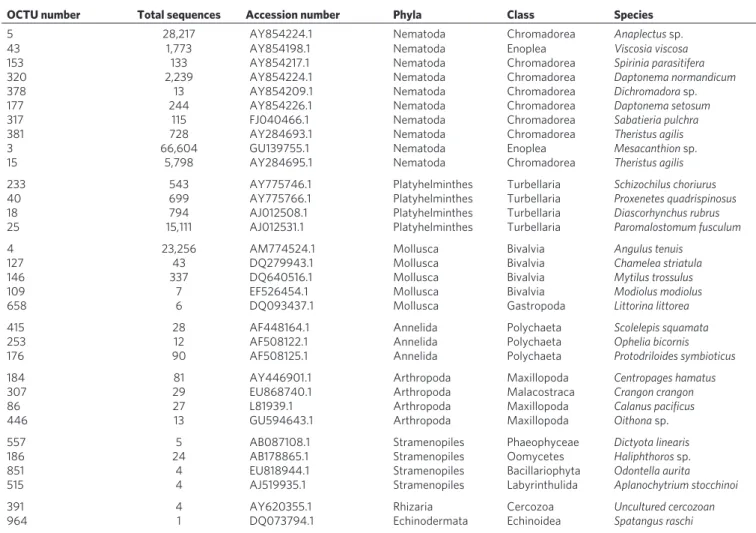
individual meiofaunal taxon (Fig. 4a). Platyhelminthes (61 OCTUs) was the second richest phylum, followed by Arthropoda (29 OCTUs including Copepoda, Ostracoda and Malacostraca), Mollusca (22 OCTUs), Gastrotricha (7 OCTUs), Annelida (6 OCTUs) and five less-rich phyla (for example, Bryozoa, Echinodermata, Cercozoa, Rotifera and Alveolata with between 1 and 3 OCTUs each). Metagenetics reveals phylogenetically distinct taxa. According to the comparisons of the OCTU sequences with the NCBI database, the majority (95%) of Nematoda OCTUs have never been sequenced before (Fig. 4a, Table 2). Similarly, only 6.5% of Platyhelminthes and 17.2% of Arthropoda OCTUs had 100% identity to previously sequenced specimens. The Annelida, Mollusca and Stramenopiles, however, had 50, 23 and 26.6%, respectively, of their OCTUs, with a 100% identity to previously sequenced taxa. None of the Gastro-tricha OCTUs were identical to previously sequenced taxa. Overall, 54 OCTUs (representing 7,247 individual sequences) had identities below 90% to any reference nSSU sequence (OCTUs < 90% identity), and may represent previously unsampled diversity. Given the nature of the adopted clustering algorithm, the OCTUs with < 90% iden-tity do not show any pattern of variation that would be expected of a chimeric assemblage of the already defined 428 OCTUs. Fifteen of the OCTUs with < 90% identity (300 sequences) were robustly placed within identified phyla (mainly Nematoda). A further 36 were either sisters to the sequences from known phyla, or represented deep, likely misplaced branches (Fig. 4b). Surprisingly, 11 OCTUs with < 90% identity, comprising 107 sequences in total distributed across the sampling area, were not affiliated to any phyla. The simi-larity of the latter sequences ranged between 83 and 89% to known nSSU genes, suggesting that they may represent unknown, distinct lineages. Furthermore, three OCTUs resulted in no MEGABLAST hit, but two of these exhibited signatures of relaxed selection, indi-cating that they may represent translocated ‘orphan’ nSSU genes that
700 600 500 400 300 200 100 0 Number of OTUs Cut-off (%) 90 91 92 93 94 95 96 97 98 99
Figure 1 | Lineage-through-time plots for OCTUPUS and ESPRIT. mean
number of oTus plotted against each percentage identity cut-off (90–99% similarity) generated using 5,000 subsampled sequences ( > 199 bases in length) from three independent sample sites (Prestwick 2, 7 and Littlehampton 1) using oCTuPus (blue squares) and EsPRIT’s HCluster13 (red circles) oTu clustering. Values are given as average + s.d. (n = 9).
Nematoda Platyhelminthes Arthropoda Mollusca Stramenopiles Plantae Gastrotricha Annelida, Alveolata, Cercozoa, Bryozoa, Tardigrada Number of OCTUs Grain size 100 µm PWK1 PWK2 PWK3 PWK4 PWK5 PWK6 PWK7 PWK8 LH1 UPGMA 120 100 80 60 40 20 0
Figure 2 | Taxon richness and community similarity in relation to ecology and space. (a) number of different oCTus per sample for each phylum
after data standardization derived from the Prestwick (eight sampling sites) and Littlehampton (one sampling site) marine littoral benthos; (b) grain size represents the relative 50% cumulative median grain size (µm) per site, and cluster analyses (uPGmA) using sorensen’s Coefficient represent the number of shared oCTus between the nine independent samples. The positive relationship between grain size and sample richness is highly significant (spearman’s correlation coefficient, n = 9, ρ = − 0.83, P = 0.0108).
9 8 7 6 3 5 4 2 1 0 –1
Phylum rank abundance
Nematoda Platyhelminthes Arthropoda Mollusc a Gastrotricha Annelida Stramenopile s
Figure 3 | Phylum rank abundance plot. Community assemblage oCTu
richness rank order for the main phyla recovered from the Prestwick and Littlehampton samples (after data standardization). The frequency of ranking (out of the nine samples) is represented by the diameter of the symbol at each rank. single symbols per phylum represent a constant ranking, whereas multiple symbols highlight variance in phylum rank order throughout the samples.
91–90% 92–91% 93–92% 96–95% 98–97% 100% 100–99% Number of OCTUs Nematoda 48.7% Arthropoda, Platyhelminthes, Diatoms, Tardigrada 15.3% Platyhelminthes Ar thropod a Alv eolata Cercoz oa Annelida Gastrotr icha Stramenopiles Mollusca Nematoda No BLAST hits 7.6% Phylogenetically distinct sequences 28.2% 60 0 20 40 80 100 120 140 160 180 200 20 0 40 60 80 100 BLAST hits (%) 99–98% 97–96% 95–94% 94–93%
Figure 4 | Percentage identity to known sequences and number of OCTUs found for the main phyla. (a) number of different oCTus for the main
phyla recovered from the Prestwick and Littlehampton meiofaunal samples and their different levels of identity to nssu in the GenBank/EmBL/DDBJ nucleotide database. (b) Putative taxonomic classification of 39 oCTus that had less than 90% sequence identity to nssu in GenBank/EmBL/DDBJ. We acknowledge and thank Richard Ling (Platyhelminthes), Frederico Batista (mollusca), David mann (stramenopile), Greg Rouse (Annelida), Charisa Wernick/microscopeWorld (Alveolata), Tim Ferrero (nematoda), Kim Taylor/Warren Photographic (Arthropoda), Graham matthews (Gastrotricha) and David Bass (Cercozoa), who gave permission to use the images in Figure 4a.
Table 2 | OCTUs with 100% identity to nSSU sequences in the GenBank/EMBL/DDBJ database.
OCTU number Total sequences Accession number Phyla Class Species
5 28,217 AY854224.1 nematoda Chromadorea Anaplectus sp.
43 1,773 AY854198.1 nematoda Enoplea Viscosia viscosa
153 133 AY854217.1 nematoda Chromadorea Spirinia parasitifera
320 2,239 AY854224.1 nematoda Chromadorea Daptonema normandicum
378 13 AY854209.1 nematoda Chromadorea Dichromadora sp.
177 244 AY854226.1 nematoda Chromadorea Daptonema setosum
317 115 FJ040466.1 nematoda Chromadorea Sabatieria pulchra
381 728 AY284693.1 nematoda Chromadorea Theristus agilis
3 66,604 Gu139755.1 nematoda Enoplea Mesacanthion sp.
15 5,798 AY284695.1 nematoda Chromadorea Theristus agilis
233 543 AY775746.1 Platyhelminthes Turbellaria Schizochilus choriurus
40 699 AY775766.1 Platyhelminthes Turbellaria Proxenetes quadrispinosus
18 794 AJ012508.1 Platyhelminthes Turbellaria Diascorhynchus rubrus
25 15,111 AJ012531.1 Platyhelminthes Turbellaria Paromalostomum fusculum
4 23,256 Am774524.1 mollusca Bivalvia Angulus tenuis
127 43 DQ279943.1 mollusca Bivalvia Chamelea striatula
146 337 DQ640516.1 mollusca Bivalvia Mytilus trossulus
109 7 EF526454.1 mollusca Bivalvia Modiolus modiolus
658 6 DQ093437.1 mollusca Gastropoda Littorina littorea
415 28 AF448164.1 Annelida Polychaeta Scolelepis squamata
253 12 AF508122.1 Annelida Polychaeta Ophelia bicornis
176 90 AF508125.1 Annelida Polychaeta Protodriloides symbioticus
184 81 AY446901.1 Arthropoda maxillopoda Centropages hamatus
307 29 Eu868740.1 Arthropoda malacostraca Crangon crangon
86 27 L81939.1 Arthropoda maxillopoda Calanus pacificus
446 13 Gu594643.1 Arthropoda maxillopoda Oithona sp.
557 5 AB087108.1 stramenopiles Phaeophyceae Dictyota linearis
186 24 AB178865.1 stramenopiles oomycetes Haliphthoros sp.
851 4 Eu818944.1 stramenopiles Bacillariophyta Odontella aurita
515 4 AJ519935.1 stramenopiles Labyrinthulida Aplanochytrium stocchinoi
391 4 AY620355.1 Rhizaria Cercozoa Uncultured cercozoan
are no longer constrained by function. Resampling to generate longer sequences beyond the 200 base pairs presented here will be required to confirm or refute the biological reality of these phylogenetically distinct sequences.
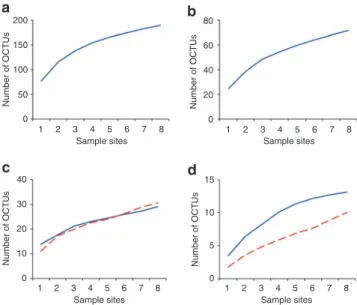
Metazoan richness curves do not approach saturation. Along the Prestwick transect, the slope of OCTU rarefaction curves at 96% cut-off for the Nematoda, Platyhelminthes, Arthropoda, Mollusca, Stramenopiles and Annelida phyla did not reach an asymptote (Fig. 5). However, 217,221 samples and 374 OCTU-defined taxa fail to achieve saturation, even for low abundance phyla in which rareaction curves tend to converge18.
Discussion
Both ESPRIT13 and OCTUPUS can be used to cluster OTUs from
the size of the environmental metagenetic data set presented here, without the need of a computing cluster. Nevertheless, ESPRIT may overestimate OTU richness, presumably because it counts both substitutional and independent insertion/deletion (indel) events in OTU clustering. One of the most widely publicized artefacts of 454 Roche pyrosequencing is its inherent inaccuracy in calling homopolymer runs, including extensions (insertions), incomplete extensions (deletions) and carry forward errors (insertions and sub-stitutions)19–21. Therefore, clustering algorithms that use indel data
informatively, especially as independent events at homologous base positions22, are likely to be susceptible to higher OTU estimates.
Analyses herein, and those of Sun et al.13, suggest that OCTUPUS
generates a conservative number of OTUs compared with both ESPRIT and combinations of MUSCLE23 and DOTUR24.
Neverthe-less, it is imperative, when possible, to benchmark the analytical framework against real or simulated data, in order to estimate taxon richness as realistically as possible21.
The patterns of taxon richness along the Prestwick transect exhibited remarkable differences even at a microgeographical scale. Although numerous environmental factors influence meiobenthic distribution and assemblage, grain size, examined here, is known to be the predominant driver of meiofaunal community structure and diversity12. Nevertheless, the fine-scale community structuring also
indicates that there are likely to be a host of additional biotic (for example, prokaryote communities and organic matter) and abiotic (sediment grain shape, surface composition) microgeographical fac-tors responsible for community structuring within the benthos12.
Nematodes account for approximately 80% of all individual ani-mals on earth, but quantifying the levels of relative richness between major Metazoan phyla has not been practical hitherto, because of the taxonomic magnitude of the challenge. Remarkably, along only an 800 m transect, we detected 182 Nematoda OCTUs, compared with 450 species of Nematode that have been described from around the entire British Isles25. From a geographical perspective, these data
represent the discovery of 40% of the previously known phylum richness from a transect that represents 0.004% of the length of the British coastline (~17,820 km, Ordnance Survey). Molecular defi-nition of substantial meiofaunal taxon richness at microgeographi-cal smicrogeographi-cales is in alignment with intensive morphologimicrogeographi-cal studies35,
yet recent metagenetic studies from the microbial biosphere have suggested that taxon richness may be orders of magnitude more than previously expected3–6. Reeder and Knight26, Quince et al.27
and Huse et al.28 have recently provided alternative interpretations,
based on pyrosequencing error, DNA recombination and cluster-ing approaches, for earlier studies reportcluster-ing extensive richness and rare biospheres derived from Roche 454 pyrosequencing. The data here have been quality/size filtered; only substitutional variance has contributed to taxon identification and a particularly aggressive chi-mera screen has been applied to featured OCTUs. In combination with the benchmarking exercise performed against known taxa, it is therefore highly unlikely that the delineated taxa are based on sequencing error, and taxon estimates are likely to underestimate richness by at least 10%. Although global nematode diversity esti-mates range from 1 to 100 million species, only 24,000 species have been described29, with ~2,000 marine species catalogued in Europe30.
Such relative paucity of taxonomic knowledge of nematode biodi-versity is a product of their numerical dominance, the number of taxa and the high level of cryptic species: this taxon is thus a prime candidate for taxonomic exploration using metagenetic analyses. Why are Nematoda so dominant, in both abundance and diver-sity, in meiofaunal communities? Benthic nematodes are small in size and possess rapid generation times, and these attributes may have facilitated rapid adaptation to local conditions and habitats, especially in interstitial niches. The taxonomic richness of nema-todes is, in addition, likely promoted by ancient ancestry31 and the
absence of a dispersal phase, promoting speciation across structur-ally and spatistructur-ally heterogeneous environments during glacial and interglacial periods. Nematodes also have cryptobiotic adaptations, including resting eggs and highly resistant larvae32, and they are
considered to be especially resistant to environmental challenges, being among the last taxa to disappear in an environmental catastro-phe33. As no other meiofaunal phylum shares all such characteristics
simultaneously, nematodes may have had the time and potential to diversify, endowing them with collectively optimal traits for domi-nation of the marine benthos. Considering all metazoan taxa, the detection of 428 OCTUs on only two sites is likely a gross underesti-mate of actual metazoan richness. In all, 70% of Nematoda OCTUs were unique to Prestwick and 58–100% of the OCTUs for the other phyla were only present in Prestwick. In the absence of large-scale dispersal events sustaining ubiquitous meiobenthic communities12,
levels of marine meiobenthic α-diversity, at the very least, in other parts of the world are likely to exceed expectations.
Contrary to most morphological assessments of marine meiobenthic richness34,35, Platyhelminthes were consistently ranked
as the second richest phylum in all the investigated samples. Platy-helminthes normally have to be identified from living or well- preserved material and their low ranking in other surveys perhaps arises from a global lack of taxonomic expertise, from extensive crypsis and from delicate body structures that do not survive harsh 80 60 40 0 20 Number of OCTU s Number of OCTU s 15 10 5 0 Number of OCTU s Number of OCTU s 40 30 20 0 10
Sample sites Sample sites 1 2 3 4 5 6 7 8 Sample sites 1 2 3 4 5 6 7 8 Sample sites 1 2 3 4 5 6 7 8 1 2 3 4 5 6 7 8 200 150 100 0 50
Figure 5 | Rarefaction curves of the abundance-based coverage estimation (ACE) diversity estimator. Plots are shown for (a) nematoda,
(b) Platyhelminthes, (c) Arthropoda (blue) and mollusca (red dashed), (d) stramenopiles (blue) and Annelida (dashed red) at 96% identity oCTu cut-off for the Prestwick meiobenthic samples 1–8. Curves were estimated from 100 randomizations, without replacement, using Estimates, version 8.2.0.
extraction methods. Given that the majority of free-living turbellarian Platyhelminthes encountered here occupy a top predacious role in benthic ecosystems36, the empirically demonstrated prominence of
this phylum proves that conventional diversity assessments provide a notably distorted perspective of trophic relationships within the benthos12. Only six polychaete annelid OCTUs were identified,
despite their dominance of benthic infaunal biomass12,35, probably
because biomass dominance is affected by non-meiofaunal taxa (with only reproductive propagules and larvae being sampled here). Similarly, molluscan OCTUs comprised 21 bivalves and a single gastropod (Littorina littorea), likely representing larval and juve-nile stages that are temporary members of the benthic meiofauna. Here, we also uncover a large percentage of OCTUs that have never been sequenced before, despite the nSSU region sampled here being the most frequently used genomic region for meiofaunal barcod-ing studies37,38. Some of our metagenetic sequences were clearly
attributable to phylum, but were not closely related to previously sequenced taxa. Thus, we are likely to have uncovered a high level of phylogenetic novelty across a microgeographical scale that has not been shown from morphological or conventional DNA barcoding studies15 of the meiobenthos.
Quantifying biodiversity in species-rich environments raises questions of whether the sampling effort was sufficient to fully rep-resent the natural community. Here, despite an extensive sampling strategy, the slope for OCTU rarefaction curves remained incomplete and the true standing diversity of an unremarkable Scottish beach is likely to exceed this estimate by an undetermined number of taxa. Such observations illustrate clearly the likely extent of marine meio-faunal diversity, and reveal that extensive sampling combined with ultrasequencing technologies makes realistic estimates of genetic diversity tractable in one of the largest ecosystems on earth.
The present data offer novel insights into the organization, magni-tude and identity of meiofaunal richness, but the mechanism of taxon delineation here warrants additional focus. In a multisite terrestrial survey, 60 times more traditional taxonomic scientific effort had to be expended in assigning only 10% of meiofaunal taxa to known species, compared with parallel studies that successfully assigned all vertebrate morphospecies to known taxa39. Lambshead40, using
phological taxonomy, spent 3 years describing 113 nematode mor-phospecies from the Firth of Clyde region (including the Prestwick sampling site), from approximately one-fifth of the volume of sedi-ment analysed here. Our study identified 182 Nematoda OCTUs in approximately 3% of the time. Moreover, whereas the expertise of mor-phological taxonomists is, because of necessity, restricted to certain groups, high-throughput nSSU sequencing enables the simultaneous OCTU delineation of multiple phyla from large numbers of samples. Importantly, metagenetic analyses can also be linked retrospectively to morphospecies by using reverse taxonomy41. The approaches
described provide a rapid, objective and cost-effective framework for exploring links between phyletic diversity, ecosystem structure and function. Such advances promise to substantially affect our ability to elucidate and predict the relationship between biodiversity and ecosystem function42–44: issues central to notions of resilience, recovery
and sustainability45.
Methods
Sample collection. A total of 24 benthic samples were collected from the low-tide mark along an 800 m transect, using a standard corer methodology46, from marine sandy beach substrata in Prestwick (three every 100 m between 55°30.481′N, 4°37.489′W and 55°30.194′N, 4°37.368′W) and a further three from Littlehamp-ton (50°48.021′N, 00°32.530′W), UK, during the summer of 2007. The latter sampling site was used as a geographically disparate out-group comparison. For the sequencing analysis, each biological sample comprised three pooled 44 mm diameter×100 mm benthic samples taken approximately 10 m apart. An additional core was taken for sediment analysis. All samples were immediately fixed in 500 ml storage pots containing 300 ml of DESS (20% DMSO and 0.25 M disodium EDTA, saturated with NaCl, pH 8.0)47.
The meiofaunal size fraction was mechanically separated from the sand and concentrated by decanting five times with filtered tap water through a 45 µm filter. Subsequent separation from fine silt was achieved by repetitive centrifugation in 1.16 specific gravity LUDOX-TM solution48. Following centrifugation, each sample was retained on a distinct mesh sieve, which was then folded, sliced and placed in a 15 ml falcon tube and kept at − 80 °C until DNA extraction. Samples were lysed overnight at 55 °C in lysis buffer (100 mM Tris–HCl, pH7.5; 100 mM NaCl; 100 mM EDTA; 1% SDS, 500 µg ml − 1 proteinase K), assisted by spinning wheel mixing, and DNA extracted with the QIAamp DNA Blood Maxi Kit (Qiagen) following the manufacturer’s protocol (http://www.nature.com/naturecommunications). Primer design and PCR strategy. The genes coding for rRNA have been used for decades for the identification of microbial species49,50 and are well suited for tax-onomy, mainly because they are ubiquitous in cellular organisms, are of relatively large size, contain highly conserved and variable regions that facilitate primer de-sign and are present in tandemly repeated, multiple copies enabling efficient PCR amplification38,41,51. For environmental metagenetic discovery, we chose the nSSU, as considerably more reference sequences are available in public databases for nSSU (1,246,462) than for the large subunit (LSU) (180,344) (ref. 52). Moreover, ‘universal’ nSSU primers have been shown to amplify more taxa from mock communities than from those designed for the LSU17. The 5′ region of the nSSU exhibits more segregating sites than the 3′ region in Metazoa38 and so was selected as the target area for OCTU discrimination. MEGA version 4.1 (ref. 53) was used to align and compare a wide range of metazoan nSSU sequences with respect to existing degenerate primers and putative new priming sites spanning a region between 250 and 500 bp in length (a combination of average mean read length and maximum permitted amplicon size of a 454 Life Sciences, Roche Applied Science GSFLX amplicon sequencing run). Of all primer permutations, SSU_FO4 (5′-GCTT GTCTCAAAGATTAAGCC-3′) and SSU_R22 (5′-GCCTGCTGCCTTCCTT GGA-3′)14 primers were selected, as they exhibited pronounced homology across meiofaunal phyla, but also flanked a highly divergent region of the nSSU and were used for subsequent amplicon generation. Fusion primers were then developed in which a proprietary primer sequence (Adaptor A or B) of the Roche 454 GSFLX sequencing technology and a sample-specific five nucleotide key tag (to differenti-ate between multiple samples) were included54. All fusion primers were designed using PRIMER PREMIER 5.0 (Premier Biosoft International), considering physical and structural properties of the oligonucleotides (such as annealing temperature, G + C percentage, hairpins and false priming). The forward fusion primers were ~45 bases in length and designed such that the 454 A-adaptor is followed by the tag (each of which differed by at least two bases)54, and then by the experimen-tal forward primer (SSU_FO4). The reverse primers were designed similarly, to optimize thermal compatibility. PCR amplification of the specified nSSU region was performed using 1 µl of genomic DNA template (1:500 dilutions) in 3 × 40 µl reactions using Pfu DNA polymerase (Promega). PCR conditions involved a 2 min denaturation at 95 °C followed by 35 cycles of 1 min at 95 °C, 45 s at 57 °C, 3 min at 72 °C and a final extension of 10 min at 72 °C. Negative controls (ultrapure water only) were included for all amplification reactions. Electrophoresis of triplicate PCR products was undertaken on a 2% gel with Top Vision LM GQ Agarose (Fermentas), and the expected 450 bp fragment was purified using the QIAquick Gel Extraction Kit (Qiagen), following the manufacturer’s instructions, before pooling identical samples. All purified PCR products were then quantified with an Agilent Bioanalyser 2100, diluted to the same concentration, pooled together to create a single sample and sequenced in one direction (A-Amplicon) on half a plate of a Roche 454 GSFLX (454 Life Sciences, Roche Applied Science) sequenc-ing platform at Liverpool University’s Centre for Genomic Research, UK. Further details regarding the rationale, theory and execution of environmental metagenetic analyses of the meiofaunal biosphere can be found in Creer et al.7
Sediment analysis. Particle size analysis was carried out using a Malvern Master-sizer 2000, which uses laser diffraction to calculate the particle size distribution for individual sediment grains in the range 0.02–2,000 µm. To prevent flocculation, before testing, the samples were immersed for 24 h in distilled water with added dispersant (sodium hexametaphosphate). The Mastersizer determines particle size distribution by volume and the results of the particle size analysis are reported as the cumulative median grain size.
Data analysis. Sequences generated from the Roche 454 GSFLX pyrosequenc-ing were analysed uspyrosequenc-ing the OCTUPUS pipeline (supplementary software avail-able at http://octupus.sourceforge.net/). Briefly, OCTUPUS comprises a number of Perl scripts that concatenate quality trimming55, tag matching and size cull-ing, before the assignation of user-defined substitutional difference-based cutoff clustering. The clustering module of OCTUPUS involves three steps. Initially, sequences are compared successively with each other by MEGABLAST56 to de-fine different OCTU groups, separated by a user-dede-fined genetic distance. If an unassigned sequence matches an existing OCTU sequence (for example, 97% similarity or more), the companion sequences are aligned using MUSCLE23, and if the resulting consensus sequence differs from the original alignment, the consensus OCTU sequence is changed to reflect the diversity of sequences within the OCTU cluster. If the consensus OCTU does not change following a preset number of novel comparisons, further consensus OCTU matching
sequences will be placed within the OCTU cluster, bypassing a computation-ally intractable number of multiple sequence alignments that would otherwise be required in the analysis of large metagenetic data sets. Benchmarking trials have shown that 10 additions to the OCTU cluster without consensus amend-ment provide a stable estimate of OCTU numbers and were used throughout in this study. OCTUs were annotated using MEGABLAST (megablast -d database path -D 2 -p 90 -a 2 -b 1 -v 1 -i infile -F F > outfile) against the downloaded GenBank/EMBL/DDBJ nucleotide database and taxonomic annotation was restricted to matches of 90% and higher.
Acknowledging concerns regarding the misinterpretation of levels of richness due to the formation of recombinant DNA molecules in environmental DNA sequencing26,57, we adopted an aggressive putative chimera culling regime embed-ded within the OCTUPUS pipeline for the primary data set7. The OCTUPUS chimera screening was followed by manual removal of putative false positive OCTUs (that is, those that exhibited more than 10 base pair mismatches with the MEGABLAST reference sequence) and retrieval of clear false-negative chimeras (that is, those that exhibited 100% length matches with already sequenced taxa). To compare independent estimates of taxon richness, the OCTUPUS cluster-ing algorithm was also tested against the HCluster algorithm of ESPRIT13 on a subsample of the larger data set. Finally, OCTU richness generated from the above OCTUPUS algorithm was benchmarked at a range of percentage similarity cutoff against a reference data set comprising the metagenetic analysis of a phylogeneti-cally diverse combination of 41 nematode17 species. Scripts for preprocessing the above data are available from the Natural Environment Research Council’s Envi-ronmental Bioinformatics Centre Script Repository (http://nebc.nerc.ac.uk/tools/ scripts/general-bioinformatics).
For the 54 OCTUs exhibiting BLAST hits below 90% identity, manual MEGAB-LAST searches were conducted and phylogenetic affinities investigated by means of the NCBI taxonomy browser. Sequence data and all associated fusion primer codes have been deposited in the Entrez short read archive under accession number SRA009394.
For direct ecological comparisons of between-sample OCTU richness, the original data set was reanalysed using 15,000 randomly picked sequences (over 200 bases in length, n = 135,000) from each sample, before OCTUPUS clustering and annotation. The total number of OCTUs generated from the original and stand-ardized data sets was significantly correlated (Spearman’s coefficient: ρ = 0.783,
P = 0.0132); nevertheless, interpretations derived from direct comparisons of
richness between samples refer to the standardized data set.
Sample cluster analyses (UPGMA) were performed using the Multivariate Statistical Package58 using Sorensen’s Coefficient on a binary (presence/absence of OCTU) data matrix. Phylum-specific rarefaction curves for the Prestwick transect were generated using EstimateS (Version 8.2.0, R.K. Colwell) using a range of estimators (for example, ACE, Chao1, Jackknife1 and Bootstrap) that yielded very similar results. The ACE abundance-based coverage estimator59 was used because it represents a consensus view of the analyses and has proven to work well for the analysis of metagenetic data sets3.
References
1. Blaxter, M. Molecular systematics—counting angels with DNA. Nature 421, 122–124 (2003).
2. May, R. M. How many species are there on earth. Science 241, 1441–1449 (1988).
3. Huber, J. A. et al. Microbial population structures in the deep marine biosphere. Science 318, 97–100 (2007).
4. Sogin, M. L. et al. Microbial diversity in the deep sea and the underexplored ‘rare biosphere’. Proc. Natl Acad. Sci. USA 103, 12115–12120 (2006).
5. Angly, F. E. et al. The marine viromes of four oceanic regions. PLoS Biol. 4, e368 (2006).
6. Desnues, C. et al. Biodiversity and biogeography of phages in modern stromatolites and thrombolites. Nature 452, 340–345 (2008).
7. Creer, S. et al. Ultrasequencing of the meiofaunal biosphere: practice, pitfalls and promises. Mol. Ecol. 19(Suppl 1), 4–20 (2010).
8. Dunn, C. W. et al. Broad phylogenomic sampling improves resolution of the animal tree of life. Nature 452, 745–749 (2008).
9. Philippe, H. et al. Phylogenomics revives traditional views on deep animal relationships. Curr. Biol. 19, 706–712 (2009).
10. Snelgrove, P. V. R. Getting to the bottom of marine biodiversity: sedimentary habitats—ocean bottoms are the most widespread habitat on Earth and support high biodiversity and key ecosystem services. Bioscience 49, 129–138 (1999).
11. Lambshead, P. J. D. in Nematode Morphology, Physiology and Ecology Vol. 1 (eds Chen, Z., Chen, S. & Dickson, D.) 438–492 (Tsinghua Univ Press, 2004). 12. Giere, O. Meiobenthology: The Microscopic Motile Fauna of Aquatic Sediments
(Springer-Verlag, 2009).
13. Sun, Y. et al. ESPRIT: estimating species richness using large collections of 16S rRNA pyrosequences. Nucleic Acids Res. 37, e76 (2009).
14. Blaxter, M. L. et al. A molecular evolutionary framework for the phylum Nematoda. Nature 392, 71–75 (1998).
15. Bhadury, P. et al. Development and evaluation of a DNA-barcoding approach for the rapid identification of nematodes. Mar. Ecol-Prog. Ser. 320, 1–9 (2006). 16. Stage, D. E. & Eickbush, T. H. Sequence variation within the rRNA gene loci of
12 Drosophila species. Genome Res. 17, 1888–1897 (2007).
17. Porazinska, D. et al. Evaluating high-throughput sequencing as a method for metagenomic analysis of nematode diversity. Mol. Ecol. Resour. 9, 1439–1450 (2009).
18. Tipper, J. Rarefaction and rarefiction—the use and abuse of a method in paleoecology. Paleobiology 5, 423–434 (1979).
19. Huse, S. M., Huber, J. A., Morrison, H. G., Sogin, M. L. & Welch, D. M. Accuracy and quality of massively parallel DNA pyrosequencing. Genome Biol. 8, R143 (2007).
20. Margulies, M. et al. Genome sequencing in microfabricated high-density picolitre reactors. Nature 437, 376–380 (2005).
21. Kunin, V., Engelbrektson, A., Ochman, H. & Hugenholtz, P. Wrinkles in the rare biosphere: pyrosequencing errors lead to artificial inflation of diversity estimates. Environ. Microbiol. 12, 118–123 (2010).
22. Creer, S., Pook, C. E., Malhotra, A. & Thorpe, R. S. Optimal intron analyses in the trimeresurus radiation of Asian pitvipers. Syst. Biol. 55, 57–72 (2006).
23. Edgar, R. C. MUSCLE: multiple sequence alignment with high accuracy and high throughput. Nucleic Acids Res. 32, 1792–1797 (2004).
24. Schloss, P. & Handelsman, J. Introducing DOTUR, a computer program for defining operational taxonomic units and estimating species richness. Appl.
Environ. Microbiol. 71, 1501–1506 (2005).
25. Warwick, R. M., Platt, H. M. & Somerfield, P. J. Free-living marine nematodes.
Part III. British Monhysterids (Field Studies Council, 1998).
26. Reeder, J. & Knight, R. The ‘rare biosphere’: a reality check. Nat. Methods 6, 636–637 (2009).
27. Quince, C. et al. Accurate determination of microbial diversity from 454 pyrosequencing data. Nat. Methods 6, 639–641 (2009).
28. Huse, S. M., Welch, D. M., Morrison, H. G. & Sogin, M. L. Ironing out the wrinkles in the rare biosphere through improved OTU clustering. Environ.
Microbiol. 12, 1889–1898 (2010).
29. Platt, H. M. & Warwick, R. M. Free-living marine nematodes. Part I. British
Enoplids (Cambridge Univ Press, 1983).
30. SMEBD. World Register of Marine Species. Accessed at http://www. marinespecies.orgon [27-07-2009] (2009).
31. Aguinaldo, A. M. et al. Evidence for a clade of nematodes, arthropods and other moulting animals. Nature 387, 489–493 (1997).
32. Jonsson, K. I. The evolution of life histories in holo-anhydrobiotic animals: a first approach. Integr. Comp. Biol. 45, 764–770 (2005).
33. Boucher, G. & Lambshead, P. J. D. Ecological biodiversity of marine nematodes in samples from temperate, tropical, and deep sea regions. Conserv. Biol. 9, 1594–1604 (1995).
34. Heip, C. et al. Analysis of community attributes of the benthic meiofauna of Frierfjord/Langesundfjord. Mar. Ecol-Prog. Ser. 46, 171–180 (1988). 35. Warwick, R. M., Dashfield, S. L. & Somerfield, P. J. The integral structure of a
benthic infaunal assemblage. J. Exp. Mar. Biol. Ecol. 330, 12–18 (2006). 36. Reise, K. Plathelminth diversity in littoral sediments around the island of Sylt
in the North Sea. Prog. Zoo1. 36, 469–480 (1988).
37. Blaxter, M. et al. Defining operational taxonomic units using DNA barcode data. Philos. Trans. R Soc. Lond B Biol. Sci. 360, 1935–1943 (2005). 38. Floyd, R., Abebe, E., Papert, A. & Blaxter, M. Molecular barcodes for soil
nematode identification. Mol. Ecol. 11, 839–850 (2002).
39. Lawton, J. H. et al. Biodiversity inventories, indicator taxa and the effects of habitat modification in tropical forest. Nature 391, 72–76 (1998). 40. Lambshead, P. J. D. Sub-catastrophic sewage and industrial-waste
contamination as revealed by marine nematode faunal analysis. Mar. Ecol-Prog.
Ser. 29, 247–260 (1986).
41. Markmann, M. & Tautz, D. Reverse taxonomy: an approach towards determining the diversity of meiobenthic organisms based on ribosomal RNA signature sequences. Philos. Trans. R Soc. Lond B Biol. Sci. 360, 1917–1924 (2005). 42. Danovaro, R. et al. Exponential decline of deep-sea ecosystem functioning
linked to benthic biodiversity loss. Curr. Biol. 18, 1–8 (2008).
43. Worm, B. et al. Biodiversity loss in the ocean: how bad is it? Response. Science 316, 1282–1284 (2007).
44. Solan, M. et al. Extinction and ecosystem function in the marine benthos.
Science 306, 1177–1180 (2004).
45. Palumbi, S. R., McLeod, K. L. & Grunbaum, D. Ecosystems in action: lessons from marine ecology about recovery, resistance, and reversibility. BioScience 58, 33–42 (2008).
46. Platt, H. M. & Warwick, R. M. Free-Living Marine Nematodes (Cambridge Univ Press, 1988).
47. Yoder, M. et al. DESS: a versatile solution for preserving morphology and extractable DNA of nematodes. Nematology 8, 367–376 (2006). 48. de Jonge, V. & Bouwman, L. A simple density separation technique for
quantitative isolation of meiobenthos using the colloidal silica Ludox-TM.
49. Doi, R. H. & Igarashi, R. T. Conservation of ribosomal and messenger ribonucleic acid cistrons in bacillus species. J. Bacteriol. 90, 384–390 (1965). 50. Pace, B. & Campbell, L. L. Homology of ribosomal ribonucleic acid diverse
bacterial species with Escherichia coli and Bacillus stearothermophilus.
J. Bacteriol. 107, 543–547 (1971).
51. Carvalho, G. et al. Genomics in the Discovery and Monitoring of Marine
Biodiversity (Springer, 2010).
52. Pruesse, E. et al. SILVA: a comprehensive online resource for quality checked and aligned ribosomal RNA sequence data compatible with ARB. Nucleic Acids
Res. 35, 7188–7196 (2007).
53. Tamura, K., Dudley, J., Nei, M. & Kumar, S. MEGA4: molecular evolutionary genetics analysis (MEGA) software version 4.0. Mol. Biol. Evol. 24, 1596–1599 (2007). 54. Binladen, J. et al. The use of coded PCR primers enables high-throughput
sequencing of multiple homolog amplification products by 454 parallel sequencing. PLoS ONE 2, e197 (2007) and comments therein.
55. Chou, H. H. & Holmes, M. H. DNA sequence quality trimming and vector removal. Bioinformatics 17, 1093–1104 (2001).
56. Zhang, Z., Schwartz, S., Wagner, L. & Miller, W. A greedy algorithm for aligning DNA sequences. J. Comput. Biol. 7, 203–214 (2000).
57. von Wintzingerode, F., Gobel, U. B. & Stackebrandt, E. Determination of microbial diversity in environmental samples: pitfalls of PCR-based rRNA analysis. FEMS Microbiol. Rev. 21, 213–229 (1997).
58. MVSP—a multivariate statistical package for windows, ver. 3.12d (Kovach Computing Services, 1999).
59. Chazdon, R., Colwell, R., Denslow, J. & Guariguata, M. in Forest Biodiversity
Research, Monitoring and Modeling: Conceptual Background and Old World Case Studies (eds Dallmeier, F. & Comiskey, J.) 285–309 (Parthenon
Publishing, 1998).
Acknowledgments
We thank Neil Hall, Andrew Cossins and Margaret Hughes of the Liverpool Advanced Molecular Genetic Facility for Roche 454 sequencing support, in addition to the staff of Edinburgh University’s Gene-Pool facility and Holly Bik for field support. We also thank Emlyn Roberts, Wendy Grail, Simeon Walker and technical support staff at Bangor University. This work was supported by a Natural Environment Research Council (NERC) New Investigator Grant (NE/E001505/1) and a Post Genomic and Proteomics Grant (NE/F001266/1) to S.C. and a Portuguese Foundation for Science and Technology (FCT) grant (SFRH/BD/27413/2006) to V.G.F.
Author contributions
S.C., V.G.F., G.R.C. and W.K.T. conceived and designed the experiments. V.G.F., H.F.J., S.P.N., M.P. and S.C. performed the experiments. V.G.F. S.C. and W.S. analysed the data. S.C., G.R.C., M.L.B., M.P., P.J.D.L., W.K.T., S.P.N. and D.M.P. were involved in the critical review of the manuscript. V.G.F., G.R.C., D.M.P., M.L.B. and S.C. wrote the paper. Additional information
Competing financial interests: The authors declare no competing financial interests. Reprints and permission information is available online at http://npg.nature.com/ reprintsandpermissions/
How to cite this article: Fonseca, V.G. et al. Second-generation environmental sequencing unmasks marine metazoan biodiversity. Nat. Commun. 1:98 doi: 10.1038/ncomms1095 (2010).
License: This work is licensed under a Creative Commons Attribution-NonCommercial-Share Alike 3.0 Unported License. To view a copy of this license, visit http://