LIFECYCLE INVESTMENT STRATEGIES:
AN ANALYSIS BASED ON EUROPEAN DATA
Joana Cardoso das Neves Fernandes
Project submitted as requirement for the conferral of
Master in Finance
Supervisor:
Prof. Doutor Luis Miguel da Silva Laureano, Assistant Professor,
ISCTE Business School, Department of Finance
Acknowledgements
It is with immense gratitude that I acknowledge the support and help of my supervisor Professor Luís Laureano, who was always available to help me during the last months. His contribution to this work was fundamental, since he reviewed my work in detail several times and made very constructive criticism over time.
I would like to thank the director of my department, Paulo Monteiro, who suggested the theme for this work and was always available to assist me along its execution. The rest of my work team was also useful, helping me in some parts of the work, such as data collection and use of numerical computation software.
I cannot find words to express my gratitude to my parents, sister and friends for the strong support and suggestions they gave me throughout the development of this work. I want especially thank José Ferreira, who was the responsible for grammar revision and worked during some weekends and nights to help me.
Abstract
Focusing on France, Germany, Italy, Spain and the United Kingdom, this study investigates if by following lifecycle strategies, investors accumulate more wealth by retirement age when comparing to other strategies. According to lifecycle strategies, portfolio’s exposure to risky assets should decline and investors should allocate more capital to riskless assets as they get older. We check if our results support two arguments behind lifecycle strategies. The first says that stocks outperform bonds in the long term and the second says that the risk of equity decreases in the long term. According to our results, between 1993 and 2012, a portfolio invested in benchmark equity indices of the 5 biggest European economies corresponded to a higher annualized return than a portfolio invested in 5 and 10 years government bonds of the same countries. Considering the standard deviation of returns of a portfolio invested in benchmark equity indices of the 5 biggest European economies in the same period, we find that the risk of stocks increased with the time horizon. We finally simulate the wealth accumulation of five age-invariant and two lifecycle portfolios, assuming savings of 1,000 Euros per year between 1993 and 2012. Among the various age-invariant portfolios, those which have a higher share invested in bonds produced the highest returns. Furthermore, with the exception of portfolio entirely composed of bonds, lifecycle portfolios outperformed all age-invariant portfolios, surpassing even the others portfolios with higher average shares held in bonds.
JEL Classifications: G11, O16
Resumo
Focando-se na França, Alemanha, Itália, Espanha e Reino Unido, este estudo investiga se o seguimento de estratégias de investimento lifecycle proporciona uma maior acumulação de riqueza até à idade da reforma, comparativamente a outras estratégias de investimento. De acordo com as estratégias lifecycle, a exposição dos portfolios a activos com risco diminui e a exposição a activos sem risco aumenta, à medida que a idade dos investidores avança. Verificamos também se os nossos resultados suportam dois argumentos por detrás destas estratégias. O primeiro defende que o desempenho das ações supera o das obrigações no longo prazo e o segundo afirma que o risco das ações diminui no longo prazo. Os nossos resultados demonstram que entre 1993 e 2012, um portfólio investido nos índices acionistas de referência das 5 maiores economias europeias proporcionou um maior retorno anualizado do que um portfólio investido em obrigações a 5 e 10 anos dos mesmos países. Analisando o desvio-padrão dos retornos de um portfólio investido nos índices de referência das 5 maiores economias europeias, concluímos que o risco do investimento em ações aumentou com o horizonte temporal. Finalmente, simulamos a acumulação de riqueza de cinco portfolios independentes da idade e de dois portfolios lifecycle, assumindo poupanças anuais de 1,000 euros entre 1993 e 2012. Entre os portfolios independentes da idade, aqueles que detinham mais obrigações foram aqueles que produziram retornos mais elevados. Por seu lado, à excepção do portfólio que apenas detinha obrigações, os portfolios lifecycle superaram todos os portfolios independentes da idade, até mesmo aqueles que detinham uma maior percentagem média de obrigações.
Classificações JEL: G11, O16
Sumário Executivo
As decisões de investimento são bastante importantes, na medida em que influenciam a acumulação de riqueza ao longo da vida dos investidores. Alguns consultores financeiros acreditam que os portfolios devem reflectir as características individuais dos investidores. Contudo, existem determinados padrões de investimento que são geralmente seguidos. Usualmente, a exposição dos portfolios a activos com risco diminui e a exposição a activos sem risco aumenta, à medida que a idade do investidor avança. Ao longo deste trabalho, este tipo de alocação de activos é designado por estratégias de investimento lifecycle.
Focando-se nas 5 maiores economias europeias - França, Alemanha, Itália, Espanha e Reino Unido -, este estudo investiga se o seguimento de estratégias de investimento lifecycle proporciona uma maior acumulação de riqueza até à idade da reforma, comparativamente a outras estratégias de investimento.
Antes de darmos resposta a este objectivo principal, verificamos se os nossos resultados suportam dois argumentos por detrás destas estratégias. O primeiro defende que o desempenho das ações supera o das obrigações no longo prazo e o segundo afirma que o risco das ações diminui no longo prazo.
Em 2008 ocorreu uma crise financeira global, considerada por muitos investigadores como a pior desde a Grande Depressão de 1930. Desde então, foram ainda desenvolvidos poucos estudos acerca desta temática. A isto acresce o facto de a maior parte dos estudos focarem-se apenas nos mercados norte-americanos.
De acordo com os nossos resultados, entre 1993 a 2012, um portfólio investido nos índices acionistas de referência das 5 maiores economias europeias proporcionou um maior retorno anualizado (+5.27%) do que um portfólio investido em obrigações a 5 e 10 anos dos mesmos países (+5.03%). Verificámos também uma tendência crescente na performance das acções face às obrigações, à medida que se aumentou o horizonte temporal do investimento. Estes resultados suportam o primeiro argumento das estratégias de investimento lifecycle.
Analisando o desvio-padrão dos retornos de um portfólio investido nos índices accionistas de referência das 5 maiores economias europeias durante o mesmo período, concluímos que o risco do investimento em ações aumentou com o horizonte temporal, em vez de diminuir. Assim, rejeitamos o segundo argumento das estratégias de investimento lifecycle.
Finalmente, simulamos a acumulação de riqueza de sete portfolios até à idade da reforma, assumindo poupanças anuais de 1,000 Euros ao longo dos 20 anos analisados. Simulamos a acumulação de riqueza de cinco portfolios independentes da idade, como um portfólio que apenas detém ações, um portfólio que apenas detém obrigações e um portfólio que detém igual percentagem de ações e obrigações. Consideramos ainda dois portfolios lifecycle, isto é, portfolios que diminuem a exposição a ações e aumentam a exposição a obrigações à medida que a idade dos investidores avança.
Entre 1993 e 2012, as obrigações foram a classe de activos com melhor desempenho, considerando reforços anuais da poupança. Consequentemente, entre os portfolios independentes da idade, aqueles que detinham mais obrigações foram aqueles que produziram retornos mais elevados. Por seu lado, à excepção do portfólio que apenas detinha obrigações, os portfolios lifecycle superaram todos os portfolios independentes da idade, até mesmo aqueles que detinham uma maior percentagem média de obrigações. Os resultados sugerem que o seguimento de estratégias lifecycle optimizou a performance do portfólio.
Contents
1 - Introduction ...1
2 - Literature Review ...4
2.1 - The Importance of Asset Allocation ...4
2.2 - Evidence of Portfolio Allocation Evolution with Age ...4
2.3 - Stocks versus Bonds Performance...5
2.4 - Relation between Stocks’ Risk and Horizon ...6
2.5 - Lifecycle Funds ...7
2.6 - Lifecycle Strategies Performance ...7
2.7 - The Exceptions to Lifecycle Model...8
3 - Questions, Methodology and Data ...9
3.1 - Study Questions ...9
3.2 - Methodology and Data...9
4 - Simulation Results... 13
4.1 - Performance of Equity Indices ... 13
4.2 - Performance of Government Bonds ... 15
4.3 - Comparison between Performance of Equity Indices and Government Bonds ... 18
4.4 - Simulation Results of Portfolios Assuming Annual Reinforcement of Savings... 21
5 - Conclusions ... 27
5.1 - Results Interpretation ... 27
5.2 - Limitations of this Work ... 30
5.3 - Suggestions for Future Research ... 30
References ... 31
Content of Tables
Table 1 - Asset Allocations Considered in This Work ... 11 Table 2 - Nominal Annualized Returns of the Benchmark Equity Indices of the 5 Biggest European Economies over the Last 5, 10 and 20 Years ... 13 Table 3 - Correlation of Nominal Annual Returns between 1993 and 2012 of the Benchmark Equity Indices of the 5 Biggest European Economies ... 14 Table 4 - Comparison of Nominal and Real Annualized Returns of the Benchmark Equity Indices of the 5 Biggest European Economies over the Last 5, 10 and 20 Years ... 15 Table 5 - Nominal Annualized Returns of 5 and 10 Years Government Bonds of the 5 Biggest European Economies over the Last 5, 10 and 20 Years ... 16 Table 6 - Correlation of Nominal Annual Returns between 1993 and 2012 of 5 and 10 Years Government Bonds of the 5 Biggest European Economies ... 17 Table 7 - Comparison of Nominal and Real Annualized Returns of 5 and 10 Years Government Bonds of the 5 Biggest European Economies over the Last 5, 10 and 20 Years ... ..18 Table 8 – Comparison of Nominal Annualized Returns of the Benchmark Equity Indices and 5 and 10 Years Government Bonds of the 5 Biggest European Economies over the Last 5, 10 and 20 Years... 19 Table 9 - Correlation of Nominal Annual Returns between 1993 and 2012 of the Benchmark Equity Indices and 5 and 10 Years Government Bonds of the 5 Biggest European Economies ... 20 Table 10 - Annualized Volatility of the Benchmark Equity Indices and 5 and 10 Years Government Bonds of the 5 Biggest European Economies over the Last 5, 10 and 20 Years . 20 Table 11 - Nominal Annualized Returns of the Benchmark Equity Indices and 5 and 10 Years Government Bonds of the 5 Biggest European Economies over Several Time Horizons between 1993 and 2012 ... 22 Table 12 - Wealth Accumulated by Portfolios 1 to 7 between 1993 and 2012 Assuming Annual Savings of 1,000 Euros (Ignoring Inflation) ... 23 Table 13 - Real Annualized Returns of the Benchmark Equity Indices and 5 and 10 Years Government Bonds of the 5 Biggest European Economies over Several Time Horizons between 1993 and 2012 ... 24 Table 14 - Wealth Accumulated by Portfolios 1 to 7 between 1993 and 2012 Assuming Annual Savings of 1,000 Euros (Considering Inflation) ... 25
Content of Figures
Figure 1 - Nominal Monthly Returns’ Annualized Volatility of the Benchmark Equity Indices and 5 and 10 Years Government Bonds of the 5 Biggest European Economies over Several Time Horizons between 1993 and 2012 ... 21 Figure 2 - Comparison of Wealth Accumulated by Portfolios 1 to 7 between 1993 and 2012 Assuming Annual Savings of 1,000 Euros (Ignoring Inflation) ... 23 Figure 3 - Comparison of Wealth Accumulated by Portfolios 1 to 7 between 1993 and 2012 Assuming Annual Savings of 1,000 Euros (Considering Inflation) ... 26
1-
Introduction
Investment decisions are quite relevant to the extent that they influence wealth accumulation for the lifelong investor. Some investors do not make the correct financial decisions throughout their lives, and often, people end up being exposed to too much risk that they do not readily understand. This is mainly due to wrong financial recommendations, bad personal guesses or insufficient research.
The choice of the optimal portfolio in a single period is a well-researched finance topic and several analytical solutions which address this issue are available. Markowitz (1952) shows how investors should allocate their portfolios over a single period, according to mean and variance of portfolio’s returns. However, market conditions are not constant, they are ever changing, and often it is a better choice to rebalance the portfolio over time. Thus, the simplifying approach of a single investment period does not always make sense. Merton (1969 and 1971) and Samuelson (1969) show that changing a portfolio over time can have important consequences on the optimization of a long term portfolio.
Some financial planners believe that every portfolio should reflect the investor’s individual characteristics. Nevertheless, there are certain patterns of investing that are usually followed. At the core of these investment strategies lives the implied belief, supported by Bodie and Crane (1997), that over the years the portfolio’s exposure to risky assets should decline and investors should allocate more capital to riskless assets. Throughout this work, this kind of asset allocation is designated as lifecycle investment strategies.
To answer the willingness of investors to readjust their portfolio as they age, some financial institutions have created lifecycle funds, which automatically adjust their composition as the investors’ age advances.
Focusing on the 5 biggest European economies- France, Germany, Italy, Spain and the United Kingdom-, this study investigates if by following lifecycle strategies, investors accumulate more wealth by retirement age when comparing to other investment strategies, such as investing solely on stocks or bonds.
Before we answer this main goal, we check if our results support two arguments behind lifecycle strategies. The first says that stocks outperform bonds in the long term and the second says that the risk of equity decreases in the long term.
There was a global financial crisis in 2008 which was considered by many researchers as the worst financial crisis since the Great Depression of 1930 and studies on this topic from that period are scarce. In addition to this, most studies on this subject focus only on United States. There are several reasons behind lifecycle investment strategies. Assuming the volatility of stocks’ returns as a measure of risk, Campbell and Viceira (2005) conclude that stocks’ risks reduce in the long term. Since older investors do not have as much time to invest as younger investors, they cannot eliminate the same amount of risk of stock investments.
On the other hand, investment advisers generally argue that stocks outperform bonds over long periods of time. Accordingly, it makes sense that young people invest more in stocks and less in bonds. Jagannathan and Kocherlakota (1996) document the historical returns on S&P-500 stocks and United States Treasury bills from 1926 until 1990 and computed an average annual real return to stocks of 8.8%, which compares with only 0.6% from Treasury bills. According to our results, between 1993 and 2012, a portfolio invested in benchmark equity indices of the 5 biggest European economies corresponded to a higher annualized return (+5.27%) than a portfolio invested in 5 and 10 years government bonds of the same countries (+5.03%). Furthermore, we conclude that as the time horizon increases, there was a slight upward trend in the performance of stocks compared to bonds. These results support the first argument of lifecycle strategies.
Considering the standard deviation of returns of a portfolio invested in benchmark equity indices of the 5 biggest European economies in the same period, we find that the risk of stocks increased instead of decreasing with the time horizon. Thus, we reject the second argument behind lifecycle strategies.
The findings of previous studies contrast in terms on the feasibility of lifecycle strategies. On this topic, Jurek and Viceira (2006) and Campbell and Viceira (1999, 2002) suggest that longer-term investors should invest more in equities, however, maintaining the need to perform periodic reviews of portfolio allocation, making adjustments as market conditions change. That is, investors may take into account not only their age, but also market conditions. In a study which compares the returns obtained by following different investment strategies over time focusing on United States equity markets, Poterba, Rauh, Venti and Wise (2006) conclude that the asset allocation of a lifecycle strategy can produce lower expected utility than a 100% stock allocation.
For simplification purposes, in this paper we consider only two classes of assets. As Cocco, Gomes and Maenhout (2005), we use stocks to represent the risky asset class and treasury debt securities to represent the riskless asset class.
We simulate wealth accumulation of seven portfolios assuming annual savings of 1,000 Euros between 1993 and 2012. We compute the returns of five age-invariant strategies, such as a portfolio entirely composed of stocks, a portfolio entirely composed of bonds, and a portfolio which holds the same share of stocks and bonds. We also consider two lifecycle portfolios, this is, portfolios which decrease the share held in stocks and increase the share held in bonds as investors grow older.
We conclude that bonds were the asset class with the best performance considering annual reinforcements of savings. Among the various age-invariant portfolios, those which have a higher share invested in bonds produced the highest returns. On the other hand, with the exception of portfolio entirely composed of bonds, lifecycle portfolios outperformed all age-invariant portfolios, surpassing even the others portfolios with higher average shares held in bonds. Our results suggest that a lifecycle allocation optimizes portfolio profitability.
To meet the objectives of the work, we start by analyzing the historical returns of benchmark equity indices and 5 and 10 years government bonds of the 5 biggest European economies from 1993 to 2012. Then, we compare the returns of stocks and bonds for each country and also the returns of the baskets of equity indices and the baskets of 5 and 10 years government bonds of these five countries. This stage of the work is complemented by a risk analysis of stocks and bonds. Finally, we compare investor’s wealth accumulation resulting from following different lifelong asset allocations strategies.
The remaining chapters of the work are as follow: Chapter 2 mentions works of other authors which we consider relevant to the study of lifecycle strategies. Chapter 3 presents the questions this study aims to respond and the expected responses to them. It also exposes and explains the assumptions made throughout the work and details the steps followed to compute the results. Chapter 4 presents our results and Chapter 5 responds to the issues rose in Chapter 3, admits the limitations of the work and makes suggestions for future research.
2-
Literature Review
2.1- The Importance of Asset Allocation
In the most developed countries, the increasingly aging population represents a problem for Social Security systems. Retirement income alone can be insufficient to maintain the standard of living people have at the time towards reaching this stage in life. To compensate for this, the level of private savings during working years has increased.
The right investment decisions through life are a very important topic because the investment strategies followed have a large impact on investors’ wealth accumulation. Good investment decisions during working years can help investors maintain a certain quality of life during their retirement years.
Focusing on the determinants of portfolio performance, Brinson, Hood and Beebower (1995) conclude that 93.6% of the portfolio’s return variation is explained by the investment policy that determines what asset classes to include and exclude from the portfolio. They conclude that investment policy is much more important than investment timing and selection decision of individual securities.
Recently, Xiong, Ibbotson, Idzorek and Chen (2010) decompose the portfolio’s total return into market return, asset allocation policy return in excess of the market return and return from active portfolio management. They conclude that together, market return and asset allocation policy return in excess of market return are the main determinants of the total return variance.
2.2- Evidence of Portfolio Allocation Evolution with Age
As has been concluded by many researchers, the strategy followed by most investors throughout their life follows the trend of decreasing the portfolio’s share of risky assets as age increases.
Campbell and Viceira (2002) argue that risky investments are more attractive to young households with more future working years before retirement and modest savings. As investor
age proceeds, the attractiveness of riskless investments increases, as human wealth reduces and financial wealth accumulates.
The Employee Benefit Research Institute (1996) analyze the asset allocation decisions of 180,000 employments of AT&T, IBM and the New York Insurance Company, and verify that older workers have larger allocations devoted to non equity investments than younger workers.
Collecting data from a survey of participants in TIAA-CREF1, Bodie and Crane (1997) reach similar conclusions. The survey includes information about participant’s total asset holdings inside and outside retirement accounts and the conclusions are that personal asset allocations follow financial expert suggestions and economic theory: generally, the share of total assets that people hold in stocks declines with age.
Addressing the relationship among the risk level of portfolio, the investment horizon, and the investor risk tolerance, Schooley and Worden (1999) conclude that portfolio risk increases with investor’s time horizon and willingness to increase risk. On the same topic, focusing on an Italian defined contribution pension fund between 2002 and 2008, Cappelletti, Guazzarotti and Tommasino (2010) argue that the willingness of investors to keep risky assets in the portfolio decreases significantly with age and inertia sometimes becomes very expensive.
2.3- Stocks versus Bonds Performance
The majority of financial researchers assume that the higher the risk you take, the greater the potential return. People have to receive an extra reward for bearing more risk. This way, once stock investments have generally more risk than bonds investments, they are usually associated to a larger potential return.
In agreement with this, Jagannathan and Kocherlakota (1996) document the historical returns on S&P-500 stocks and United States Treasury bills from 1926 until 1990. They find that during this period, stocks returned 8.8% and bills returned 0.6% yearly, on average. In the 65 years reported, the standard deviation of S&P 500 annual returns was about 21%, while the standard deviation of Treasury bills annual returns was about 4.4%.
1
Teachers Insurance and Annuity Association – College Retirement Equities Fund is a 183 billion dollars organization that manages self-directed retirement funds
Despite the excellent performance of stocks in the past, recently, Ibbotson and Chen (2009) conclude that in the United States, bonds delivered higher returns compared to stocks at horizons of 1, 5 and 10 years between 1999 and 2009. They also find that although stocks surpassed bonds in the 40 years before 2009, the returns were similar.
Over the next chapters we analyze this issue by focusing on European equity and bond markets between 1993 and 2012.
2.4- Relation between Stocks’ Risk and Horizon
One of the main arguments used to explain the greater exposure to stocks for younger investors, is that stocks’ risk reduces in the long term. Glassman and Hasset (1999) argue that despite financial analysts and media warning that stocks are extremely risky, over the long term, stocks are less risky than treasury bonds. In one of the most famous books that address this issue, Siegel (2007) reaches similar conclusions. He demonstrates that over long periods of time, stock returns become more predictable than bond returns in terms of purchasing power.
Time variation in expected returns is the subject of a study of Barberis(2000) which argues that it induces a mean-reversion in returns, mitigating the growth of conditional variances of long horizon returns. This way, equities are less risky at long horizons and investors should allocate more to equities as the investment horizon increases. In the same way, Coggeshall and Wu (2005) from Morgan Stanley, focusing on portfolio’s allocation and long term returns find that unlike bonds, stocks show mean reversion for long term. Because of this, bonds are riskier than stocks to hold in periods equal or greater than 15 years.
The idea that stocks’ risk diminishes in the long term, nonetheless, is not globally accepted. According to Jagannathan and Kocherlakota (1996), investors are concerned about the magnitude of potential losses and not just the probability of these losses occurring. In a long time horizon, investors can face huge losses, for example, when confronted with several adverse decades to stock markets. The potential loss is much higher with a larger time frame, although the probability that these conditions occur is reduced, considering stocks’ past historical performance.
2.5- Lifecycle Funds
To answer the willingness of investors to readjust their portfolio as they age, some financial institutions, such as Vanguard2, T Rowe Price3 and TIAA-CREF have created lifecycle funds. These kinds of funds are increasingly popular and are characterized by automatically adjusting their composition as the investors’ age advances. Lifecycle funds invest in stocks and fixed income as a function of time, reducing portfolio exposure to stocks as investors reach retirement age.
In the United States, ex-president George W. Bush proposed a Social Security plan that allowed individuals from 47 years old to choose a lifecycle portfolio managed by the government for their personal account or sign a document indicating that they understand the risks of not following a lifecycle plan. The president released his personal accounts publically to demonstrate the high returns people can reach holding lifecycle funds. Nevertheless, his proposal was not implemented.
According to Poterba, Rauh, Venti and Wise (2006), there were more than 250 target-year lifecycle funds in mutual funds market in 2005, and between 2000 and 2005 the assets of lifecycle funds increased from 5,5 billion dollars to 47,1 billion dollars. Expenses incurred by investors who hold these funds are typically higher than what could be paid if an investor would select mutual funds from a company offering no-load4 index funds with low expense ratios and then rebalance them over time.
2.6- Lifecycle Strategies Performance
Focusing on European equity markets, the main purpose of this paper is to verify if by following lifecycle strategies, investors accumulate more wealth by retirement age when comparing to other investment strategies,. This subject has been studied by some researchers. Most of them, unlike us, focused on American equity markets. Simulating a portfolio which follows lifecycle investment rules, Shiller (2005) computed a median internal rate of return of 3.4%. Furthermore, the portfolio lost money 32% of the time. Investing in United States’
2
Vanguard Group is an American investment management company
3
T. Rowe Price is a publicly owned investment firm
4
stocks, the investor would lose money only 2% of the time and would have a median internal rate of return of 5.9%. Shiller concludes that the lifecycle rules are not optimal.
Poterba, Rauh, Venti and Wise (2006), analyze how different asset allocation strategies throughout the investor work career affect the retirement wealth and the expected utility of wealth at retirement. They consider rules that allocate a constant portfolio share to different assets at all investor ages and "lifecycle rules” which vary the share of the portfolio held in equities and bonds with the advancing age of the investor. They find that to low levels of risk aversion, the historical performance of stocks and bonds implies a higher expected utility of an all-stock investment allocation rule comparatively to more conservative strategies.
2.7- The Exceptions to Lifecycle Model
Most people have risk free labor incomes or incomes dominated by person-specific risk that is generally poorly correlated with stock returns. In such cases, lifecycle strategies are appropriate.
However, people with peculiar profiles should follow different patterns of investment. Viceira (2001) finds that the increase of idiosyncratic labor income risk or the positive correlation between investor labor income and stock returns can reduce portfolio's optimal allocation of young investors to stocks to the same level held by retired investors. Jagannathan and Kocherlakota (1996) reach the same conclusion. They show that in the case where the investor’s labor income is highly correlated with stock returns, the investor should invest not less but more in stocks with advancing age. Once the value of his future labor income falls as the years pass, the share of wealth highly correlated with stocks returns reduces. To compensate, the investor should invest more in stocks over time.
3-
Questions, Methodology and Data
3.1-
Study Questions
Based on our results, we intend to answer the following questions: 1) Do stocks outperform bonds in the long term?
We anticipate that our results confirm that stocks outperform bonds in the long term. Thereby, we suppose the existence of a positive risk premium which corresponds to the excess of the returns in stocks compared to bonds.
2) Does the risk of stocks decrease in the long term?
We expect that our results support the idea that stocks’ risk diminishes in the long term, being in agreement with conventional financial literature.
3) Does the following of lifecycle strategies translate into more wealth accumulated by retirement age compared with other age-independent strategies?
We forecast that by investing solely in stocks rather than by following lifecycle strategies, investors can accumulate more wealth by retirement age.
3.2-
Methodology and Data
This work focuses on the 5 biggest European economies: France, Germany, Italy, Spain and the United Kingdom. Together, the stock markets of these countries represent 69.8% of capitalization of European stock markets and 19.4% of world stock markets, according to Dimson, Marsh and Staunton (2001).
We consider that people start to save for retirement at age 47 and retire at age 67, which is a realistic value representative of the biggest European economies that recently have been increasing retirement age. According to Organization for Economic Co-operation and Development (2012), retirement age in France, Germany, Italy, Spain and the United Kingdom is 62, 67, 69, 67 and 68, respectively. Due to limitations in the availability of historical data for some selected equity indices, we consider an investment horizon of only 20 years.
We simulate the wealth accumulated by seven different portfolios between 1993 and 2012. For simplification purposes, we consider only two classes of assets. As Cocco, Gomes and Maenhout (2005), we use stocks to represent the risky asset class and treasury debt securities to represent the riskless asset class.
We start by analyzing the historical returns of benchmark equity indices of the 5 biggest European economies - CAC 40 (France), DAX 30 (Germany), FTSE Italia All-Share5 (Italy), IBEX 35 (Spain) and FTSE 100 (United Kingdom). We compute the nominal annualized returns of each equity index along three time horizons: 5 years (2008-2012), 10 years (2003-2012) and 20 years (1993-(2003-2012). We make the same analysis for the basket of the 5 indices. Then, we find the correlations of the nominal annual returns between 1993 and 2012 of the five selected equity indices. All quotes used throughout the study are extracted from Bloomberg.
Finally, we compute the real annualized return rates, that is, the nominal annualized return rates adjusted for inflation. We do this for the same three terms we use for the nominal annualized returns. The formula is shown below:
(1)
Where represents the nominal annualized return rate and represents the annualized inflation rate. We consider the percent change of average consumer prices from the International Monetary Fund (2012)6 as inflation.
Ibbotson and Chen (2009) compare stocks and bonds returns between 1926 and 2009, using for this purpose intermediate-term (5 to 10 years) and long term (more than 10 years) government bonds. However, since we analyze a period of only 20 years, we only consider intermediate-term bonds.
We explore the historical returns of 5 and 10 years government bonds of France, Germany, Italy, Spain and the United Kingdom, measured by their yields. We use historical data of 5 and 10 years government bond generic indices of these countries from 1993 to 2012. For years without historical data, we assume a year return equal to the coupon paid by a government bond with the same maturity issued that year. Assuming an investment of the
5
MIB 30 Index between 1993 and 2008; FTSE Italia All-Share Index between 2009 and 2012.
6
same proportion in 5 and 10 years bonds for each country, we compute the nominal annualized returns of each country government bonds along three time horizons: 5 years (2008-2012), 10 years (2003-2012) and 20 years (1993-2012). We do the same analysis to the basket of the 5 and 10 years bonds of 5 countries. We find the correlations of the nominal annual returns between 1993 and 2012 of bonds of different countries and finally we compute the real annualized return rates for the same three terms we use for the nominal annualized returns.
We compare the nominal returns of stocks and bonds for each country along 5 years (2008-2012), 10 years (2003-2012) and 20 years (1993-2012). We do the same to thing to the basket of equity indices and the basket of 5 and 10 years government bonds of the five countries. The difference between the return on stocks and bonds represents the equity risk premium, one of the most important fundamental concepts in modern finance. We finally find the correlation of the nominal annual returns between 1993 and 2012 of stocks and bonds of each country. This stage of the work is complemented by a risk analysis of stocks and bonds. We use annualized standard deviation of nominal monthly returns as a risk measure.
Finally, we compare investor’s wealth accumulation resulting from following different lifelong asset allocations strategies between 1993 and 2012. We make two analyses: a first where we consider nominal annual rates of return, and a second analysis where we assume real rates of return. We simulate the returns achieved by seven potential asset allocations:
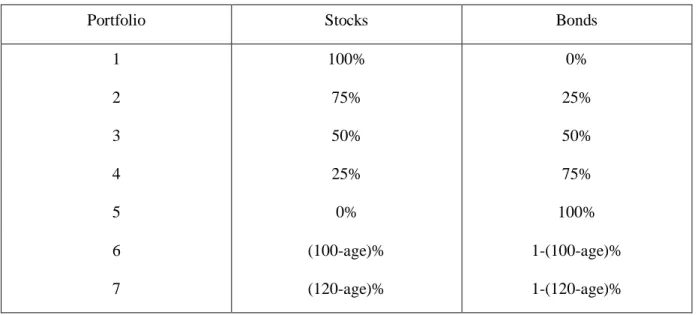
Table 1 - Asset Allocations Considered in This Work
Portfolio Stocks Bonds
1 100% 0% 2 75% 25% 3 50% 50% 4 25% 75% 5 0% 100% 6 (100-age)% 1-(100-age)% 7 (120-age)% 1-(120-age)%
Compositions of portfolios 1 to 5 do not vary throughout investor’s life. Portfolios 1 and 2 are aggressive: the first is entirely composed of stocks while the second holds mostly stocks (75%). Portfolio 3 holds the same share of stocks and bonds. Portfolio 4 holds mostly bonds (75%) and Portfolio 5 is entirely composed of bonds. Portfolios 6 and 7 are rebalanced at the beginning of each investment year and follow a lifecycle investment policy: both decrease the share held in stocks as investors grow older. Following the investment policy for portfolio 6, an investor starts holding 53% in stocks when reaching 47 years of age, with this proportion falling to 34% when reaching the age of 66. Following portfolio 7 investment policy, an investor starts holding 73% in stocks at 47 years old with this proportion falling to 54%, when reaching the age of 66.
We assume that portfolios which hold stocks invest in benchmark equity indices of France, Germany, Italy, Spain and the United Kingdom, holding the same share in each equity index. In the same way, we consider that portfolios which hold bonds invest in 5 and 10 years governments bonds of the same countries, holding the same share in each country bonds. To compute wealth amount accumulated until retirement age we use the following formula:
(2)
Where represents the annual investor portfolio return. For portfolio 1, this rate expresses stocks year specific return and for portfolio 5, this rate represents bonds year specific return. For the other portfolios, corresponds to the year specific return of the mix of stocks and bonds held. We use historical data to compute annual portfolios returns. is the investor annual contribution to saving.
We simulate wealth accumulation of portfolios 1 to 7 assuming annual savings of 1,000 Euros, between 1993 and 2012. This value represents savings easily reachable by workers of the 5 largest European economies, since it represents only 3.0% of average annual gross labor income of these countries, according to Eurostat7 (2009).This value is merely exemplary, since it does not influence the conclusions of this study.
7
4-
Simulation Results
4.1-
Performance of Equity Indices
Before compute the wealth accumulated between 1993 and 2012 by each of the seven asset allocations, we analyze the historical nominal annualized returns of the benchmark equity indices of the 5 biggest European economies along 5 years (2008-2012), 10 years (2003-2012) and 20 years (1993-2012). The following table illustrates these returns and appendixes 1 to 5 represent the performance of the five equity indices between 1993 and 2012.
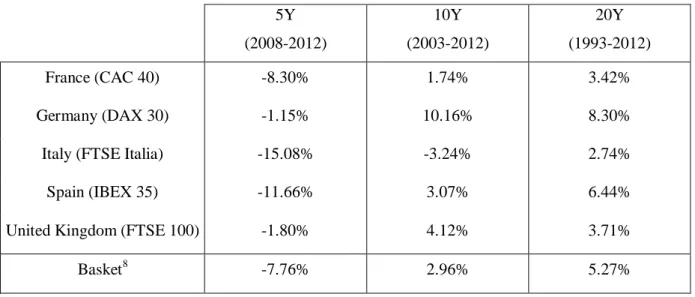
Table 2 - Nominal Annualized Returns of the Benchmark Equity Indices of the 5 Biggest
European Economies over the Last 5, 10 and 20 Years
5Y (2008-2012) 10Y (2003-2012) 20Y (1993-2012) France (CAC 40) -8.30% 1.74% 3.42% Germany (DAX 30) -1.15% 10.16% 8.30%
Italy (FTSE Italia) -15.08% -3.24% 2.74%
Spain (IBEX 35) -11.66% 3.07% 6.44%
United Kingdom (FTSE 100) -1.80% 4.12% 3.71%
Basket8 -7.76% 2.96% 5.27%
Contrary to what happened to the shorter analyzed terms, between 1993 and 2012, all the selected equity indices reached a positive nominal annualized return. This is consistent with the theory that stocks have a better performance in the long run. In this period, a portfolio invested in all five indices had a nominal annualized return of 5.27%. Italy (FTSE Italia All-Share) reached the poorest annualized performance in this term, of 2.74% and Germany (DAX 30) was the great outperformer, with a nominal annualized return of 8.30%.
The following table illustrates the correlation of the nominal annual returns between 1993 and 2012 of the five selected equity indices.
8
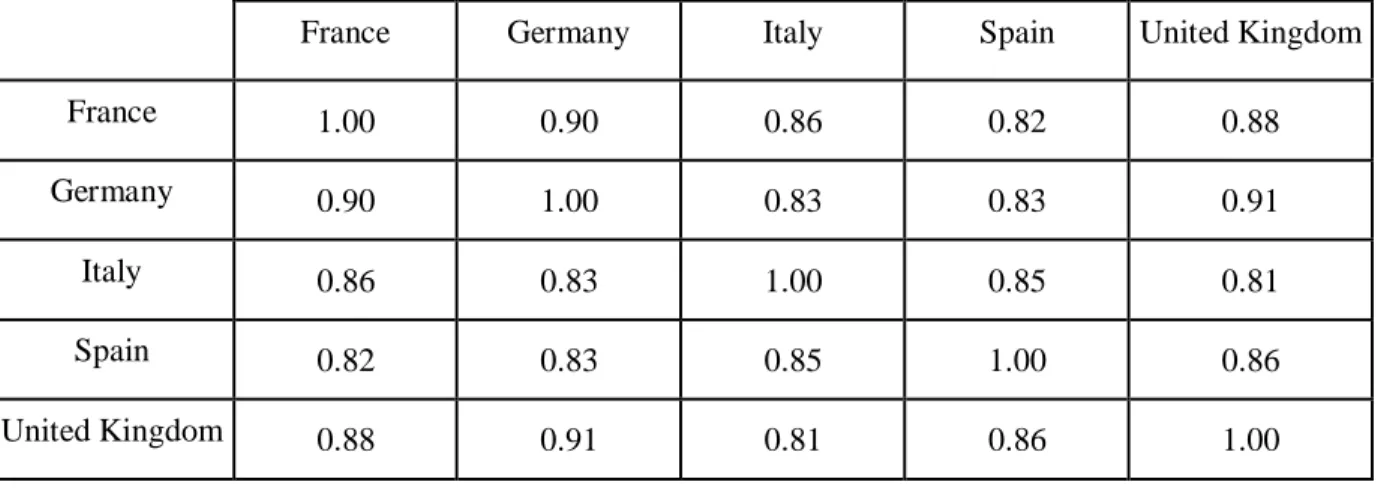
Table 3 - Correlation of Nominal Annual Returns between 1993 and 2012 of the Benchmark
Equity Indices of the 5 Biggest European Economies
France Germany Italy Spain United Kingdom
France 1.00 0.90 0.86 0.82 0.88
Germany 0.90 1.00 0.83 0.83 0.91
Italy 0.86 0.83 1.00 0.85 0.81
Spain 0.82 0.83 0.85 1.00 0.86
United Kingdom 0.88 0.91 0.81 0.86 1.00
The nominal annual returns of equity indices showed strong positive correlations among themselves, since all of the correlations are over 0.80. The strongest correlation was 0.91, between benchmark equity index of Germany and the United Kingdom. Contrary to this, the correlation between Italy and the United Kingdom was only 0.81.
Note that all of the returns previously exposed and analyzed are nominal. Then, we illustrate the comparison of nominal and real annualized returns of selected equity indices along 5 years (2008-2012), 10 years (2003-2012) and 20 years (1993-2012).
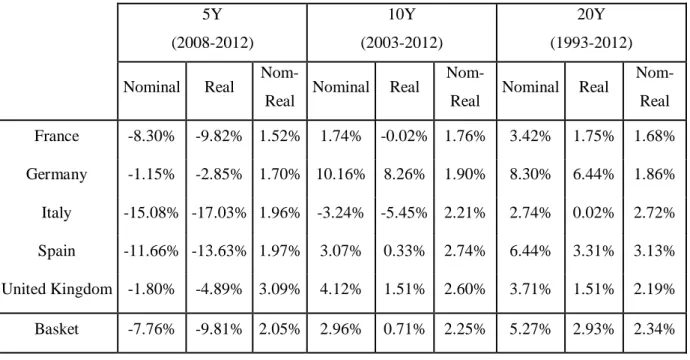
Table 4 - Comparison of Nominal and Real Annualized Returns of the Benchmark Equity
Indices of the 5 Biggest European Economies over the Last 5, 10 and 20 Years
5Y (2008-2012) 10Y (2003-2012) 20Y (1993-2012)
Nominal Real
Nom-Real Nominal Real
Nom-Real Nominal Real
Nom-Real France -8.30% -9.82% 1.52% 1.74% -0.02% 1.76% 3.42% 1.75% 1.68% Germany -1.15% -2.85% 1.70% 10.16% 8.26% 1.90% 8.30% 6.44% 1.86% Italy -15.08% -17.03% 1.96% -3.24% -5.45% 2.21% 2.74% 0.02% 2.72% Spain -11.66% -13.63% 1.97% 3.07% 0.33% 2.74% 6.44% 3.31% 3.13% United Kingdom -1.80% -4.89% 3.09% 4.12% 1.51% 2.60% 3.71% 1.51% 2.19% Basket -7.76% -9.81% 2.05% 2.96% 0.71% 2.25% 5.27% 2.93% 2.34%
Between 1993 and 2012, Spain was the country where inflation had the biggest impact on stocks’ real annualized returns. The difference between the nominal and the real annualized returns was 3.13%. In the same period, the difference between the nominal and the real annualized returns of the French equity index was only 1.68%.
4.2-
Performance of Government Bonds
To evaluate the attractiveness of stocks’ investment, we should look not only to stock returns but also to alternative assets’ returns. When investing in stocks, investors forego the returns obtained by investing in other assets.
The following table illustrates the performance of 5 and 10 years government bonds of the 5 biggest European countries along 5 years (2008-2012), 10 years (2003-2012) and 20 years (1993-2012). We simulate the annualized returns assuming an investment of the same proportion in 5 and 10 years bonds for each represented country. Appendixes 6 to 10 represent the performance of 5 and 10 years government bonds of each country between 1993 and 2012.
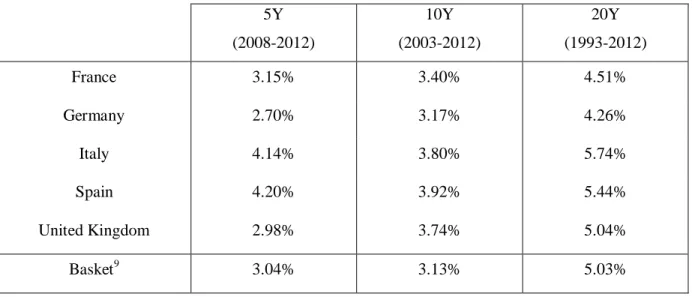
Table 5 - Nominal Annualized Returns of 5 and 10 Years Government Bonds of the 5 Biggest
European Economies over the Last 5, 10 and 20 Years
Between 1993 and 2012, sovereign bonds’ yields of the 5 selected countries dropped. However, due to the debt crisis that has affected the Euro Zone since 2009, Italy and Spain have noted strong increases in their yields. Nonetheless, France and Germany have benefited from the debt crisis by financing their economies at the lowest costs ever.
Between 1993 and 2012, a portfolio invested in selected 5 and 10 years bonds had a nominal annualized return of 5.03%. In this period, Italian bonds reached the highest nominal annualized return of 5.74% and German bonds reached the lowest nominal annualized return of 4.26%.
The following table illustrates the correlation of the nominal annual returns between 1993 and 2012 of 5 and 10 years government bonds of different countries.
9
Portfolio invested in 5 and 10 years bonds of all selected countries with an equal share in each country’s bonds
5Y (2008-2012) 10Y (2003-2012) 20Y (1993-2012) France 3.15% 3.40% 4.51% Germany 2.70% 3.17% 4.26% Italy 4.14% 3.80% 5.74% Spain 4.20% 3.92% 5.44% United Kingdom 2.98% 3.74% 5.04% Basket9 3.04% 3.13% 5.03%
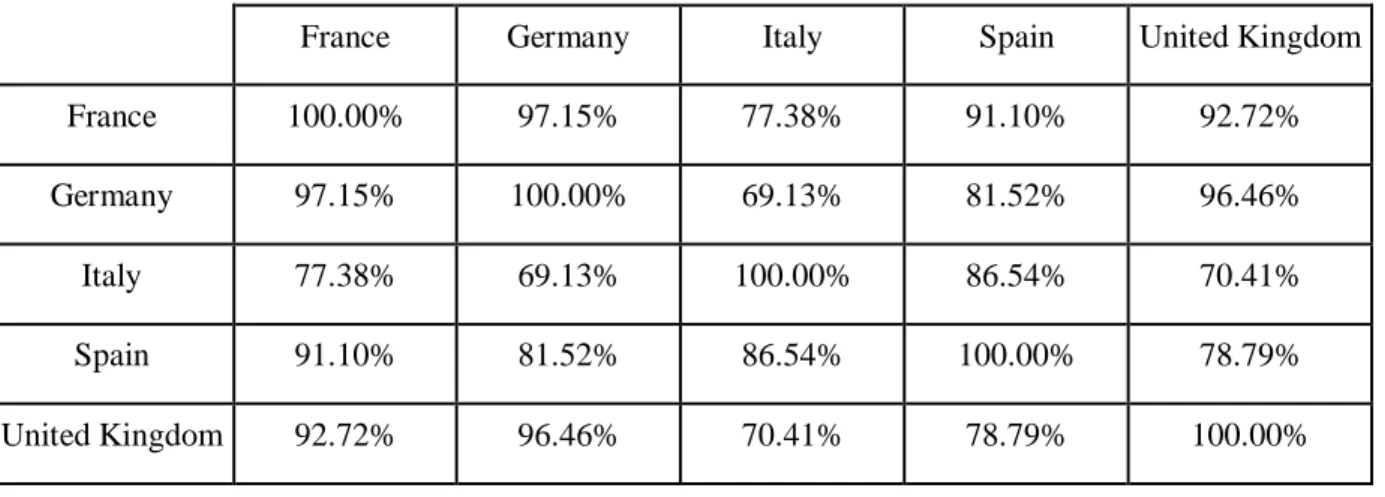
Table 6 - Correlation of Nominal Annual Returns between 1993 and 2012 of 5 and 10 Years
Government Bonds of the 5 Biggest European Economies
France Germany Italy Spain United Kingdom
France 100.00% 97.15% 77.38% 91.10% 92.72%
Germany 97.15% 100.00% 69.13% 81.52% 96.46%
Italy 77.38% 69.13% 100.00% 86.54% 70.41%
Spain 91.10% 81.52% 86.54% 100.00% 78.79%
United Kingdom 92.72% 96.46% 70.41% 78.79% 100.00%
The nominal annual returns of represented 5 and 10 years government bonds evolved all in the same direction and consequently, all computed correlations are positive. The strongest correlation was 97.15%, between German and French bonds. Contrary to this, the correlation between Italian and British bonds was only 70.41%.
Note that all returns previously exposed and analyzed are nominal, so, they do not include the inflation effect. Table 7 illustrates the comparison of nominal and real annualized returns of analyzed government bonds along 5 years (2008-2012), 10 years (2003-2012) and 20 years (1993-2012).
Table 7 - Comparison of Nominal and Real Annualized Returns of 5 and 10 Years
Government Bonds of the 5 Biggest European Economies over the Last 5, 10 and 20 Years
5Y (2008-2012) 10Y (2003-2012) 20Y (1993-2012)
Nominal Real
Nom-Real Nominal Real
Nom-Real Nominal Real
Nom-Real France 3.15% 1.44% 1.72% 3.40% 1.60% 1.79% 4.51% 2.82% 1.69% Germany 2.70% 0.94% 1.77% 3.17% 1.39% 1.78% 4.26% 2.46% 1.79% Italy 4.14% 1.74% 2.40% 3.80% 1.43% 2.37% 5.74% 2.94% 2.80% Spain 4.20% 1.88% 2.32% 3.92% 1.16% 2.76% 5.44% 2.34% 3.10% United Kingdom 2.98% -0.26% 3.24% 3.74% 1.15% 2.59% 5.04% 2.81% 2.22% Basket 3.04% 0.76% 2.28% 3.13% 0.88% 2.25% 5.03% 2.71% 2.32%
Between 1993 and 2012, Spain was the country where inflation had the biggest impact on bonds’ real annualized returns. The difference between nominal annualized and the real return was 3.10%. In the same period, the difference between nominal annualized and the real return of the French government bonds was only 1.69%.
4.3- Comparison between Performance of Equity Indices and Government
Bonds
After we analyze individually the returns of stocks and bonds, it makes sense to compare both returns. The next table illustrates stocks and bonds nominal annualized returns along 5 years (2008-2012), 10 years (2003-2012) and 20 years (1993-2012).
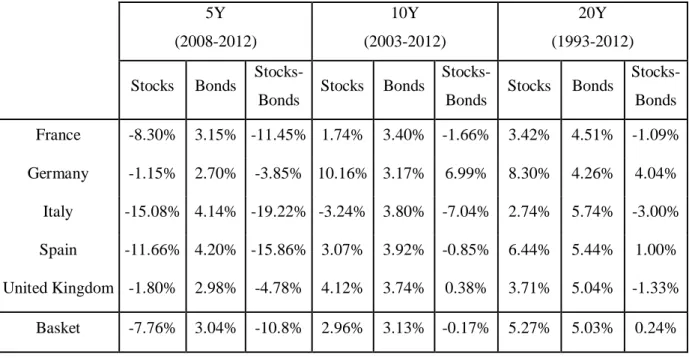
Table 8 – Comparison of Nominal Annualized Returns of the Benchmark Equity Indices and
5 and 10 Years Government Bonds of the 5 Biggest European Economies over the Last 5, 10 and 20 Years 5Y (2008-2012) 10Y (2003-2012) 20Y (1993-2012) Stocks Bonds
Stocks-Bonds Stocks Bonds
Stocks-Bonds Stocks Bonds
Stocks-Bonds France -8.30% 3.15% -11.45% 1.74% 3.40% -1.66% 3.42% 4.51% -1.09% Germany -1.15% 2.70% -3.85% 10.16% 3.17% 6.99% 8.30% 4.26% 4.04% Italy -15.08% 4.14% -19.22% -3.24% 3.80% -7.04% 2.74% 5.74% -3.00% Spain -11.66% 4.20% -15.86% 3.07% 3.92% -0.85% 6.44% 5.44% 1.00% United Kingdom -1.80% 2.98% -4.78% 4.12% 3.74% 0.38% 3.71% 5.04% -1.33% Basket -7.76% 3.04% -10.8% 2.96% 3.13% -0.17% 5.27% 5.03% 0.24%
Stocks are generally associated with a higher risk and a higher potential return when compared to bonds. However, this higher return did not materialize in the analyzed 5 and 10 years horizons in which bonds’ basket outperformed stocks’ basket. On the other hand, despite between 1993 and 2012, stocks’ basket (+5.27%) outperformed bonds’ basket (+5.03%), the returns differential was minimal (0.24%).
Over the three analyzed horizons, the biggest outperformance of bonds relatively to stocks occurred in Italy. Contrary to this, Germany was the country in which stocks performed better when compared to bonds.
The following table illustrates the correlation of the nominal annual returns between 1993 and 2012 of selected equity indices and 5 and 10 years government bonds of each country.
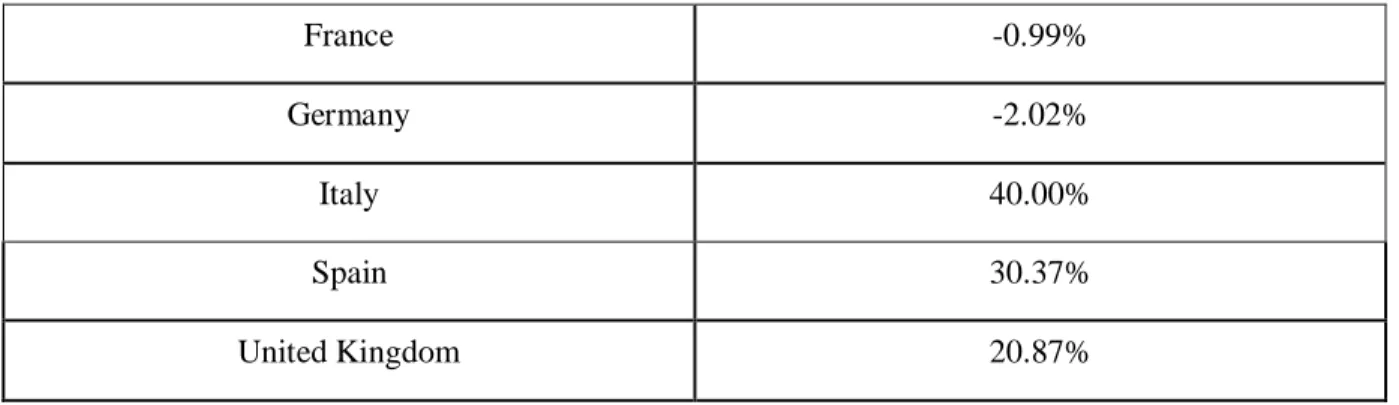
Table 9 - Correlation of Nominal Annual Returns between 1993 and 2012 of the Benchmark
Equity Indices and 5 and 10 Years Government Bonds of the 5 Biggest European Economies
France -0.99%
Germany -2.02%
Italy 40.00%
Spain 30.37%
United Kingdom 20.87%
It makes sense that stocks and bonds returns (measured by their yields) evolve in the same direction. If investors demand more stocks instead of bonds, the stocks prices will rise and bonds prices will fall, thereby increasing bonds yields. This is what happens in Italy, Spain and the United Kingdom. Since French and German bonds are seen as safe haven assets, their prices and yields are less influenced by demand for stocks, which explains why the correlations of stocks’ and bonds’ returns were near to zero.
In order to complement our analysis, we analyze the risk of selected stocks and bonds. Table 10 and figure 1 illustrate stocks and bonds’ risk at various periods between 1993 and 2012, measured by their nominal monthly returns’ annualized volatility.
Table 10 - Annualized Volatility of the Benchmark Equity Indices and 5 and 10 Years
Government Bonds of the 5 Biggest European Economies over the Last 5, 10 and 20 Years
Stocks Bonds
5 Years (2008-2012) 18.22% 2.88%
10 Years (2003-2012) 15.24% 2.55%
Figure 1 - Nominal Monthly Returns’ Annualized Volatility of the Benchmark Equity Indices
and 5 and 10 Years Government Bonds of the 5 Biggest European Economies over Several Time Horizons between 1993 and 2012
The volatility of the returns of equity indices basket was much higher than the volatility of the returns of government bonds basket in any of the analyzed horizons. Moreover, we can see an increasing trend in the volatility of stocks and bonds as the time horizon increases.
4.4- Simulation Results of Portfolios Assuming Annual Reinforcement of
Savings
The wealth accumulated by an investor between age 47 and age 67 will be the sum of the amounts invested at the beginning of each year (1000 Euros per year) capitalized at the annual portfolio return rates ( ) for all subsequent years.
The next table shows the nominal annualized returns of stocks and bonds of the largest European economies at horizons of 1 to 20 years from 1993 to 2012. The 1 year nominal annualized return represents the return obtained from the amount saved at the beginning of 2012 (age 66), the 2 years nominal annualized return represents the average annual return obtained from the amount saved at the beginning of 2011 (age 65), …, and the 20 years nominal annualized return represents the average annual return obtained by the amount saved in the first year (age 47) of saving for retirement.
0% 4% 8% 12% 16% 20% 24% 0 2 4 6 8 10 12 14 16 18 20 Time Horizon
Stocks Annalized Volatility Bonds Annualized Volatility
Table 11 - Nominal Annualized Returns of the Benchmark Equity Indices and 5 and 10 Years
Government Bonds of the 5 Biggest European Economies over Several Time Horizons between 1993 and 2012
Horizon Stocks Bonds
Stocks-Bonds Horizon Stocks Bonds
Stocks-Bonds 1Y (2012) 11.33% 3.90% 7.43% 11Y (2002-2012) -0.88% 3.14% -4.02% 2Y (2011-2012) -2.37% 3.98% -6.35% 12Y (2001-2012) -2.42% 3.35% -5.77% 3Y (2010-2012) -1.81% 3.92% -5.73% 13Y (2000-2012) -2.85% 3.47% -6.32% 4Y (2009-2012) 4.31% 4.09% 0.22% 14Y (1999-2012) -0.65% 3.73% -4.38% 5Y (2008-2012) -7.76% 3.04% -10.80% 15Y (1998-2012) 0.97% 3.76% -2.79% 6Y (2007-2012) -5.91% 2.89% -8.80% 16Y (1997-2012) 3.20% 4.11% -0.91% 7Y (2006-2012) -2.54% 3.03% -5.57% 17Y (1996-2012) 4.46% 4.51% -0.05% 8Y (2005-2012) 0.07% 3.17% -3.10% 18Y (1995-2012) 4.56% 4.66% -0.10% 9Y (2004-2012) 1.25% 3.26% -2.01% 19Y (1994-2012) 3.71% 4.74% -1.03% 10Y (2003-2012) 2.96% 3.13% -0.17% 20Y (1993-2012) 5.27% 5.03% 0.24%
In the 20 analyzed periods, stocks outperformed bonds 3 times: in the 1, 4 and 20 years horizons. We observe that as the time horizon increases, the performance of stocks and bonds improved (appendixes 11 and 12). Furthermore, as the time horizon increases, there was a slight upward trend in the performance of stocks, when compared to bonds (appendix 13). After analyzing the nominal annualized returns of selected stocks and bonds over the different time horizons, we can better interpret and understand the results of wealth accumulated by portfolios 1 to 7 between 1993 and 2012. These results are illustrated in the following table and figure:
Table 12 - Wealth Accumulated by Portfolios 1 to 7 between 1993 and 2012 Assuming
Annual Savings of 1,000 Euros (Ignoring Inflation)
Portfolio 1 25,039 Portfolio 2 26,048 Portfolio 3 27,308 Portfolio 4 28,947 Portfolio 5 31,211 Portfolio 6 31,201 Portfolio 7 29,984
Figure 2 - Comparison of Wealth Accumulated by Portfolios 1 to 7 between 1993 and 2012
Assuming Annual Savings of 1,000 Euros (Ignoring Inflation)
Between 1993 and 2012, bonds were the asset class with the best performance considering annual reinforcements of savings, since they outperformed stocks in almost all 20 horizons illustrated above. Consequently, among the age-invariant portfolios (portfolios 1 to 5), those which have a higher share invested in bonds produced the highest returns.
On the other hand, the performance of stocks compared to bonds increased with the time horizon and lifecycle portfolios (portfolios 6 and 7) benefited from it by investing more in
0 5000 10000 15000 20000 25000 30000 35000
Comparison of Wealth Acumulation
Portfolio 1 Portfolio 2 Portfolio 3 Portfolio 4 Portfolio 5 Portfolio 6 Portfolio 7
stocks during the early years (when the investment horizon was longer), and increasing the portfolio’s share held in bonds as the investment horizon decreases.
Throughout the period under study, portfolio 6 held on average 56.5% of bonds, a lower share than age-invariant portfolios 4 and 5. Despite this, the accumulated wealth of portfolio 6 at the date of retirement age overcame portfolio 4. In the same period, portfolio 7 held on average 36.5% of bonds, which is a lower share than age-invariant portfolios 3, 4 and 5. Even so, the accumulated wealth of portfolio 7 at the date of retirement overcame portfolios 3 and 4, being only overtaken by 5 (which only hold bonds). Results suggest that lifecycle allocation optimizes portfolio profitability.
The results considered so far in this study ignore the effect of inflation. The next table illustrates the real annualized returns of stocks and bonds of the largest European economies at horizons of 1 to 20 years from 1993 to 2012.
Table 13 - Real Annualized Returns of the Benchmark Equity Indices and 5 and 10 Years
Government Bonds of the 5 Biggest European Economies over Several Time Horizons between 1993 and 2012
Horizon Stocks Bonds
Stocks-Bonds Horizon Stocks Bonds
Stocks-Bonds 1Y (2012) 8.68% 1.41% 7.27% 11Y (2002-2012) -3.04% 0.89% -3.93% 2Y (2011-2012) -4.97% 1.21% -6.18% 12Y (2001-2012) -4.53% 1.12% -5.65% 3Y (2010-2012) -4.18% 1.43% -5.61% 13Y (2000-2012) -4.93% 1.26% -6.19% 4Y (2009-2012) 2.26% 2.06% 0.20% 14Y (1999-2012) -2.71% 1.58% -4.29% 5Y (2008-2012) -9.81% 0.76% -10.57% 15Y (1998-2012) -1.08% 1.66% -2.74% 6Y (2007-2012) -7.99% 0.62% -8.61% 16Y (1997-2012) 1.13% 2.03% -0.90% 7Y (2006-2012) -4.70% 0.75% -5.45% 17Y (1996-2012) 2.33% 2.38% -0.05% 8Y (2005-2012) -2.15% 0.89% -3.04% 18Y (1995-2012) 2.36% 2.46% -0.10% 9Y (2004-2012) -0.98% 0.99% -1.97% 19Y (1994-2012) 1.49% 2.49% -1,00% 10Y (2003-2012) 0.71% 0.88% -0.17% 20Y (1993-2012) 2.93% 2.71% 0.22%
Considering the real, instead of nominal annualized returns, stocks also outperformed bonds for 3 times: in the 1, 4 and 20 years horizons. Since annualized inflation was positive in all
analyzed periods, the real annualized returns were lower than the nominal annualized returns. The trends observed in the real annualized returns were the same as those observed in the nominal annualized returns: As the time horizon increases, the performance of stocks and bonds also improves (appendixes 14 and 15) and there is also a slight upward trend in the performance of stocks when compared to bonds (appendix 16).
After analyzing the real annualized returns of stocks and bonds over the different time horizons, we can better interpret and understand the results of wealth accumulated by portfolios 1 to 7 between 1993 and 2012. These results are illustrated in the following table and figure:
Table 14 - Wealth Accumulated by Portfolios 1 to 7 between 1993 and 2012 Assuming
Annual Savings of 1,000 Euros (Considering Inflation)
Portfolio 1 19,349 Portfolio 2 20,148 Portfolio 3 21,146 Portfolio 4 22,441 Portfolio 5 24,228 Portfolio 6 23,899 Portfolio 7 23,059
Figure 3 - Comparison of Wealth Accumulated by Portfolios 1 to 7 between 1993 and 2012
Assuming Annual Savings of 1,000 Euros (Considering Inflation)
Considering the real instead of nominal annualized returns, the wealth accumulated by portfolios 1 to 7 between 1993 and 2012 was lower. In real terms, portfolio 1 lost capital during this period, once the investor saved 20,000 Euros over time (1,000 Euros over twenty years), and at retirement age, he only has 19,349 Euros. This means that the stocks nominal annualized returns were not enough to offset the inflation.
Considering the real instead of nominal returns, the relative performance of the portfolios was similar:
Among the age-invariant portfolios, those which have a higher share invested in bonds produced the highest returns
On the other hand, lifecycle portfolios achieved the best performance of all, with the exception of portfolio 5, surpassing even those age-invariant portfolios with higher average shares held in bonds. Once again, results suggest that lifecycle allocation optimizes portfolio profitability. 0 5000 10000 15000 20000 25000 30000 35000
Comparison of Wealth Acumulation
Portfolio 1 Portfolio 2 Portfolio 3 Portfolio 4 Portfolio 5 Portfolio 6 Portfolio 7
5-
Conclusions
5.1- Results Interpretation
In this section, we answer the questions proposed in the section of the hypotheses of the study: 1) Do stocks outperform bonds in the long term?
We anticipated that our results confirm that stocks outperform bonds in the long term. Thereby, we supposed the existence of a positive risk premium which corresponds to the excess of the returns in stocks compared to bonds.
Once stock investments have more risk than bonds investments, they are generally associated to a larger potential return. In agreement with this, Jagannathan and Kocherlakota (1996) document the historical returns on S&P-500 stocks and United States Treasury bills from 1926 until 1990. They find that during this period, stocks returned 8.8% and bills returned 0.6% yearly, on average.
In fact, we find that between 1993 and 2012, selected stocks outperformed selected bonds. Furthermore, we verify that the performance of stocks compared to bonds show an increasing trend as the time horizon increases.
We find that the performance of selected bonds exceeds the performance of selected stocks in the analyzed 5 and 10 years horizons. However, between 1993 and 2012, a portfolio invested in equity indices of 5 biggest European economies corresponded to a higher return (+5.27%) than a portfolio invested in 5 and 10 years bonds of the same countries (+5.03%). Unlike what has happened in the mentioned study which focused on United States markets, our results suggest that stocks and bonds portfolio’s differential returns were minimal (risk premium of only 0.24 percentage points).
For the duration of the time frame under review (1993 to 2012), there were three financial crises which affected Europe and may justify the weak performance of stocks: There was the early 2000s recession; the financial Global Financial Crisis of 2007-2008 and the European sovereign debt crisis which started in 2009. All these events had a negative impact on European stock markets. In addition, current European sovereign debt crisis increased bonds yields of Euro Zone peripheral countries, further harming the difference between the returns of stocks and bonds of these countries.
2) Does the risk of stocks decrease in the long term?
We expected that our results support the idea that stocks’ risk diminishes in the long term, being in agreement with conventional financial literature.
According to conventional financial literature, volatility of stock returns reduces in long term. Glassman and Hasset (1999) argue that over the long term, stocks are less risky than treasury bonds; Siegel (2007) demonstrates that over long periods of time, stock returns become more predictable than bond returns in terms of purchasing power; Barberis (2000) argues that are less risky at long horizons and investors should allocate more to equities as the investment horizon increases; and Coggeshall and Wu (2005) find that bonds are riskier than stocks to hold in periods equal or greater than 15 years.
Contrary to what we predict, considering the standard deviation of returns of a portfolio invested in benchmark equity indices of the 5 biggest European economies from 1993 to 2012, we find that the risk of stocks increased instead of decreasing with the time horizon. Furthermore, although the risk of bonds also has increased with the horizon, the risk of investing in stocks remained much higher than that of bonds at any timeframe under study. According to our results, if investors seek to minimize the risk of investing in stocks, it would make sense to invest less in stocks for longer horizons. This is exactly the opposite of what lifecycle investment policies suggest.
The high volatility of stocks under study may be explained by the occurrence of three financial crises which affected Europe from 1993 to 2012. On the other hand, the period may be too short to observe the trend of volatility in the long term.
3) Does the following of lifecycle strategies translate into more wealth accumulated by retirement age compared with other age-independent strategies?
We forecasted that by investing solely in stocks investors accumulate more wealth until retirement age than by following lifecycle strategies.
Focusing on American equity markets, Poterba, Rauh, Venti and Wise (2006), analyze how different asset allocation strategies throughout the investor work career affect the retirement wealth and the expected utility of wealth at retirement. They consider rules that allocate a
constant portfolio share to different assets at all investor ages and "lifecycle rules” which vary the share of the portfolio held in equities and bonds with the advancing age of the investor. They find that the historical performance of stocks and bonds returns implies a higher expected utility of an all-stock investment allocation rule comparatively to more conservative strategies.
We also simulate the returns of several age-invariant strategies, such as a portfolio entirely composed of stocks, a portfolio entirely composed of bonds, and a portfolio which holds the same share of stocks and bonds. We also consider two lifecycle portfolios, that is, portfolios which decrease the share held in stocks and increase the share held in bonds as investors grow older.
Our results are not as we expected and our conclusions differ from those of other authors who focused in the United States. This happens because in our study the performance of stocks compared to bonds was much lower.
Considering annual strengthening of savings between 1993 and 2012, including whether or not the effect of inflation, we conclude that among the various age-invariant portfolios, those which have a higher share invested in bonds produced the highest returns. To better understand these results, we illustrate the annualized returns of stocks and bonds of the largest European economies at horizons of 1 to 20 years from 1993 to 2012. Bonds were the asset class with the best performance considering annual reinforcements of savings, since they outperformed stocks in almost all 20 illustrated horizons.
On the other hand, the performance of stocks compared to bonds increased with the time horizon, and lifecycle portfolios (portfolios 6 and 7) benefited from it by investing more in stocks during the early years (when the investment horizon was longer), and increasing the portfolio’s share held in bonds as the investment horizon decreases. Regardless of considerations for the effects of inflation, with the exception of the portfolio entirely composed of bonds, lifecycle portfolios outperformed all age-invariant portfolios, surpassing even the others portfolios with higher average shares held in bonds.
Our results suggest that a lifecycle allocation optimizes portfolio profitability. According to the performance of European equity and bond markets between 1993 and 2012, it makes sense that many investors allocate their portfolios according to lifecycle rules.
5.2- Limitations of this Work
We must emphasize that the analyzed time horizon is fairly short, and in the case of looking at a longer time horizon, the conclusions may not be the same. However, limitations in the availability of historical data for some of the selected equity indices preclude a much more extensive temporal analysis on this date.
It is important to note that we only simulate wealth accumulation for a few potential asset allocations. In reality, there are endless investment strategies that can be followed and which are not included in our analysis.
Finally, we focus on an assets’ past performance and the future may be completely different from the past. For instance, looking at the performance of some equity markets in the early years of the current century, we can doubt that previous century performance will be repeated. The German benchmark equity index DAX 30 reached an annualized return of 9.95% between 1971 and 1999, and it only returned 0.69%, yearly on average for the first 13 years of the current century.
5.3- Suggestions for Future Research
Our analysis suggests some issues that may inspire future researches. We think it would be useful to update this analysis in the future when there is more historic data of equity markets under study.
We also suggest the use of different government bond indices to analyze bonds’ historical performance. These indices should represent a bond investment more diversified than the 5 and 10 years government bond generic indices considered in this work.
Finally, we find some interest in the execution of the same analysis, but assuming future returns instead of past returns. We suggest using the forecasts made by select highly regarded economists for European stocks and bonds returns for the next decades.